10 years after Deepwater Horizon oil spill
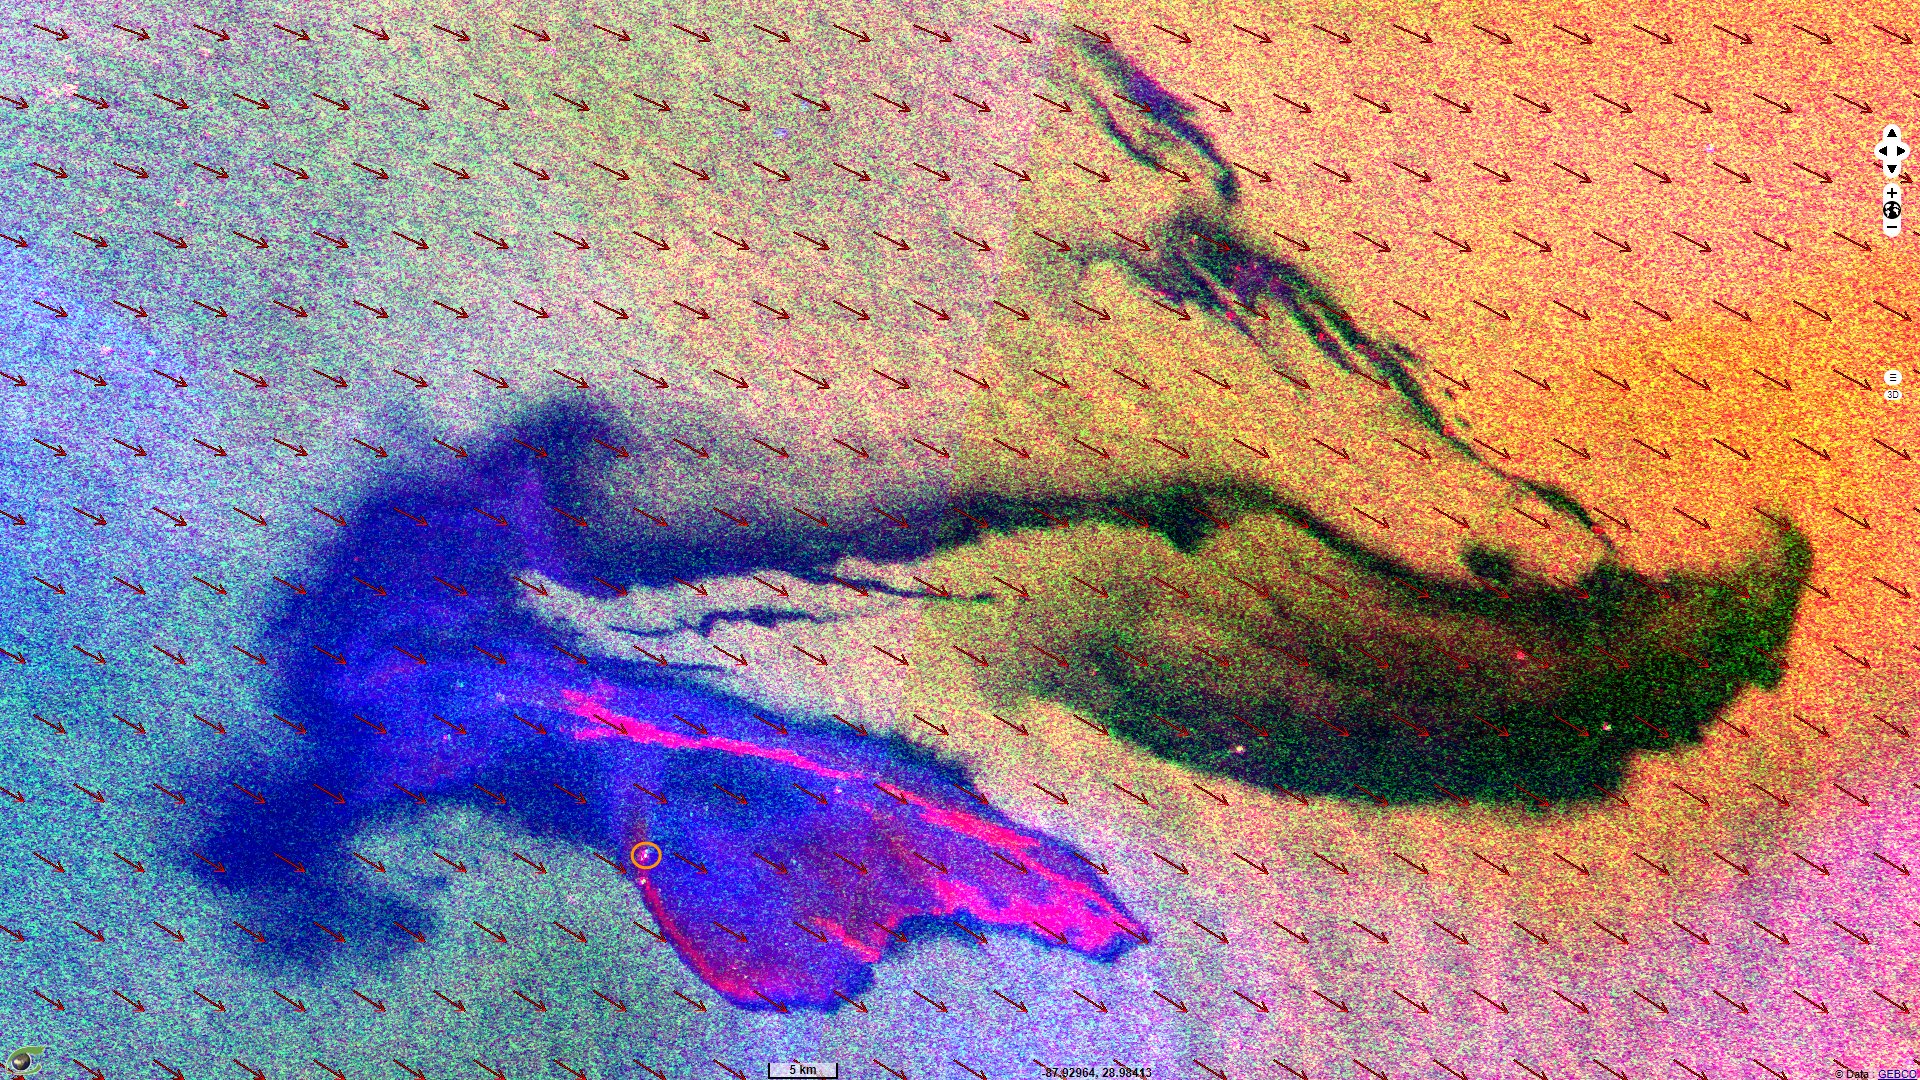
Sentinel-1 CSAR IW acquired on 08 April 2020 from 23:35:30 to 23:37:10 UTC
...
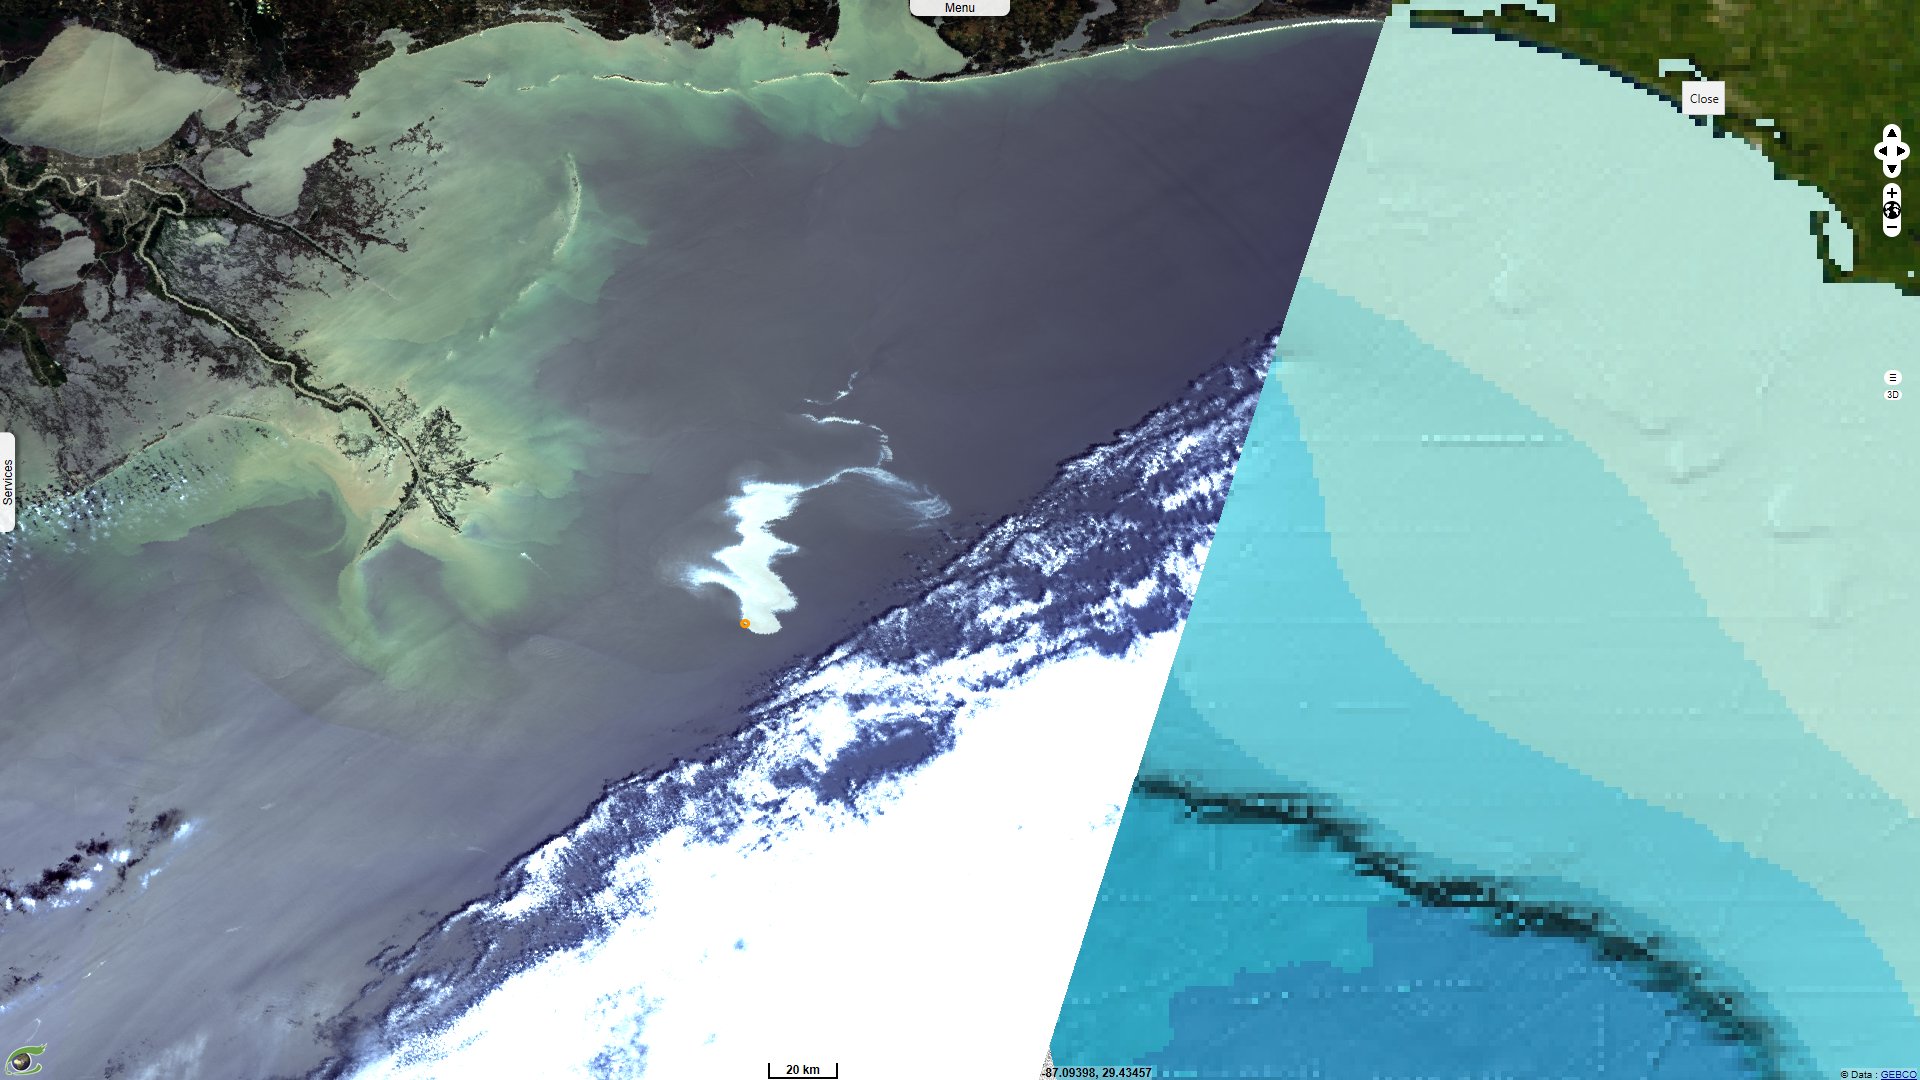
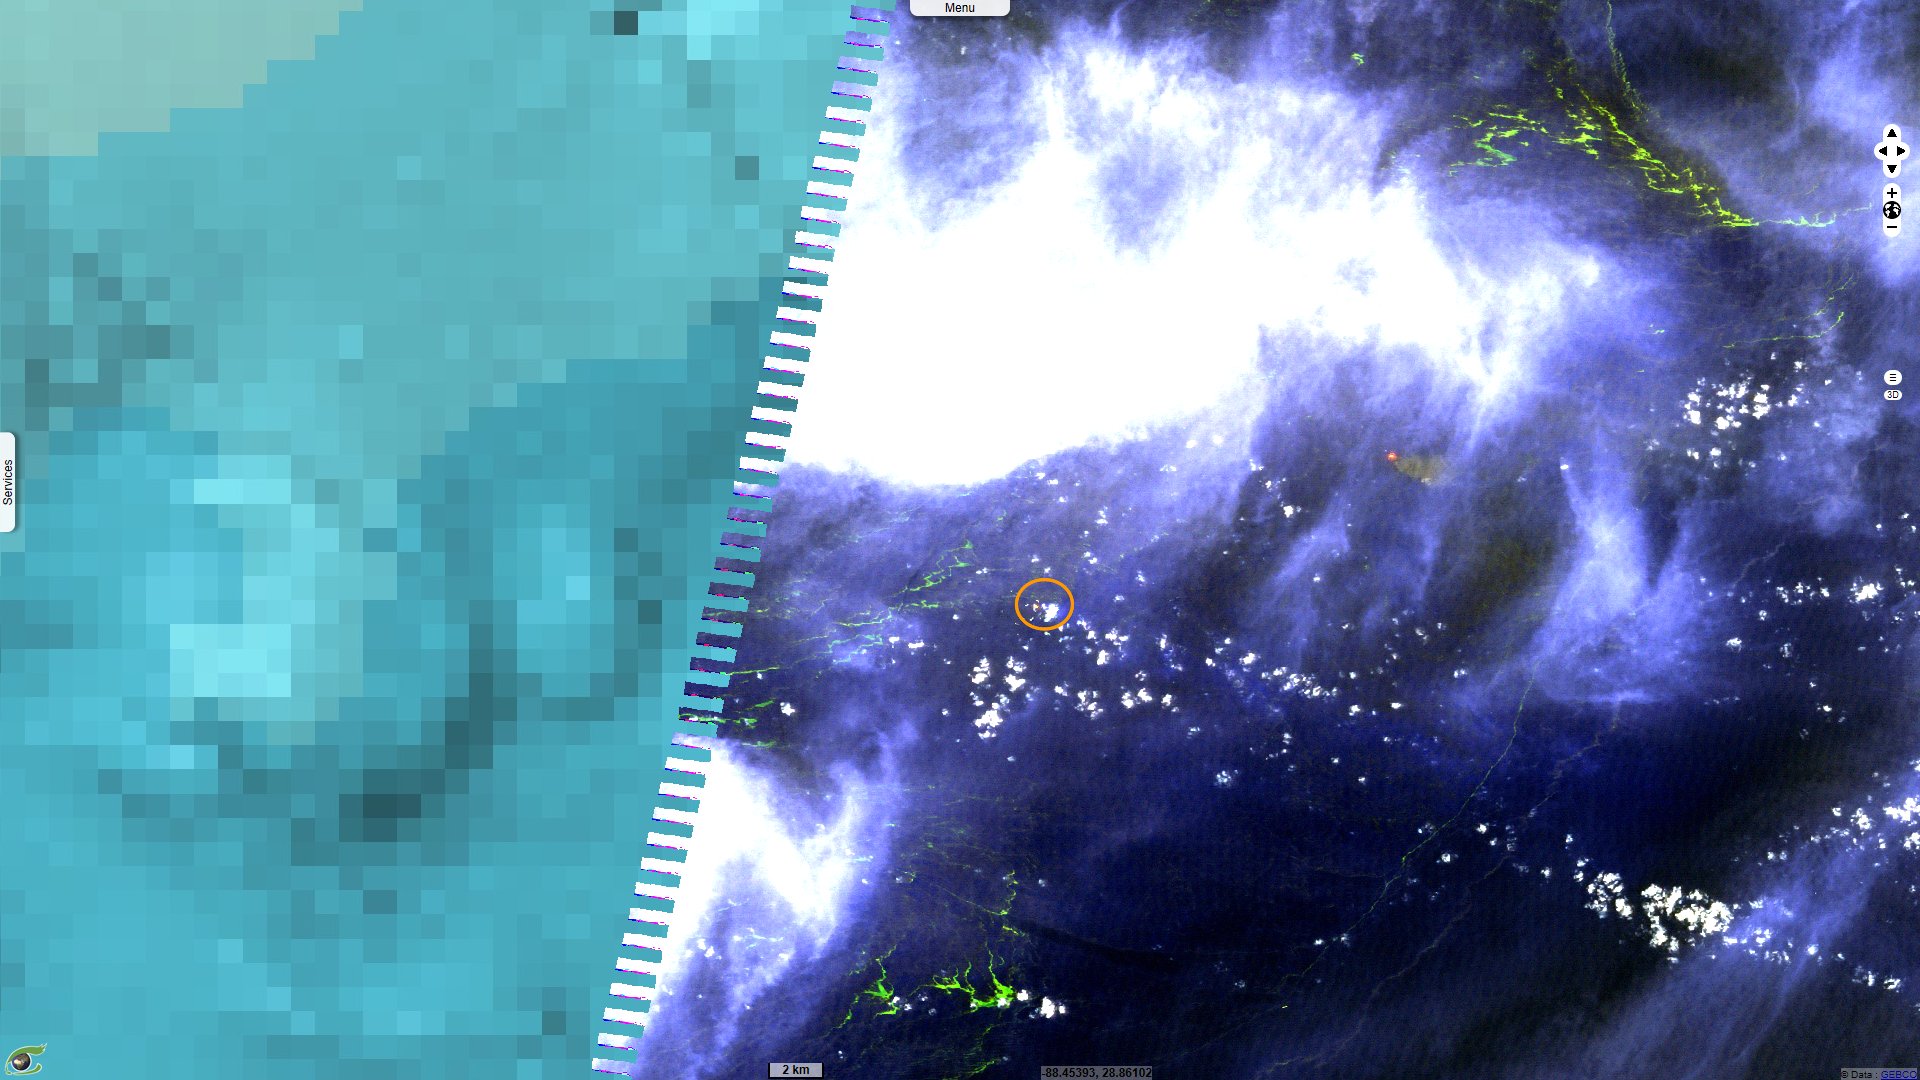
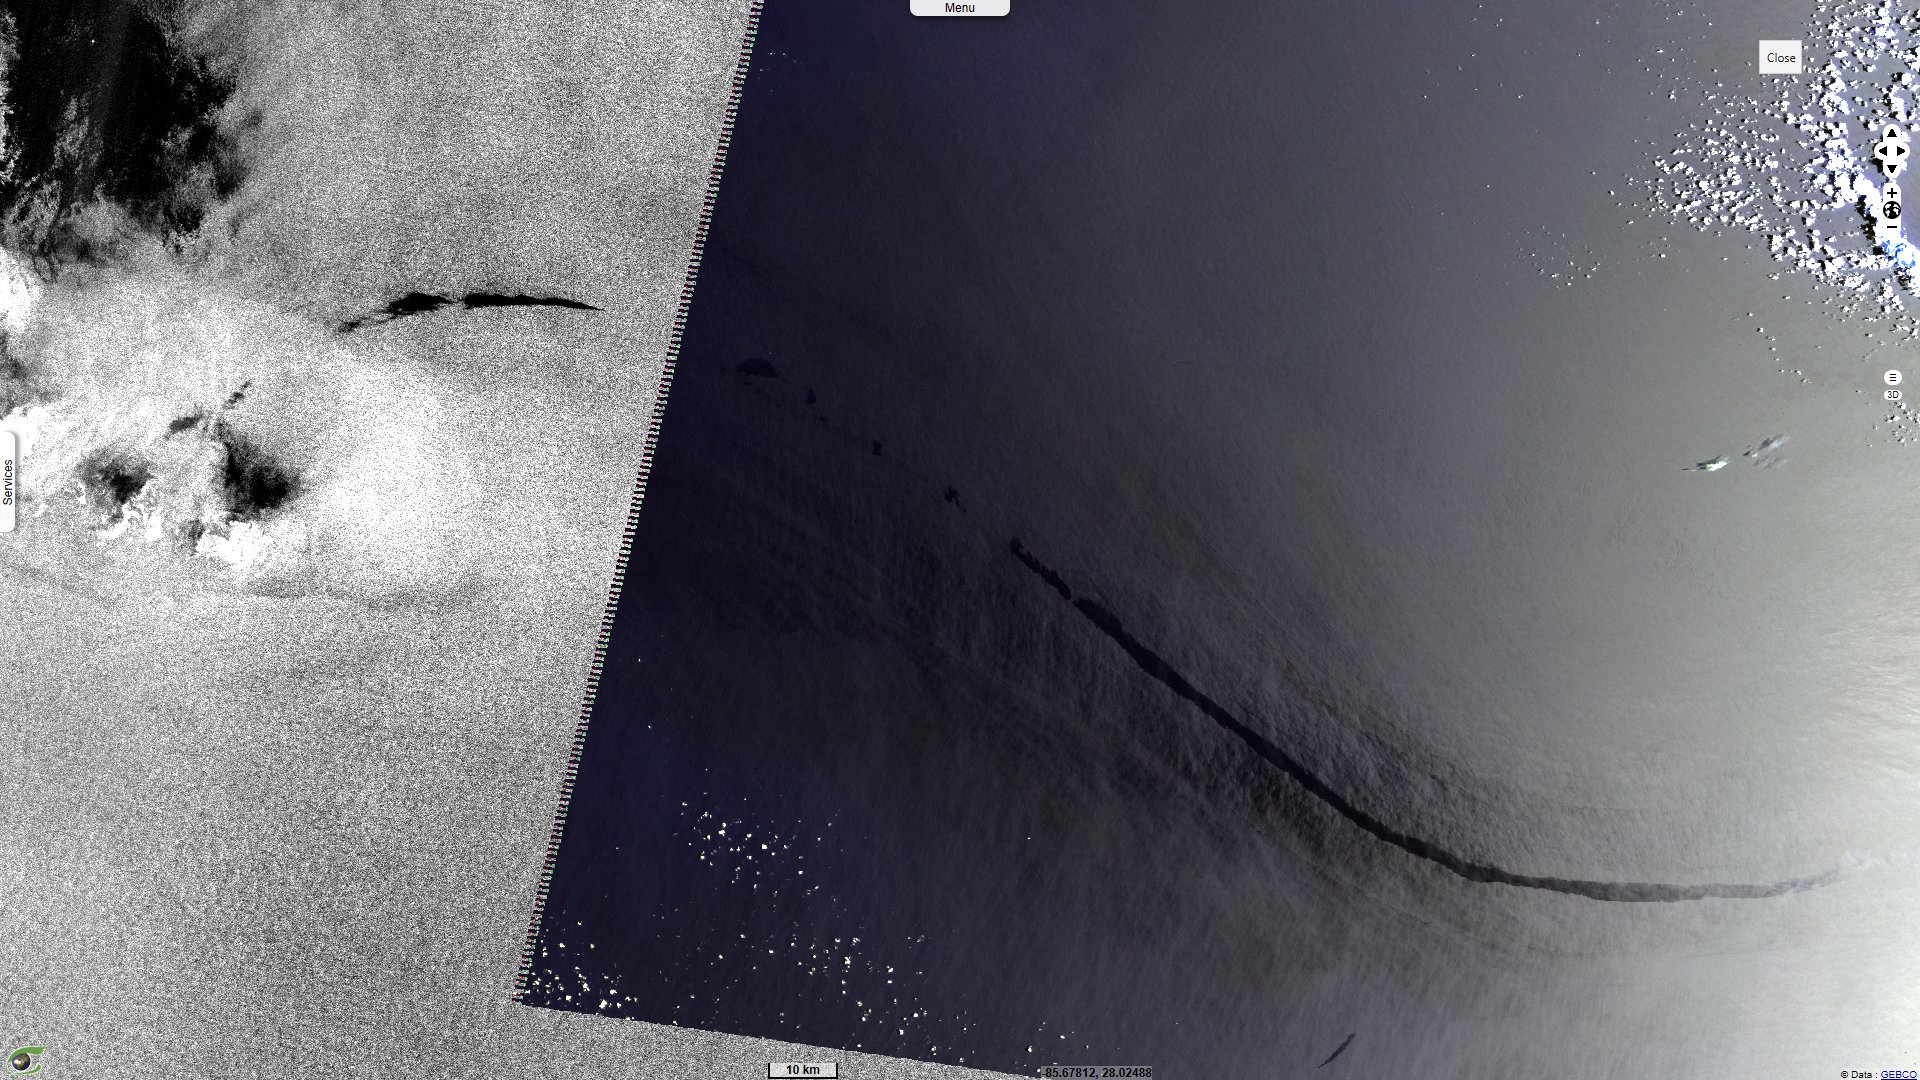
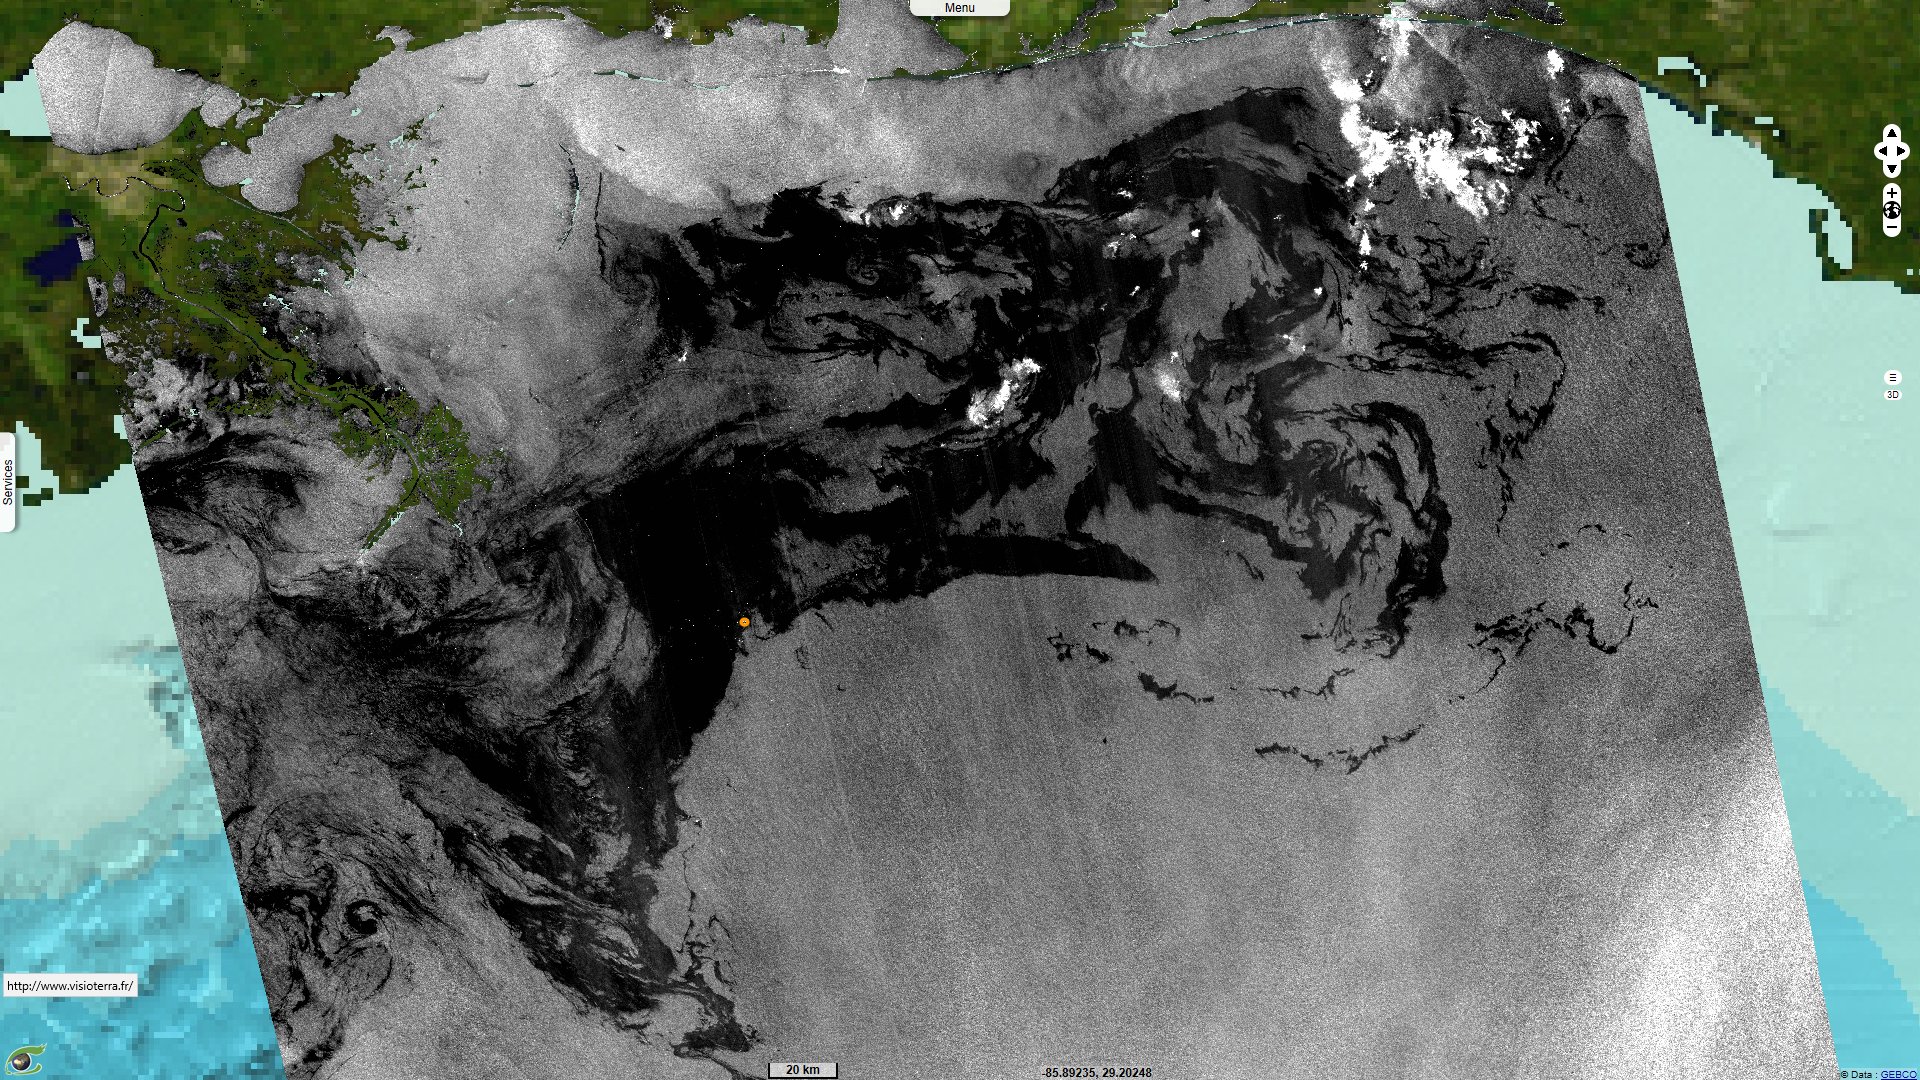
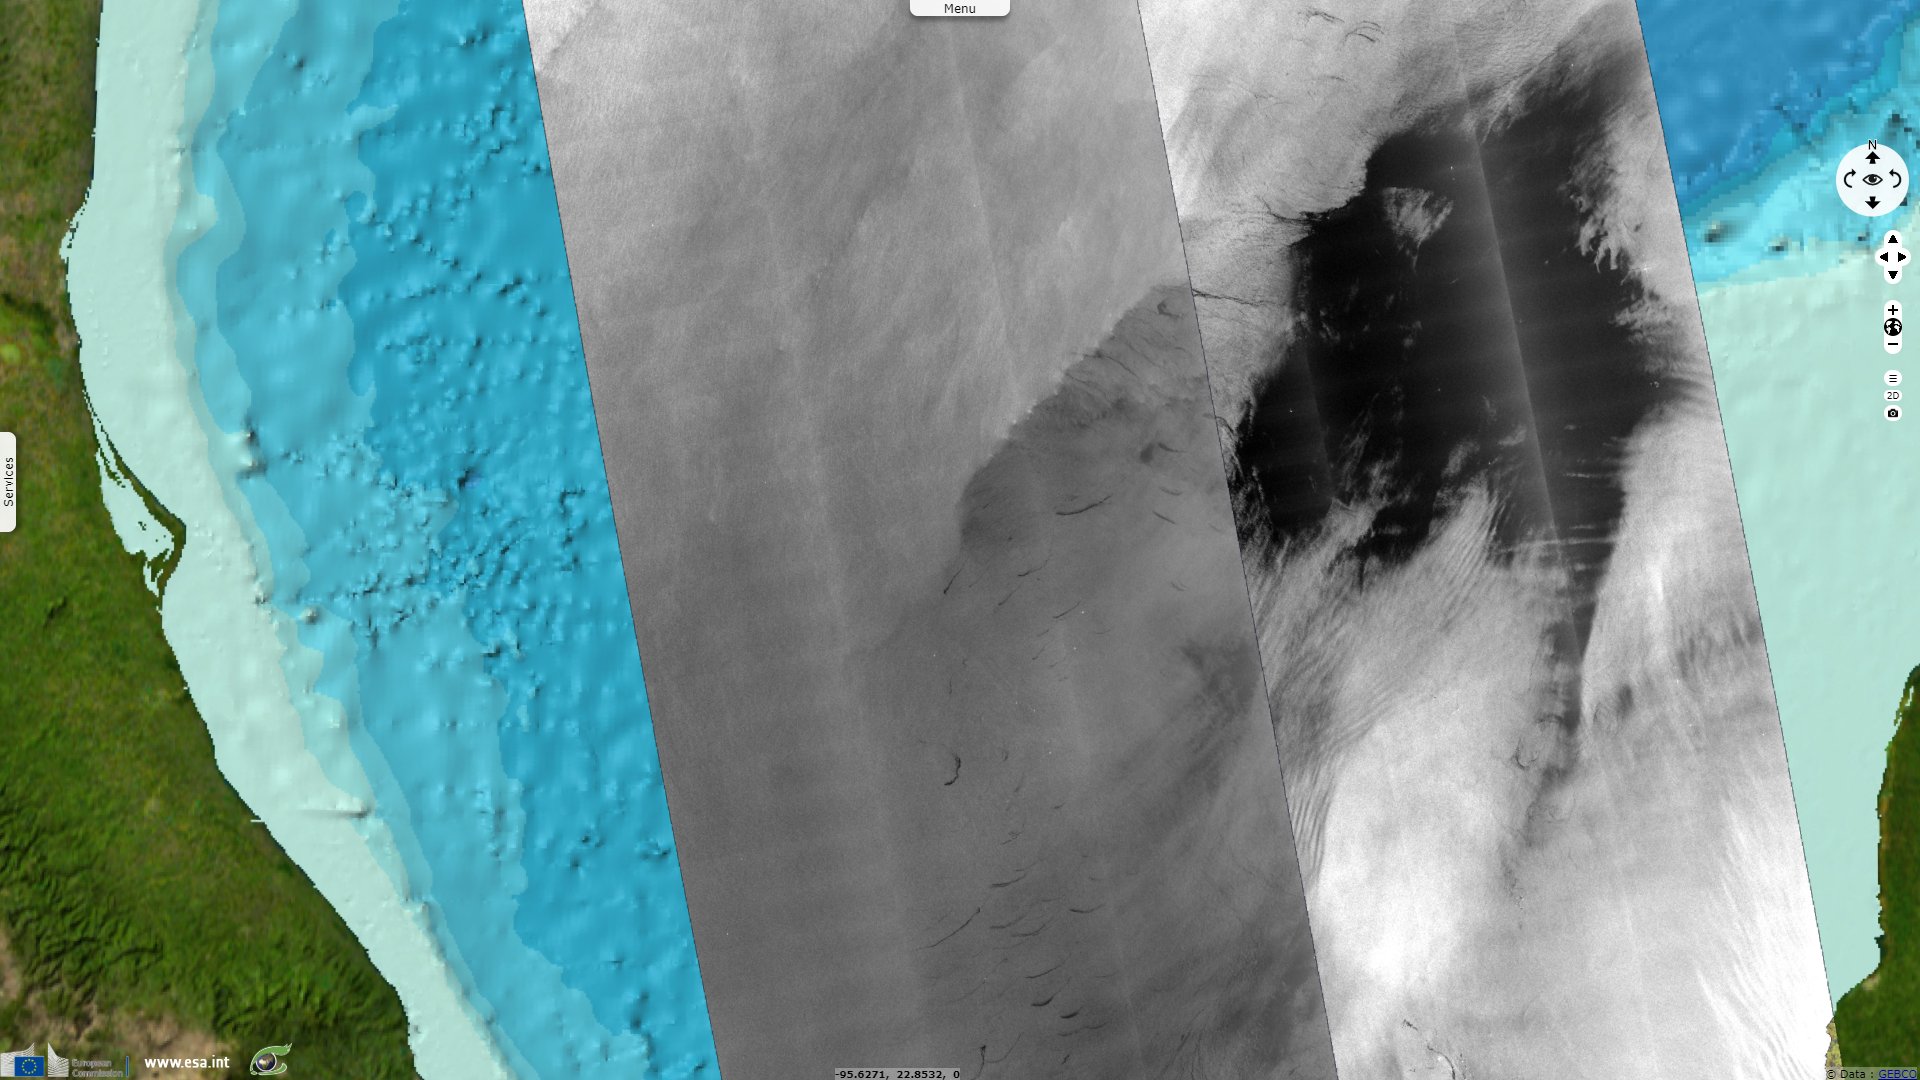
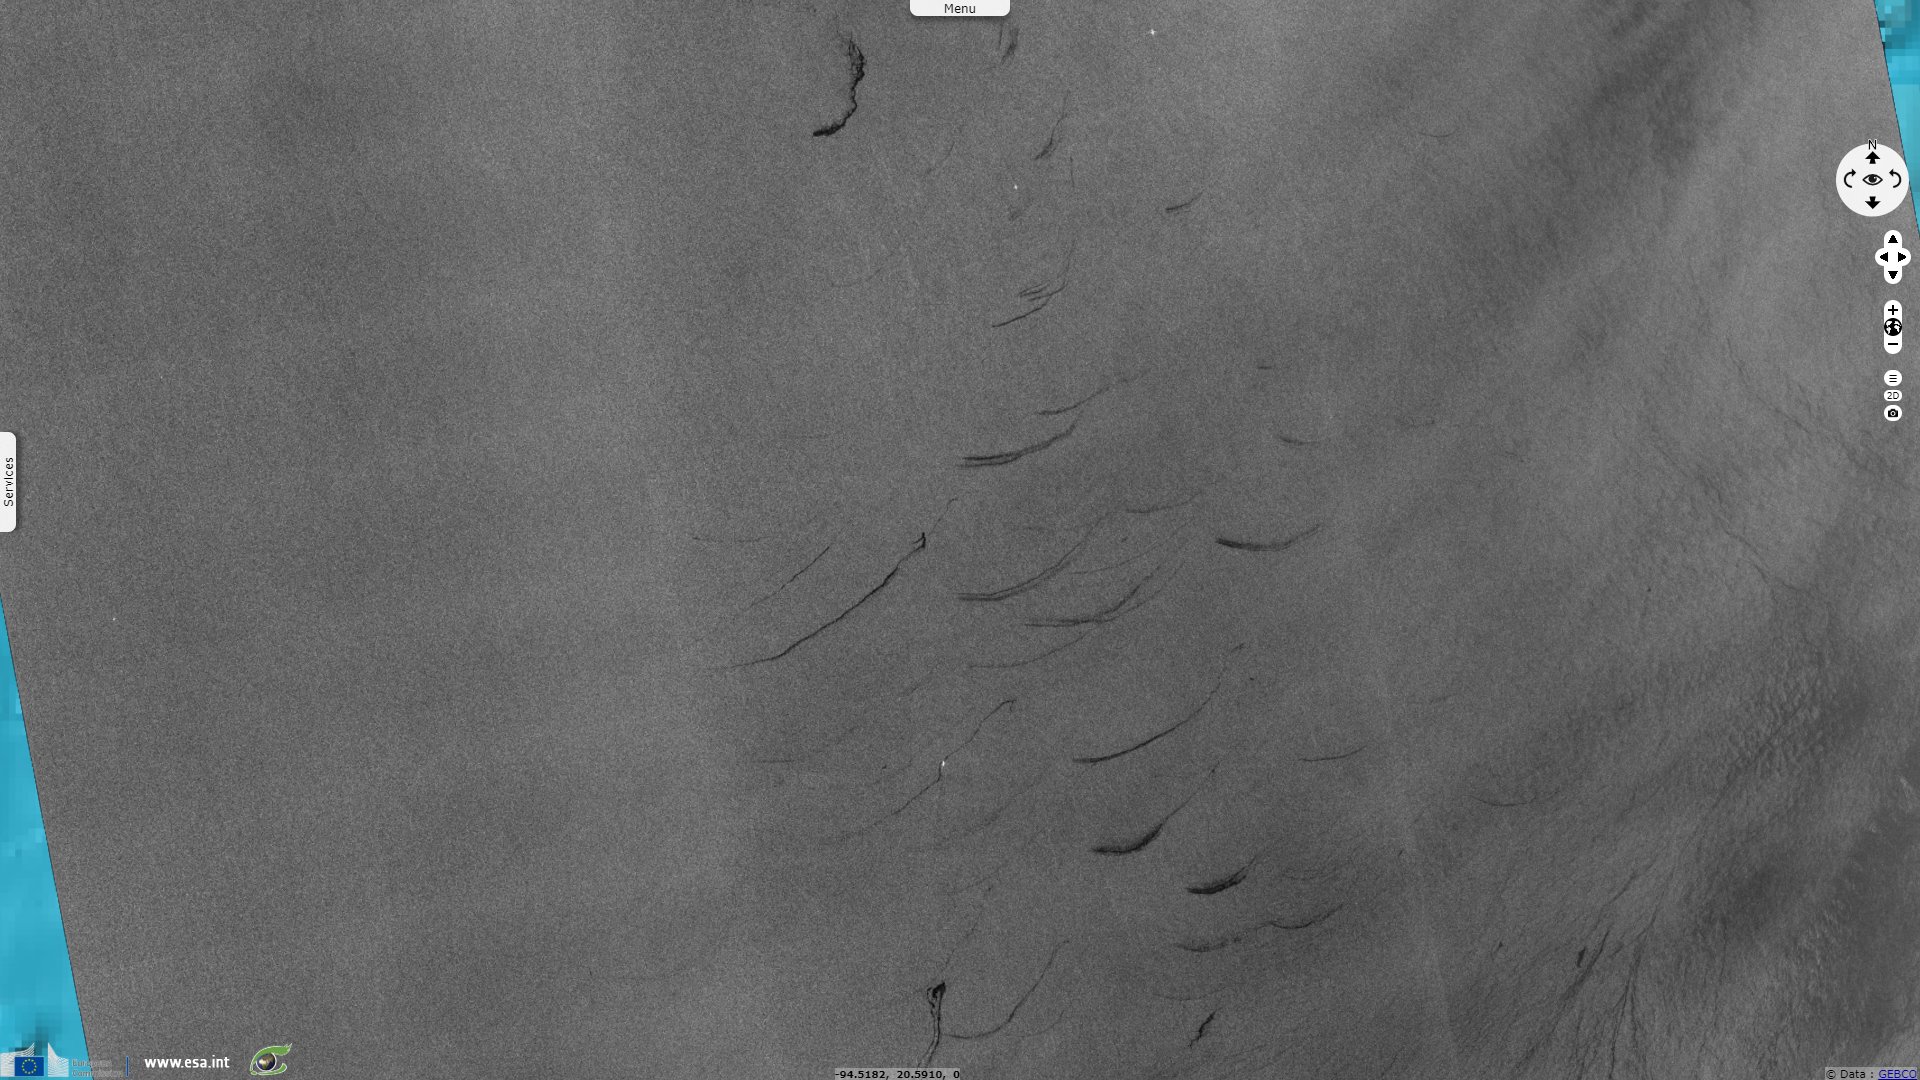
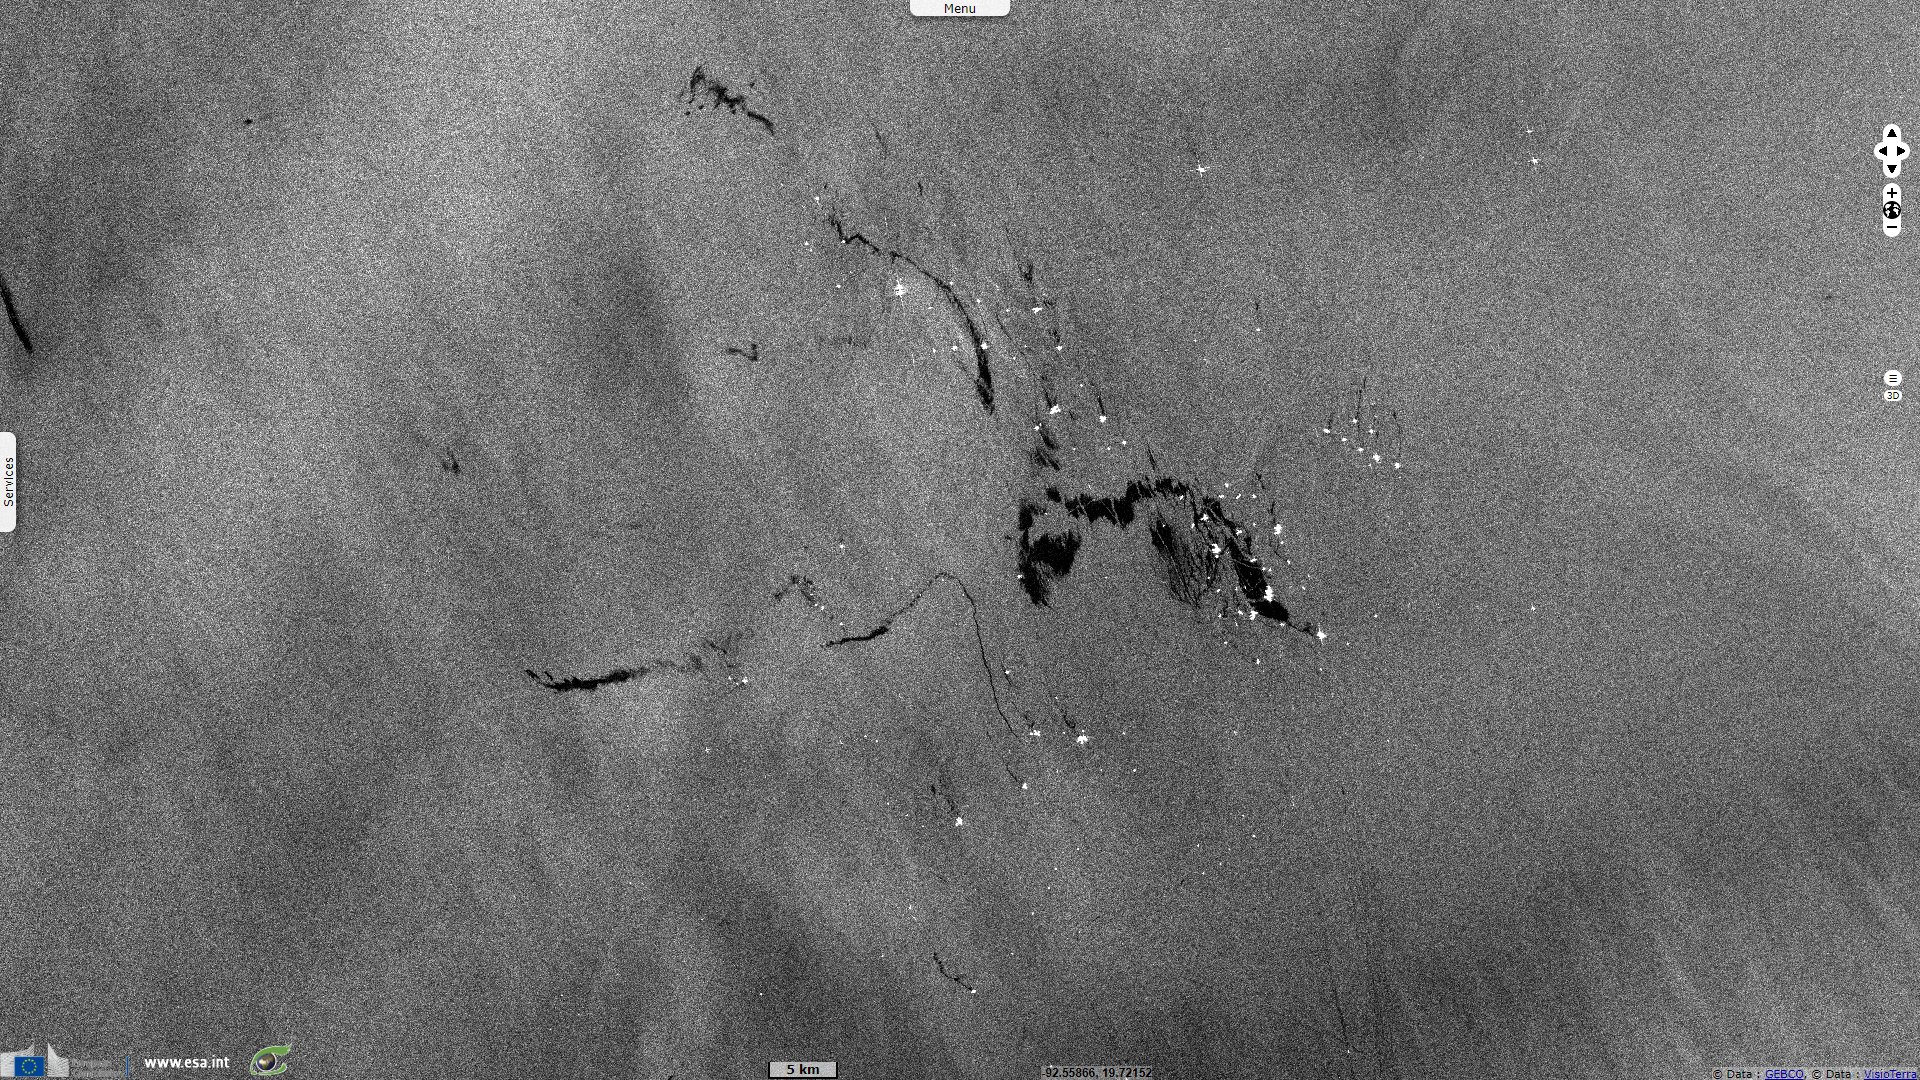
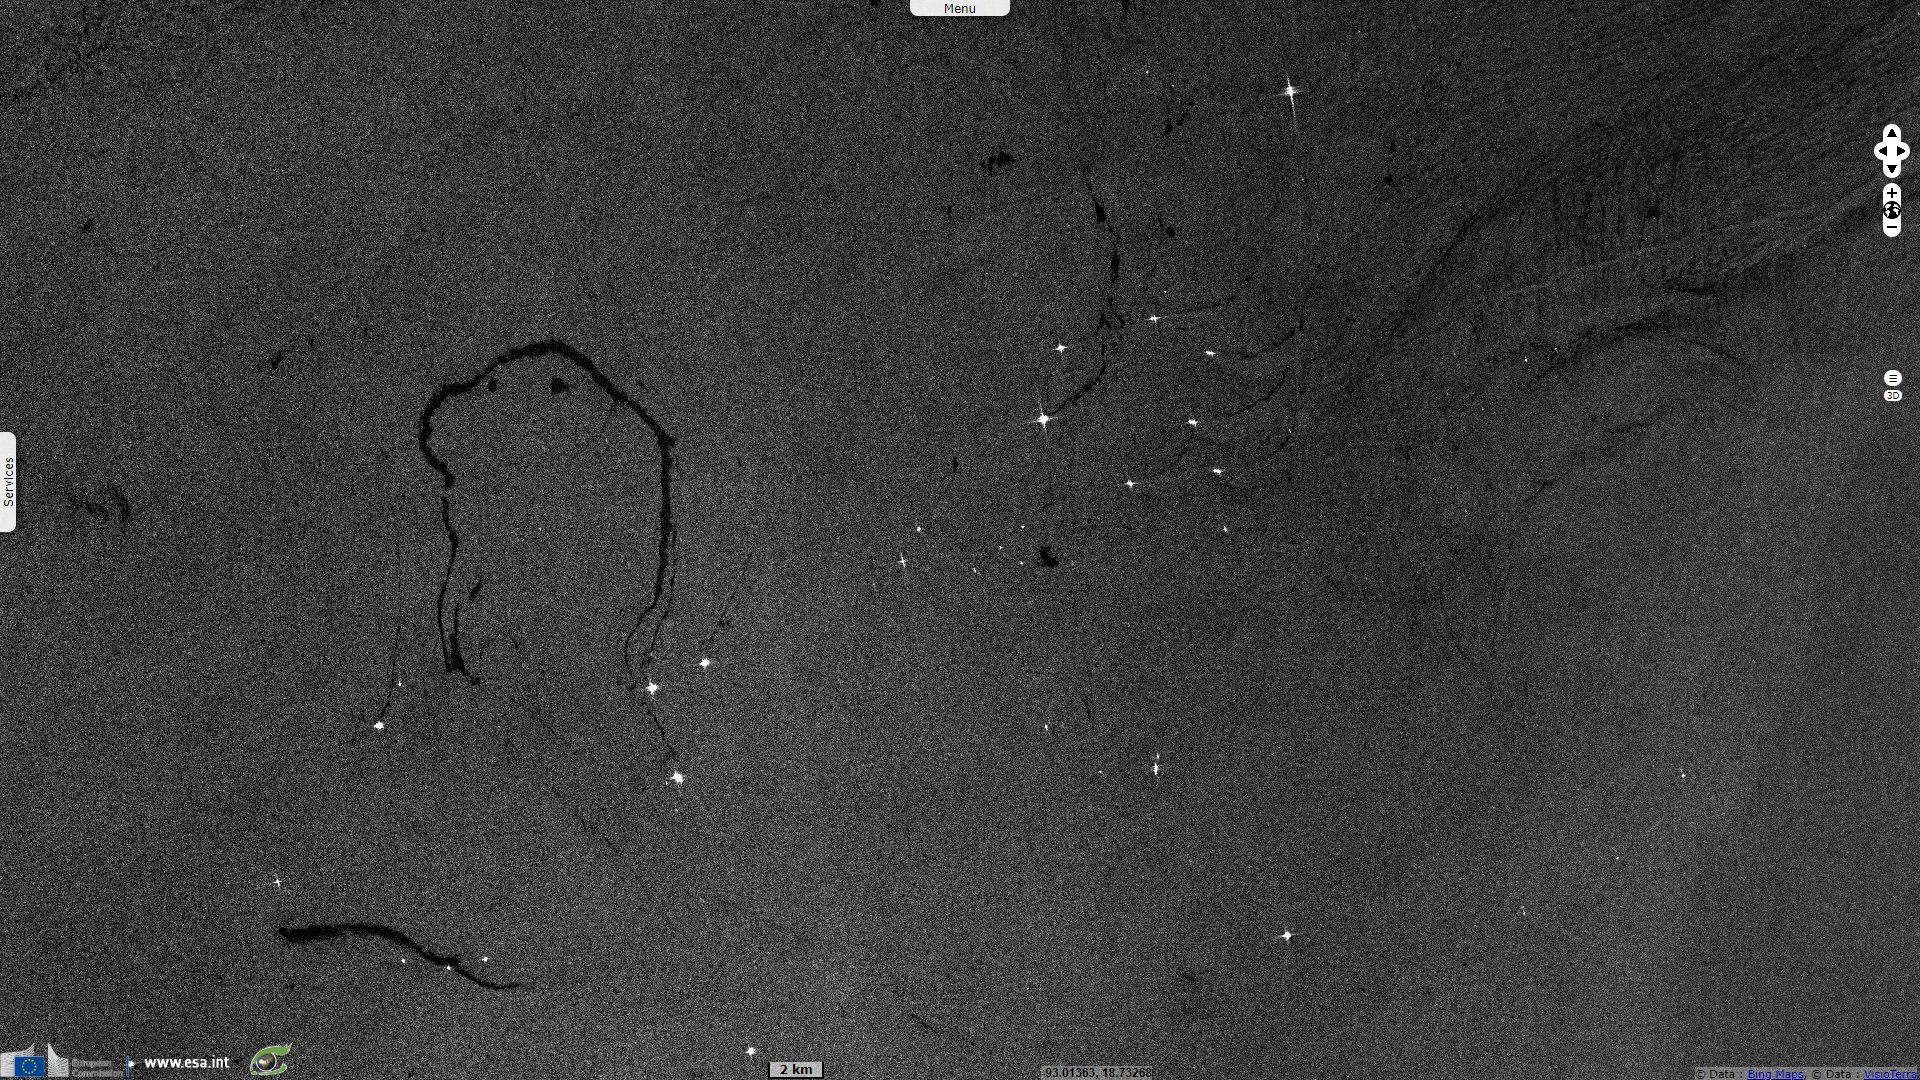
Sentinel-1 CSAR IW acquired on 20 April 2020 from 00:32:04 to 00:34:34 UTC
...
Sentinel-1 CSAR IW acquired on 20 April 2020 from 00:32:04 to 00:34:34 UTC
Keyword(s): Ocean monitoring, marine environment, coastal, pollution, oil spill, oil slick, infrastructure, non-renewable energy, greenhouse gas, climate change, global warming, offshore, oil and gas, oil rig, USA, United States, Macondo, Gulf of Mexico
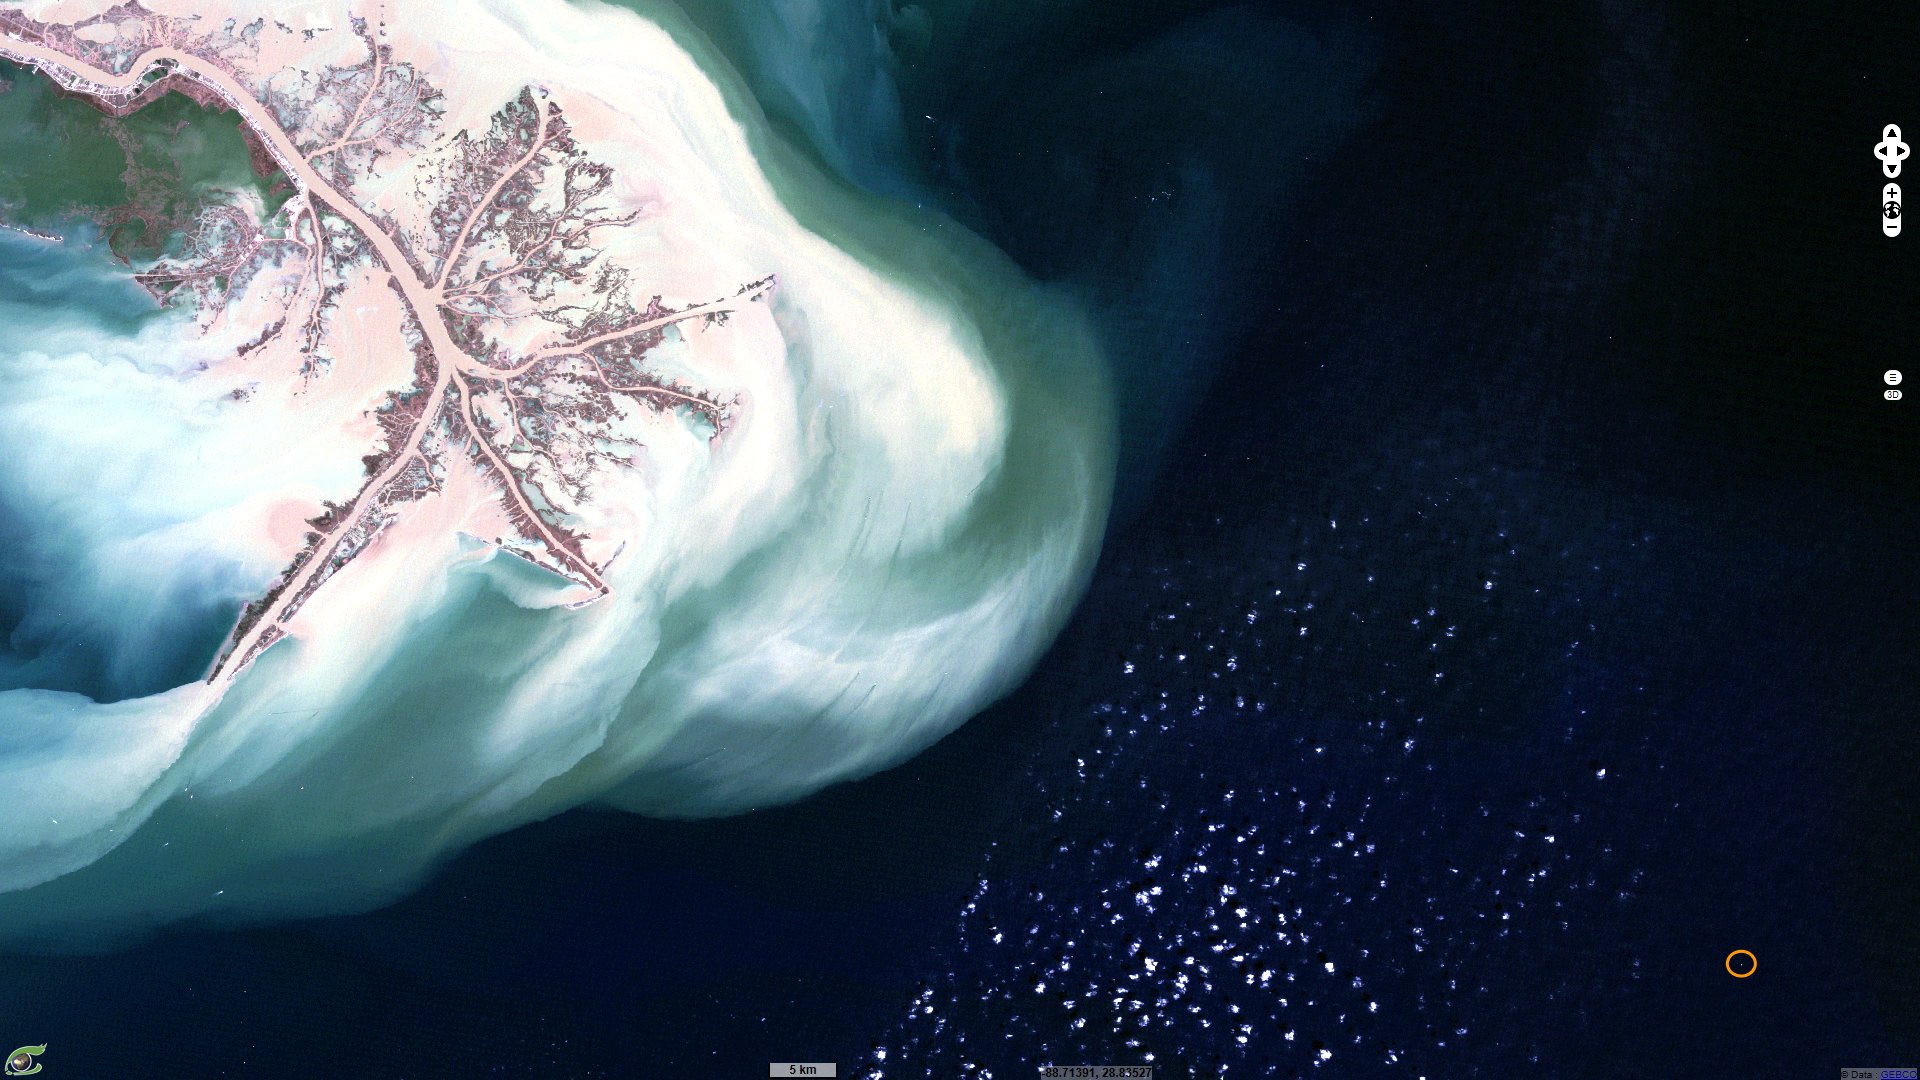
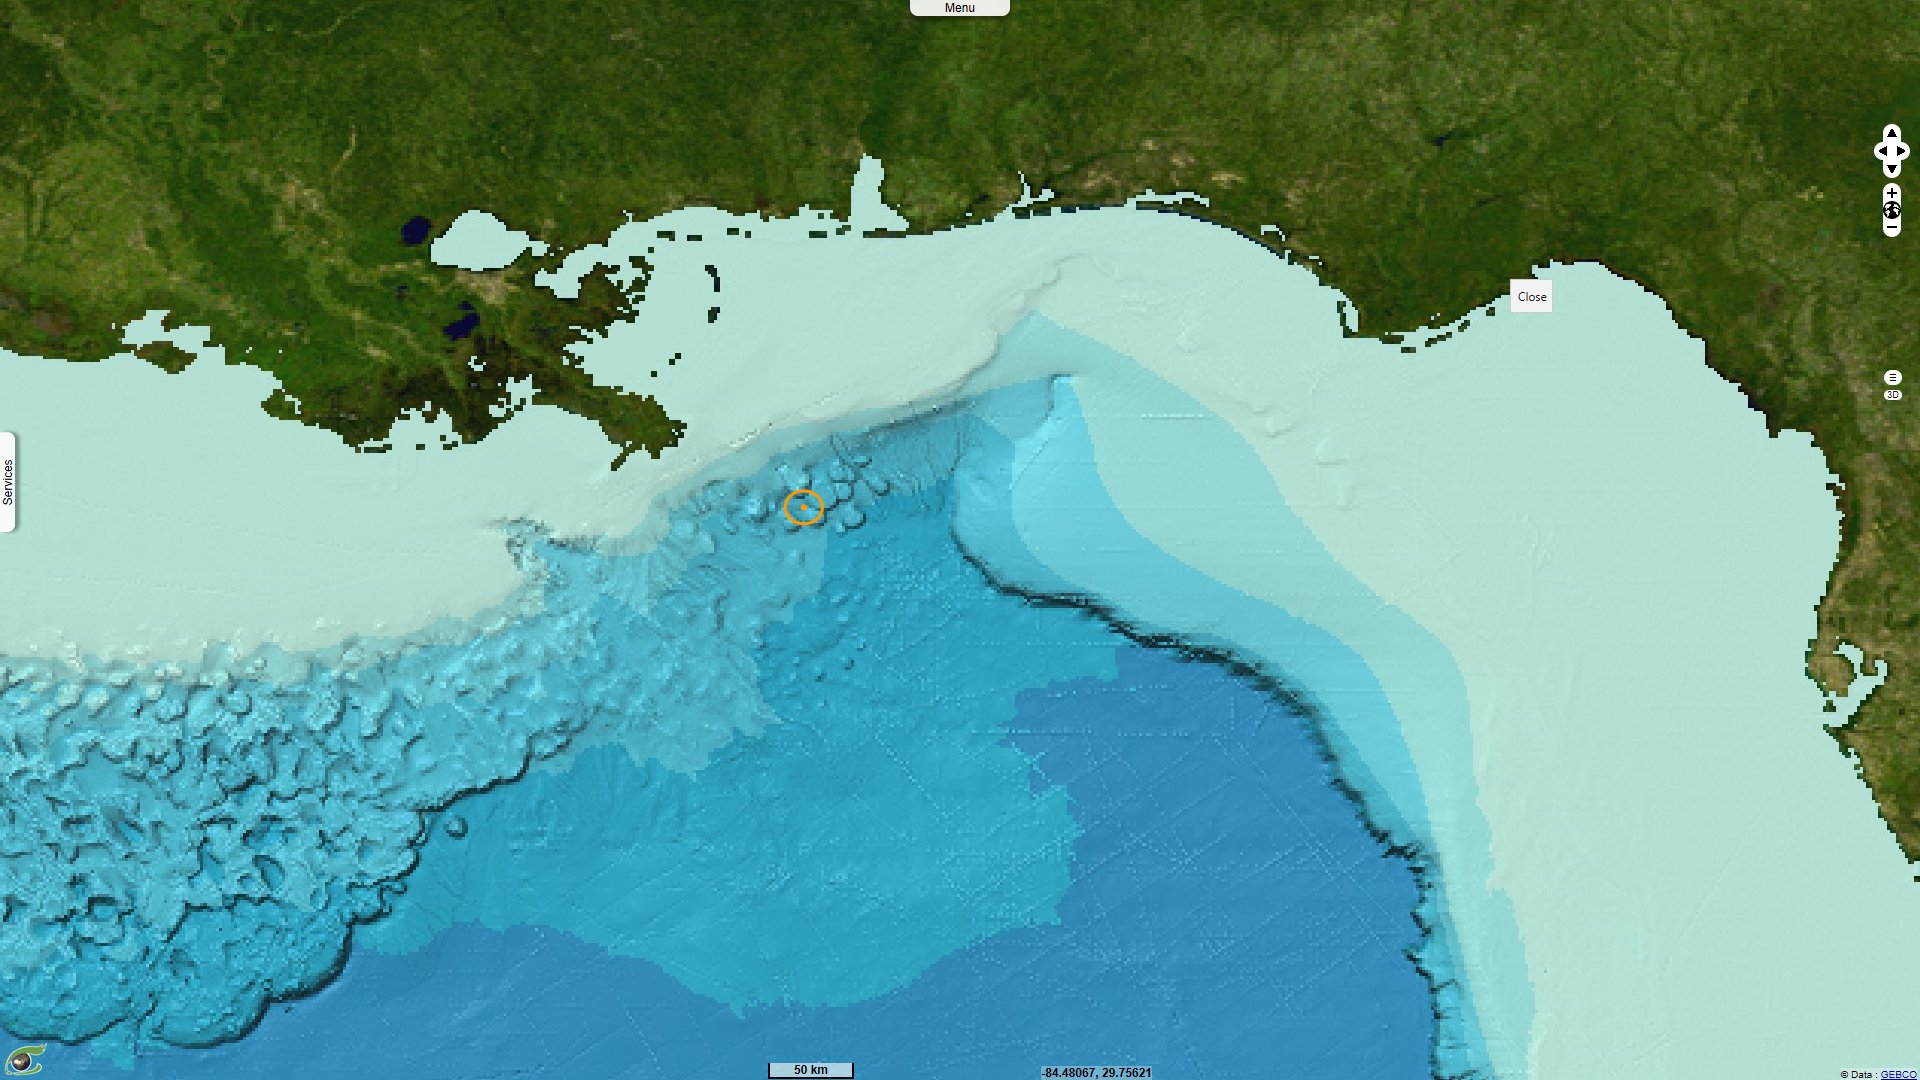
The semi-submersible offshore oil drilling rig was located 66 km south-east off the Louisiana coast, free floating 1585m over the Gulf floor. It had 126 crew members on board. According to Doctor Jean-Paul Xavier, specialist of remote sensing techniques applied to oil & gas activities: "The oil platform Deepwater Horizon was located on the slope between the shallow plateau (100m deep) of Mississippi-Alabama shelf to the north and the deep seabed (2000m deep) of Grand Gosier area, to the south. On this slope, the GEBCO bathymetry shows beautiful figures of gravity sliding, called 'Domes' in this sector (Gloria Dome in particular)."
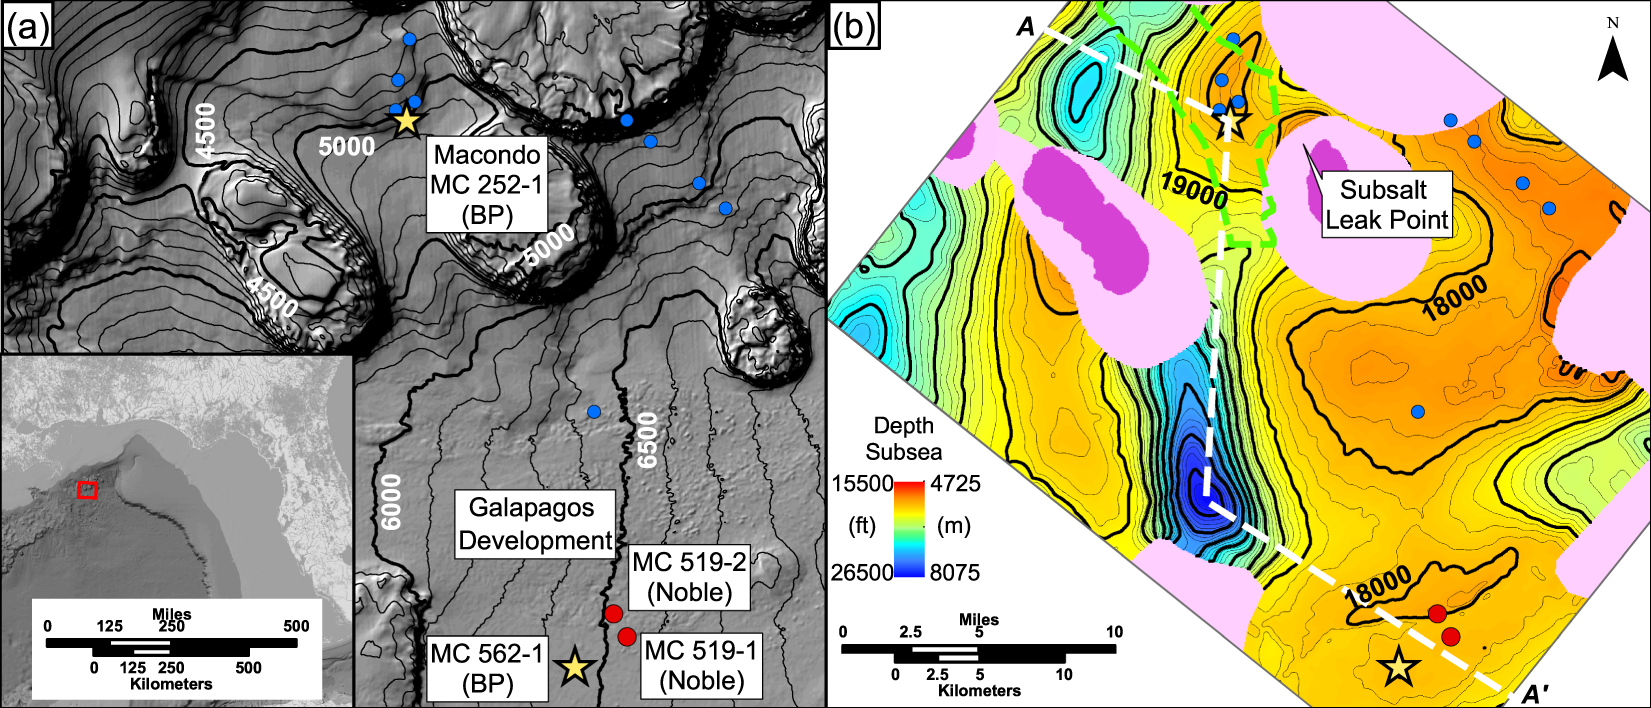
"The Macondo well, 252-1, is located 214km SE of New Orleans in 1522m of water. Figure (a) and (b) are collocated and at the same scale - Source: F. William M. Pinkston, Overpressure at the Macondo Well and its impact on the Deepwater Horizon blowout.
Left: "(Fig 1a) Bathymetry map of the study location. Contour interval = 30m. Symbols record bottom-hole locations of wells that penetrate the M56. The Macondo and 562-1 wells are analyzed in this study. The Noble wells (red dots) are used to constrain the aquifer pressure at 562-1. Blue dots locate wells that penetrated the M56 post-blowout."
Right: "(Fig 1b) The true vertical depth subsea of the M56 interpreted from 3-D seismic data. Contour interval = 76m. Location of the cross-section shown in Fig. 2 is annotated A-A′ with a white dashed line. The green dashed line denotes the M56 reservoir shape from BP’s exploration plan15, but is artificially truncated N-S. The structural map of the M56 reservoir is interpreted from a 3-D seismic volume that is zero-phase, narrow-azimuth, tilted transversely isotropic, and pre-stack reverse-time-migrated in depth. Dark pink indicates truncation of the M56 by salt stocks. The M56 steeply shallows against SE diapir forming a potential fluid leak point. The narrow-azimuth survey does not image bedding well beneath salt (light pink)."
Source: F. William M. Pinkston, Overpressure at the Macondo Well and its impact on the Deepwater Horizon blowout.
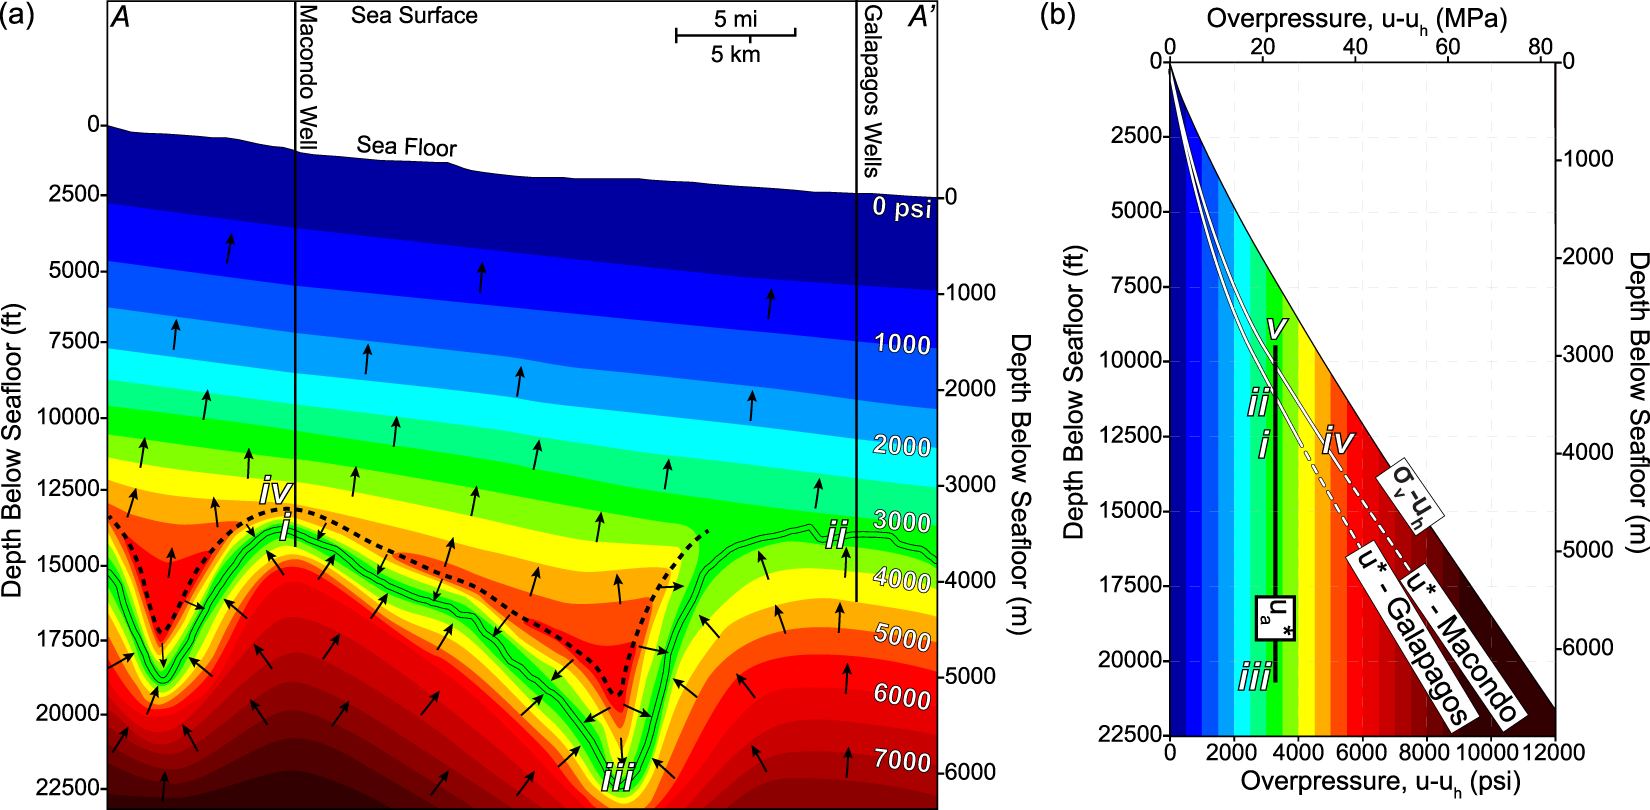
Left: "(Fig 2a) Interpreted overpressure cross section A-A′ (located in Fig. 1). Cooler colors indicate lower overpressure and warmer colors indicate higher overpressure. Arrows are normal to overpressure contours and record the flow direction of pore water within mudstone. The vertical overpressure gradient within the mudstone (contour spacing) decreases from A to A′ based on observations at the Macondo and Galapagos wells. The black dashed line approximates the flow divide: pore water flows upward above this line and downward below it. The vertical axis shows depth increasing relative to the seafloor."
Right: "(Fig 2b) Overpressure vs. depth below seafloor. White lines approximate mudstone pore pressures at each well location and become dashed below well control. The vertical black line records a constant overpressure of 23.4 MPa, approximately what is encountered at Macondo (i) and Galapagos (ii) in the M56 sand; its top (v) and base (iii) record the shallowest and deepest mapped location of the M56 sand, respectively. Key locations (i–v): (i) M56: Macondo (ii) M56: Galapagos (iii) M56: deepest mapped depth below seafloor (iv) Top of Macondo pore pressure regression (contour reversal) (v) Potential leak-off point subsalt (Fig. 1b) where aquifer overpressure converges with fracture pressure (not shown on cross section). Overpressure calculations use a hydrostatic gradient of [10.7 kPa/m], which is based on an aquifer pore-water density of 1.073 g/cm3."
"Planned cement location and likely cement location after pumping" - Source: NAE-NRC (2012) – Macondo Well Deepwater Horizon Blowout – Lessons for improving offshore drilling safety.
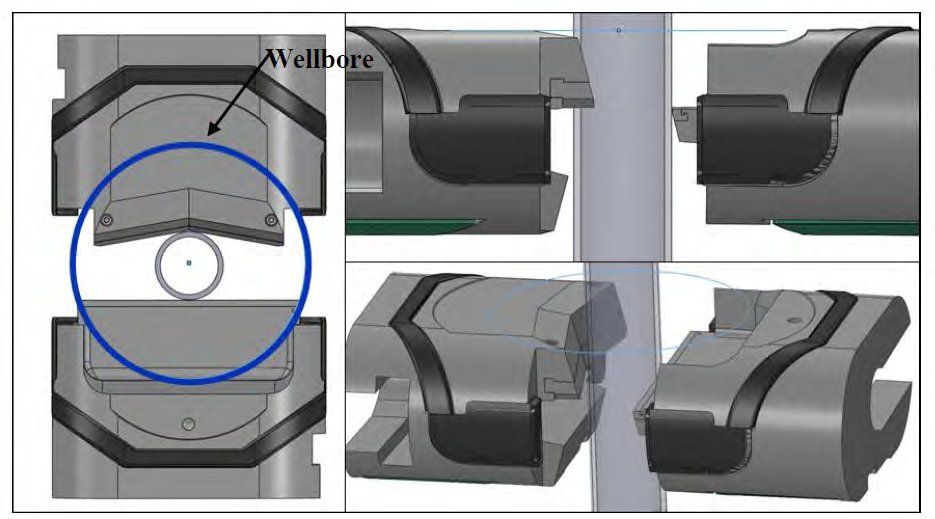
Left: Sketch of intended nominal operation of BSR in the Macondo well. Source: DNV 2011a, I, p. 155.
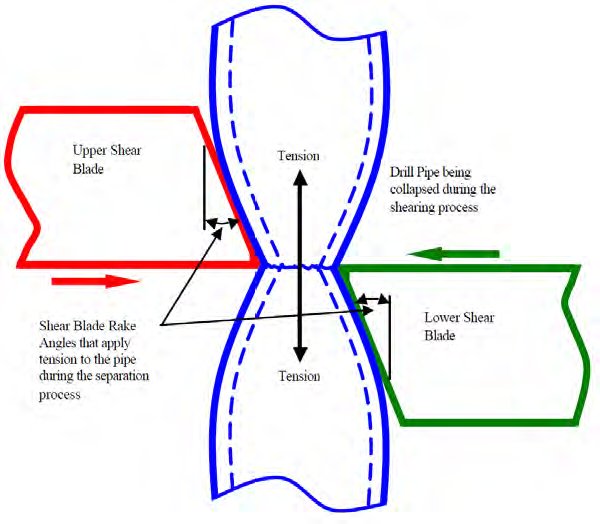
Right: Upper and lower shear blades crushing the drill pipe and beginning the shearing (or breaking) operation. Source: West Engineering Services.
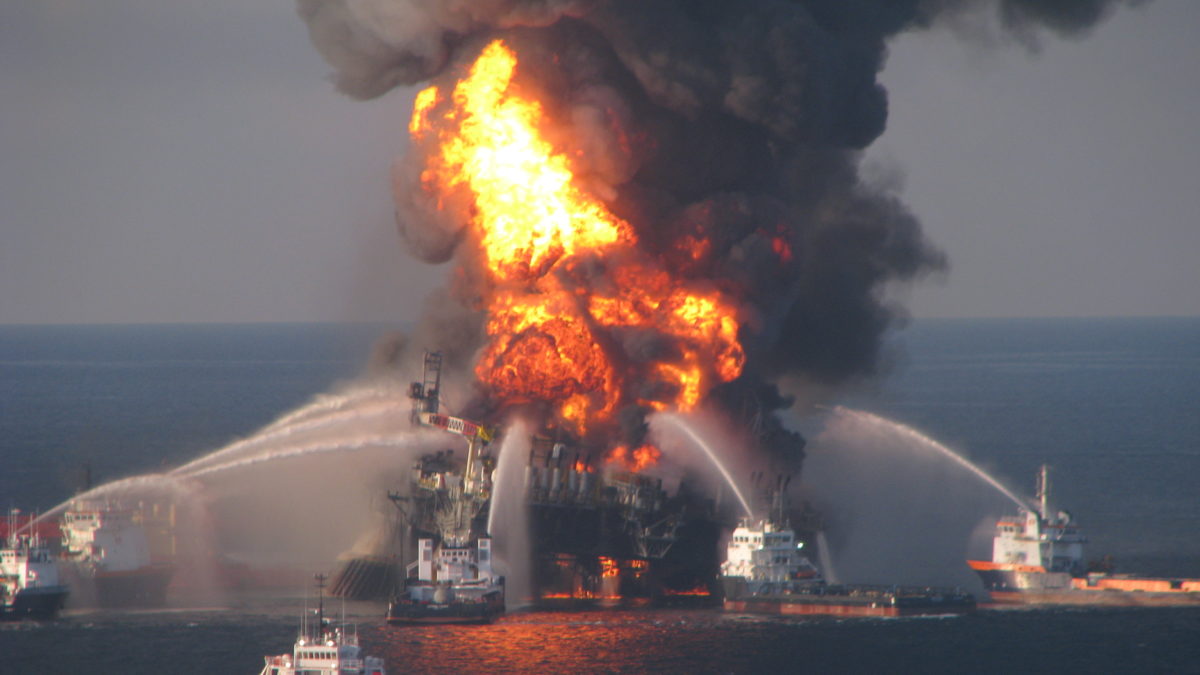
Deepwater Horizon drilling rig after the well blowout on 20.04.2010 but before it sunk on 22.04.2010 - Source: U.S. Coast Guard.
According to a news article released by the Jackson School of Geosciences of the University of Texas at Austin: "The well blowout killed 11 people and spewed oil for three months, spilling about 4 million barrels of oil into the Gulf of Mexico before crews successfully capped the well. Researchers and investigators since then have focused mostly on the engineering decisions and mistakes that led to the blowout and the ecological impacts of the oil spill that became one of the country's worst environmental catastrophes. But researchers from the UT Jackson School of Geosciences, aided by thousands of pages of documents made public during lawsuits and legal proceedings, have pieced together how the geologic conditions more than 2 miles under the Gulf floor made drilling difficult and drove engineering decisions that contributed to the well's failure and the ensuing blowout."
"The study, published May 7 in Scientific Reports, documents, among other things, a significant and steep drop in pore pressure inside the rock near the bottom of the well that influenced the decisions that contributed to the blowout."
"BP planned to temporarily abandon the oil well, the initial well in the Macondo prospect, until it could be produced at a later date, by plugging the base with steel and cement. However, the sharp drop in pore pressure, and an associated decline in stress, drastically narrowed the range of options to seal off the well. This led to the decision to use a controversial low-density foam cement that failed to set properly. This was a key cause of the Macondo well blowout." (see the NAE-NRC report).
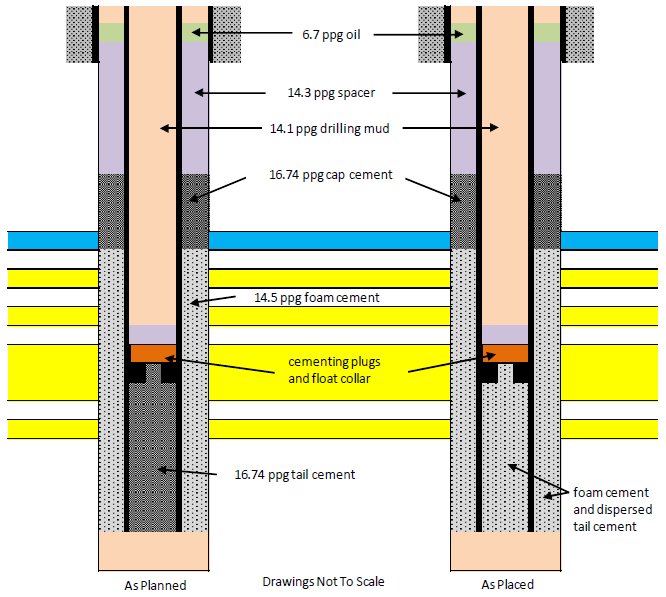
"Planned cement location and likely cement location after pumping" - Source: NAE-NRC (2012) – Macondo Well Deepwater Horizon Blowout – Lessons for improving offshore drilling safety.
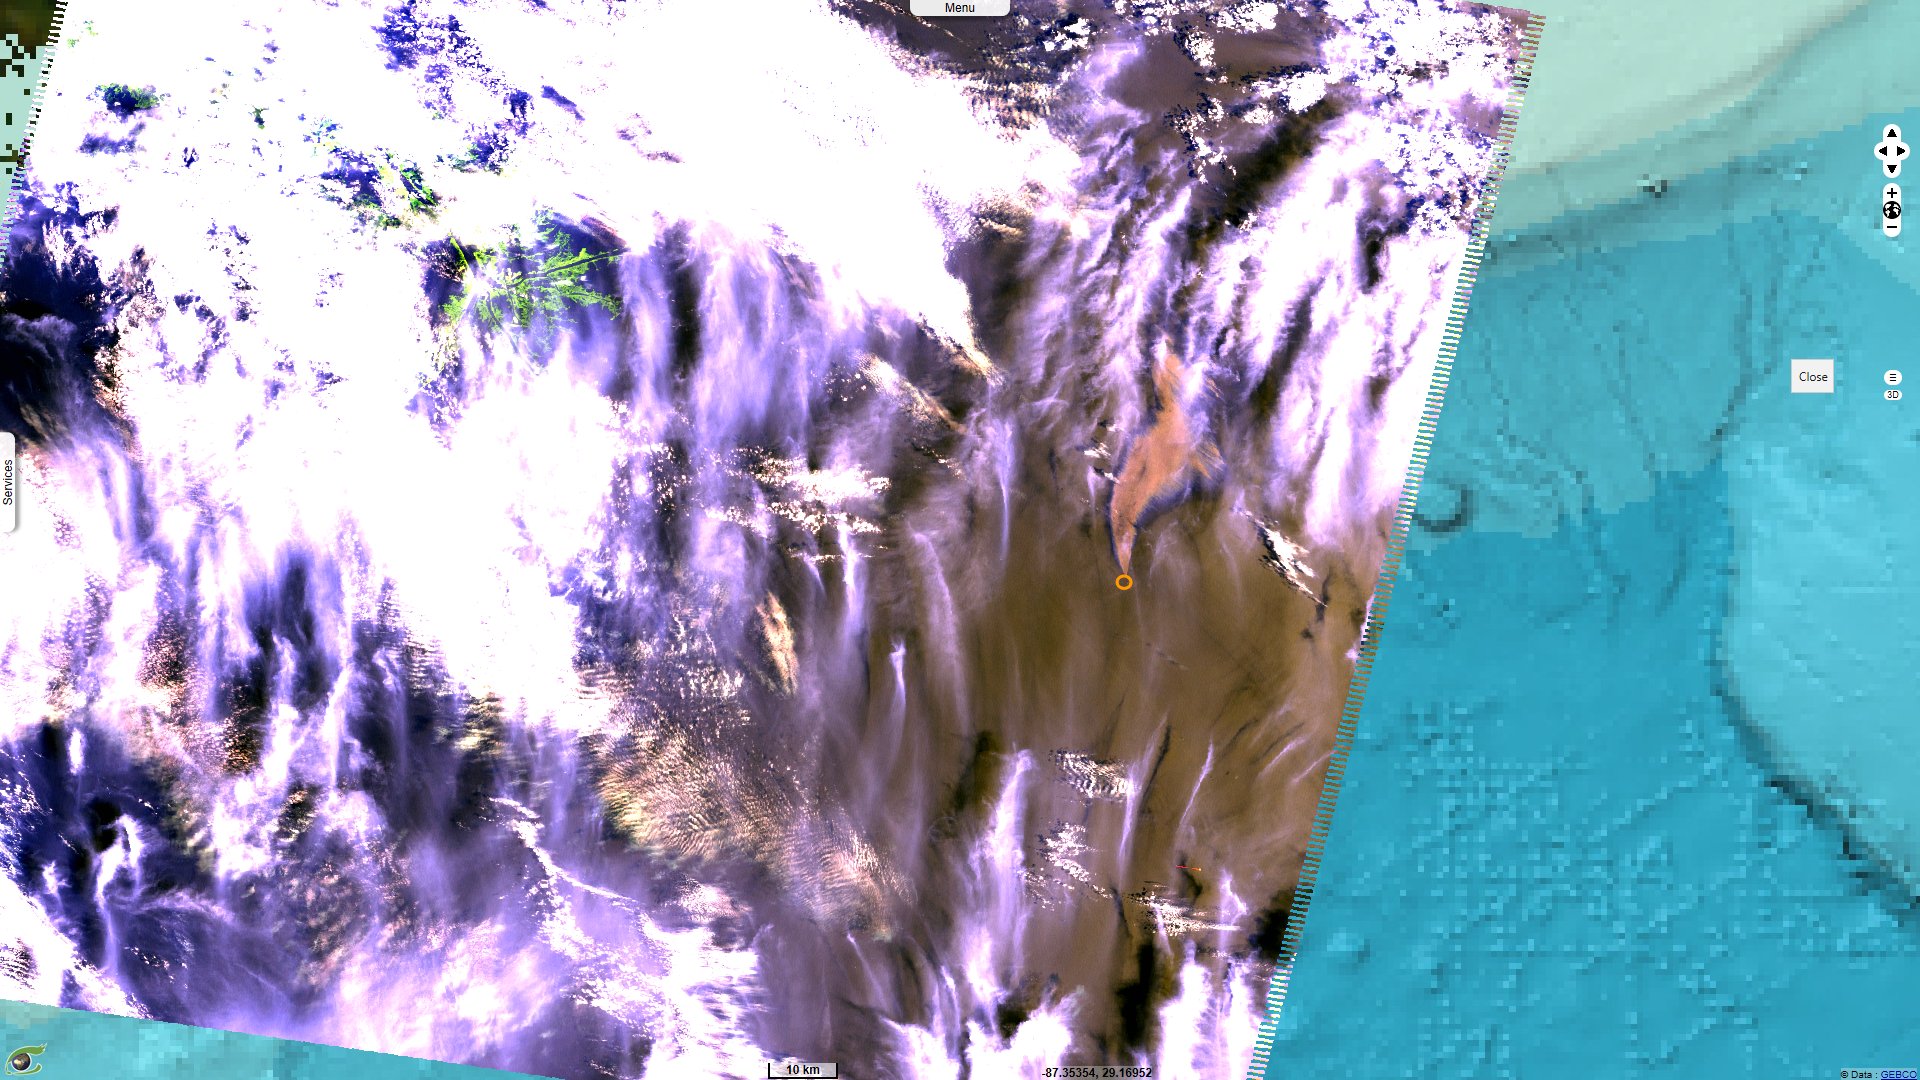
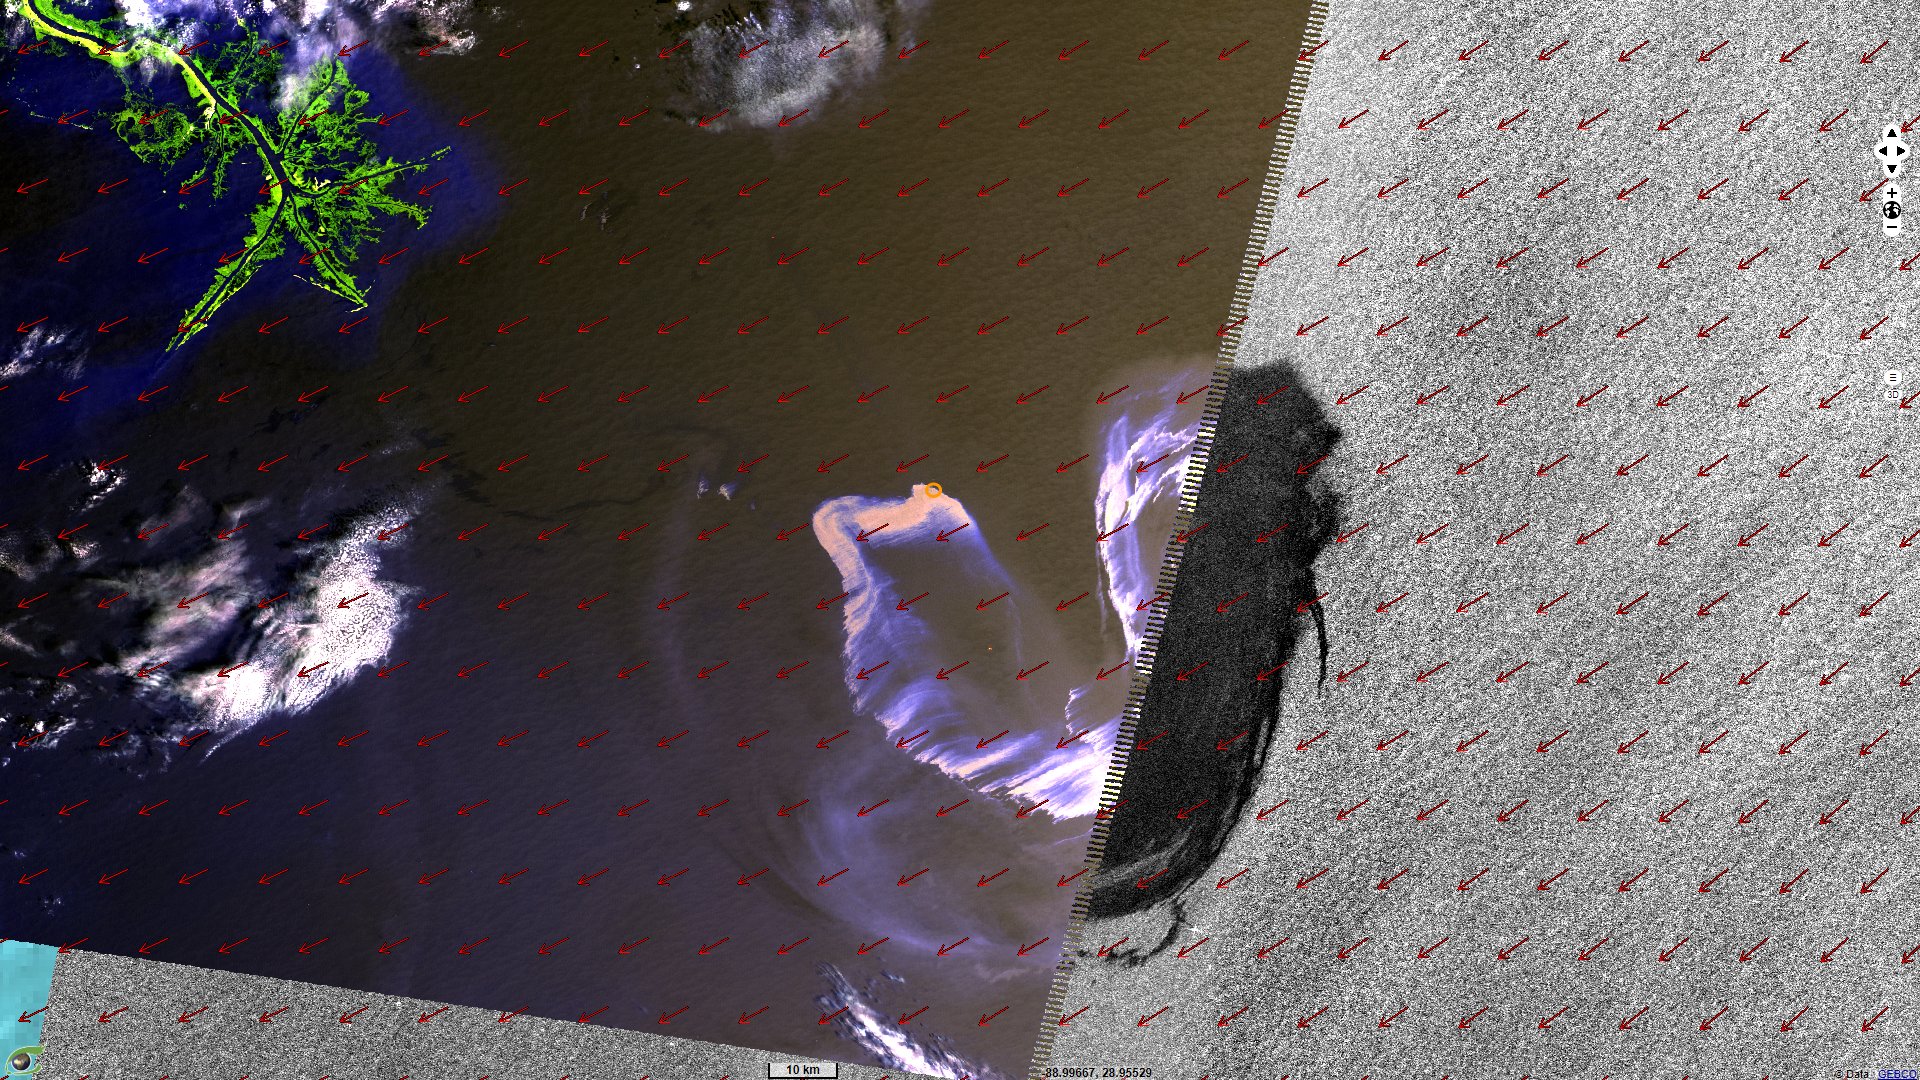
Envisat carried on board many instruments, in particular a radar instrument and an optical medium resolution sensor. As a radar sensor, Envisat ASAR is very sensitive to the damping of waves caused by the oil layer, allowing a good estimation of the surface covered by the slick. MERIS instrument allows seeing the oil colour when it is thick enough to differ from its marine environment. Sometimes thinner slicks may show with rainbow patterns or even as sheen, especially if sun glint is present. This allows a rough estimate of the thickness of different parts of the slick. It is also able to highlight the areas on fire. Here, fire has been lit to a part of the oil spill, wind pushed the front to the SE edge of the spill.
In her article Persistence and biodegradation of oil at the ocean floor following Deepwater Horizon published on Proceedings of the National Academy of Sciences (PNAS) on the 3rd January 2017, Sarah C. Bagby wrote: "On 20 April 2010, a blowout from the Macondo Well in the Gulf of Mexico caused an explosion on the Deepwater Horizon mobile offshore drilling unit that ultimately led to its sinking and the deaths of 11 crewmembers. From the time of the blowout until the well was capped on 15 July 2010, petroleum fluids flowed continuously from the Macondo Well, with environmental emission estimates of 4.1 million barrels of oil and 170 kT natural gas." "The Deepwater Horizon event led to an unprecedented discharge of 4.1 million barrels of oil to the Gulf of Mexico. The deposition of ~4–31% of this oil to the seafloor has been quantified previously on a bulk basis."
"The spill was noteworthy not only for its volume but also for its distance offshore and its depth: Oil and gas entered the ocean at a water depth of ~1500m and then partitioned between the deep ocean and the sea surface. This partitioning may have varied over time because of reservoir depressurization and deliberate interventions such as the shearing of the riser pipe and the application of chemical dispersant at the wellhead. In all, approximately half of the oil ascended to the ocean surface, where it was skimmed or flared by response teams, trapped in sinking particles by marine oil snow sedimentation and flocculent accumulation, washed ashore, or left exposed to the canonical weathering processes of evaporation, biodegradation, and photooxidation. The rest remained in the deep ocean."
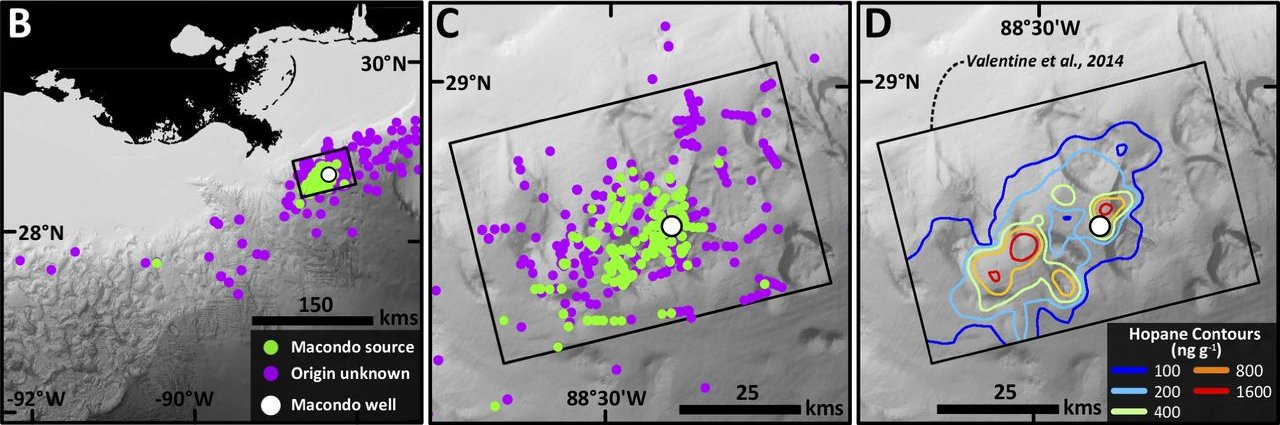 Top: Source: Persistence and biodegradation of oil at the ocean floor following Deepwater Horizon published on Proceedings of the National Academy of Sciences (PNAS) on the 3rd January 2017, Sarah C. Bagby
Left: "(B) Bathymetric chart of the region around the wellhead showing MDI results for each sample collected. Green symbols, MDI <1.8; purple symbols, MDI ≥1.8."
Centre: "(C) Zoomed view of B showing detail in the immediate vicinity of the wellhead.".
Right: "(D) Footprint of seafloor oil deposition in the immediate vicinity of the wellhead as detected by hopane-concentration anomalies in previous work.".
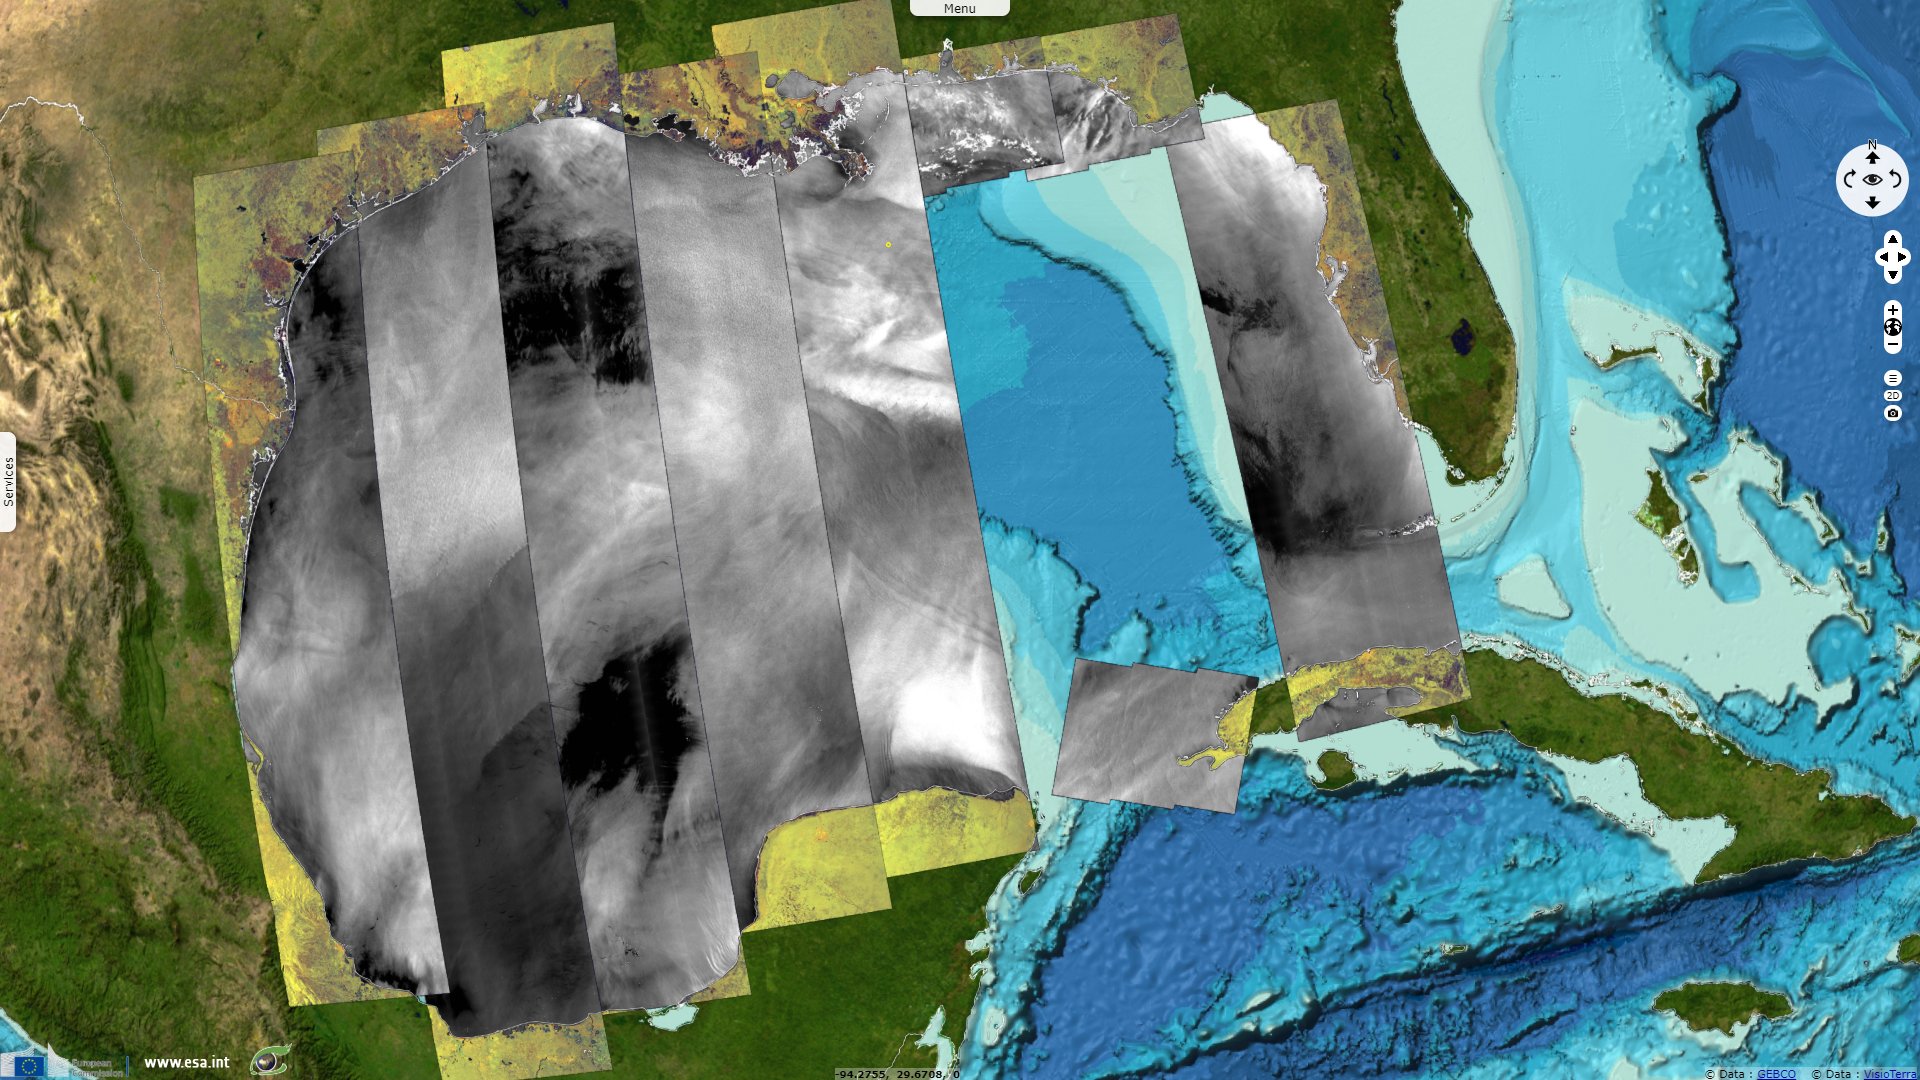
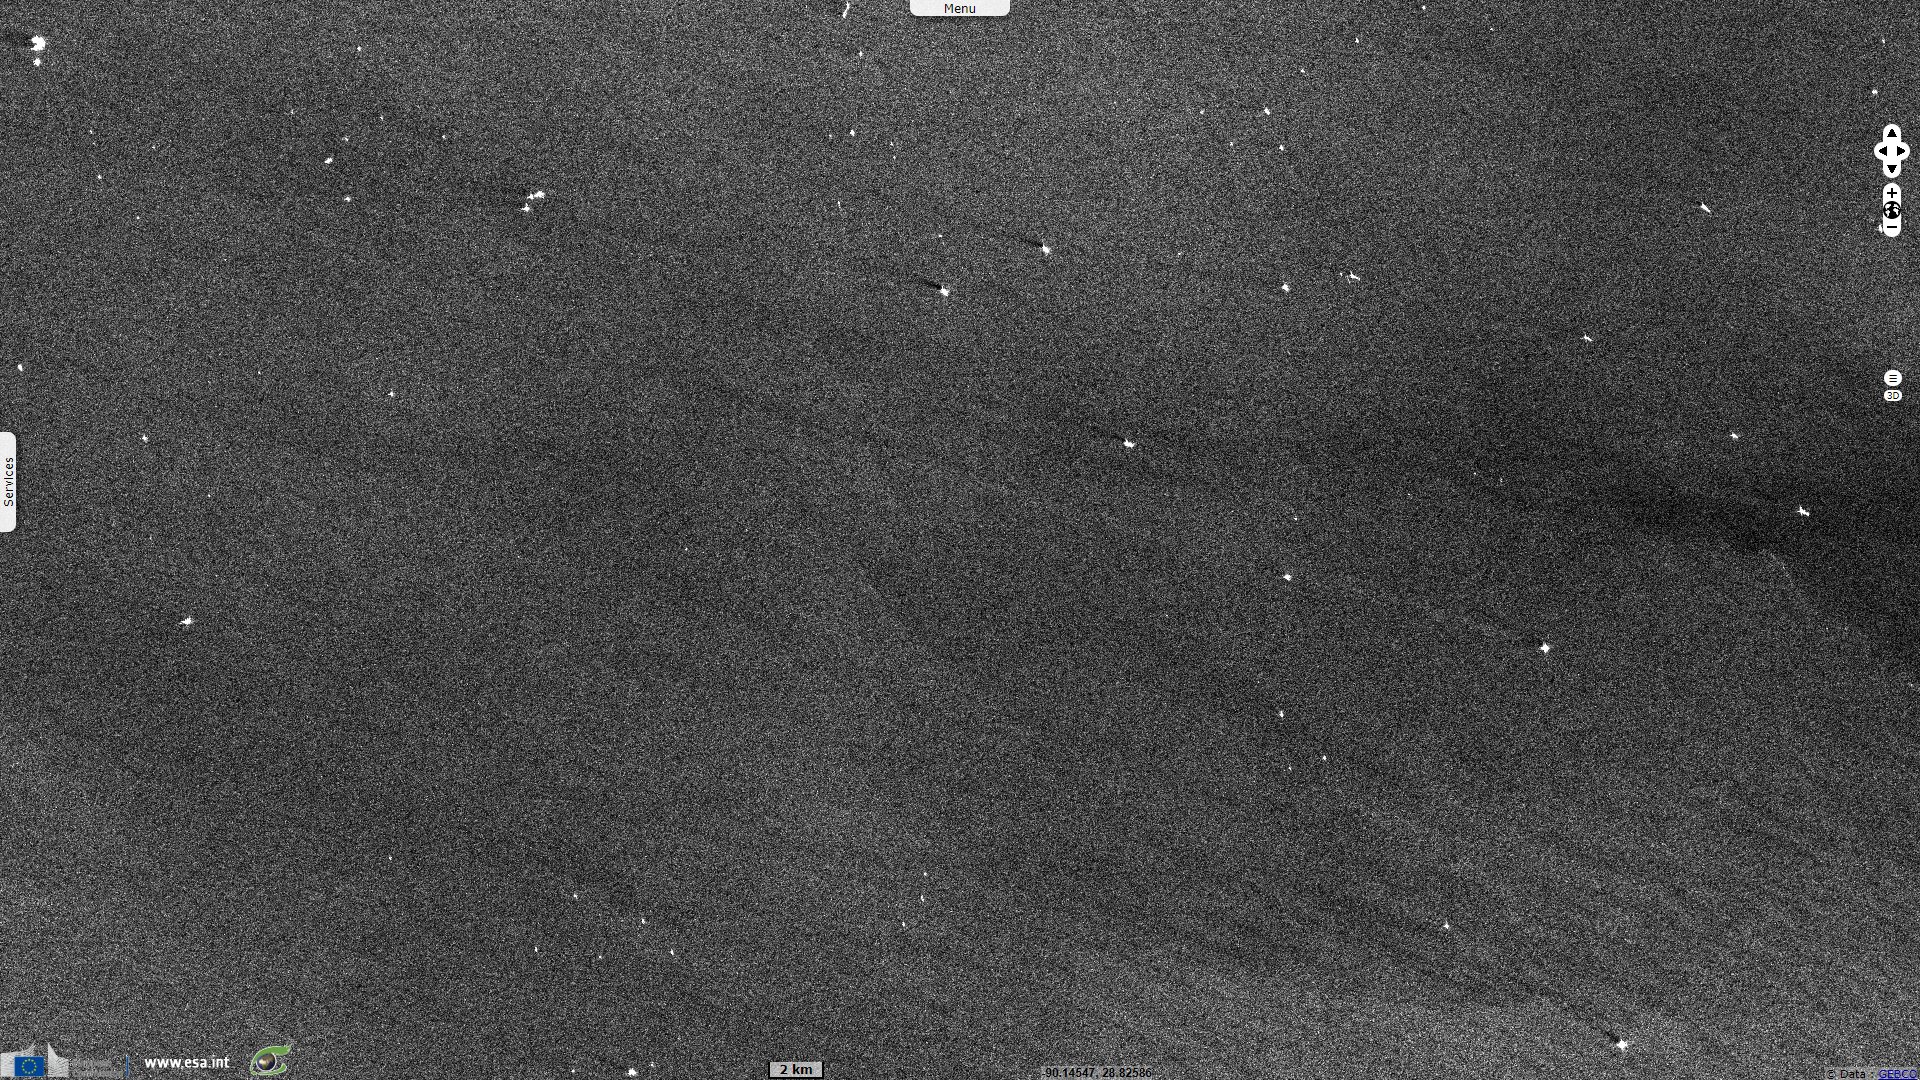
Nowadays, Sentinel-1A and 1B CSAR instrument monitor the Gulf more frequently than their predecessor Envisat SAR could 10 years ago. It allows a near-complete covering of the Gulf of Mexico every 12 days, and with a much improved ground sampling distance of 10m.
As a whole, the Gulf of Mexico is now cleaner than it was ten years ago, in particular on the American side. As shown above, things can still improve if authorities decide so. There are however other parts of the World where laws are more permissive or harder to enforce or simply do not benefit from an intense monitoring, where large multiple oil spills happen everyday as it has been shown previously on the West African Coast:
SED-018
SED-134
EVT-519
SED-577
The views expressed herein can in no way be taken to reflect the official opinion of the European Space Agency or the European Union.
Contains modified Copernicus Sentinel data 2026, processed by VisioTerra.
Contains modified Copernicus Sentinel data 2026, processed by VisioTerra.
| More on European Commission space: |  |
 |
 |
||||
| More on ESA: | |
|
|
S-1 website | S-2 website | S-3 website | |
| More on Copernicus program: | |
|
|
Scihub portal | Cophub portal | Inthub portal | Colhub portal |
| More on VisioTerra: | |
|
|
Sentinel Vision Portal | Envisat+ERS portal | Swarm+GOCE portal | CryoSat portal |