Oil spills in Abo offshore oil field, Nigeria
Sentinel-1 CSAR IW acquired on 09 September 2018 at 05:29:52 UTC
...
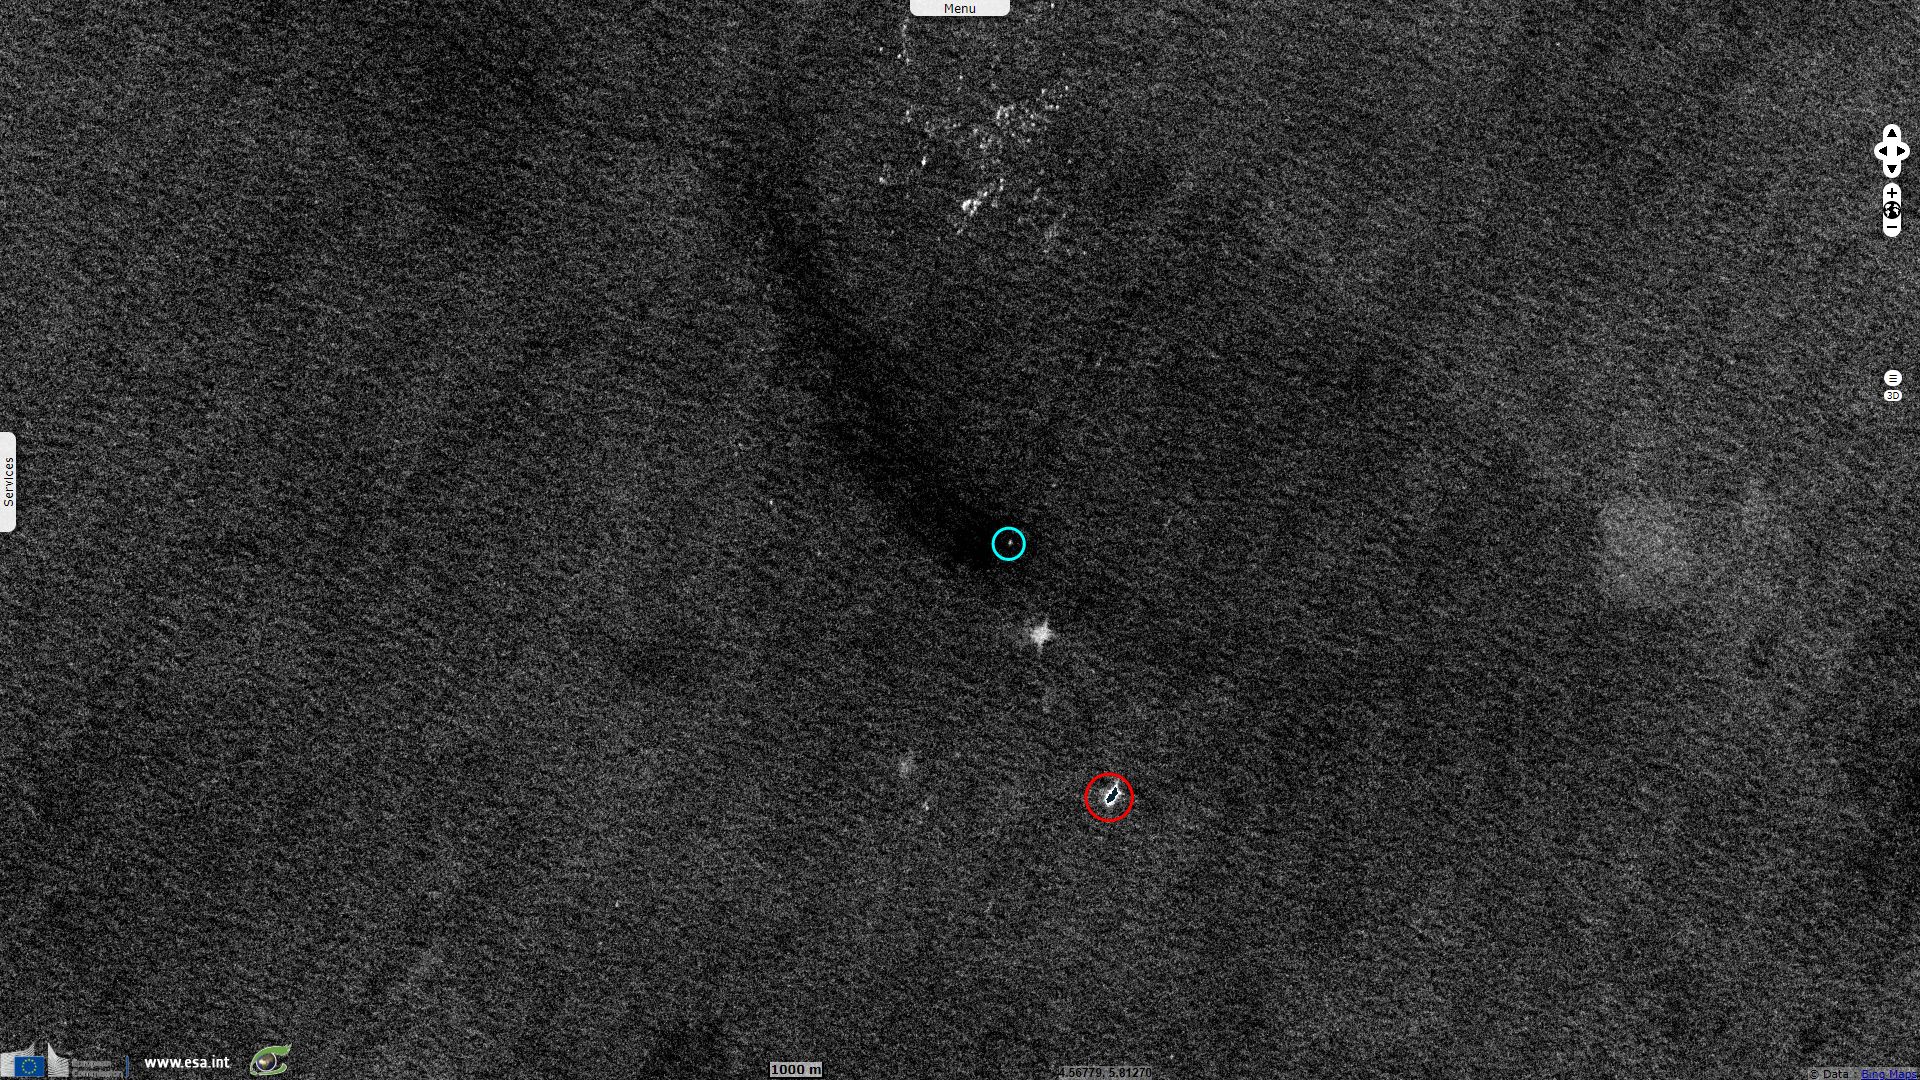
Sentinel-1 CSAR IW acquired on 31 January 2019 at 05:29:50 UTC
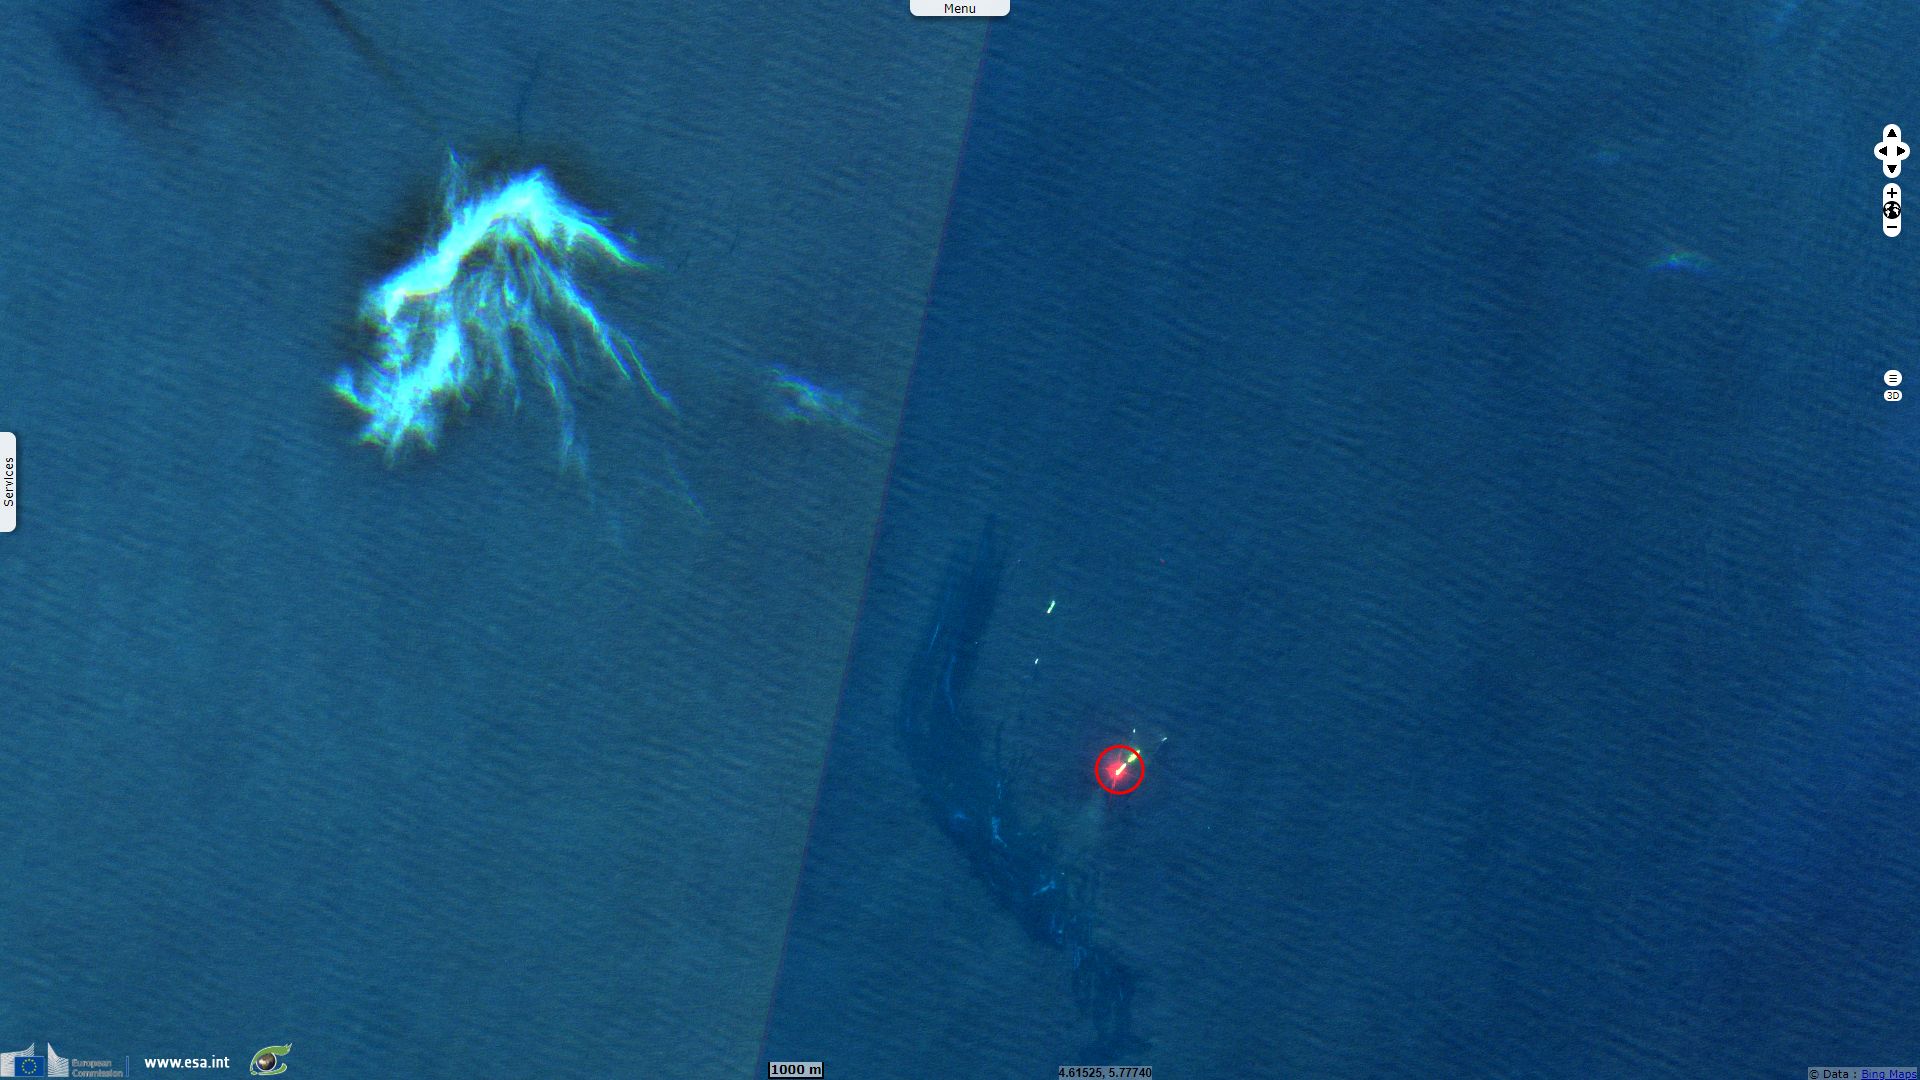
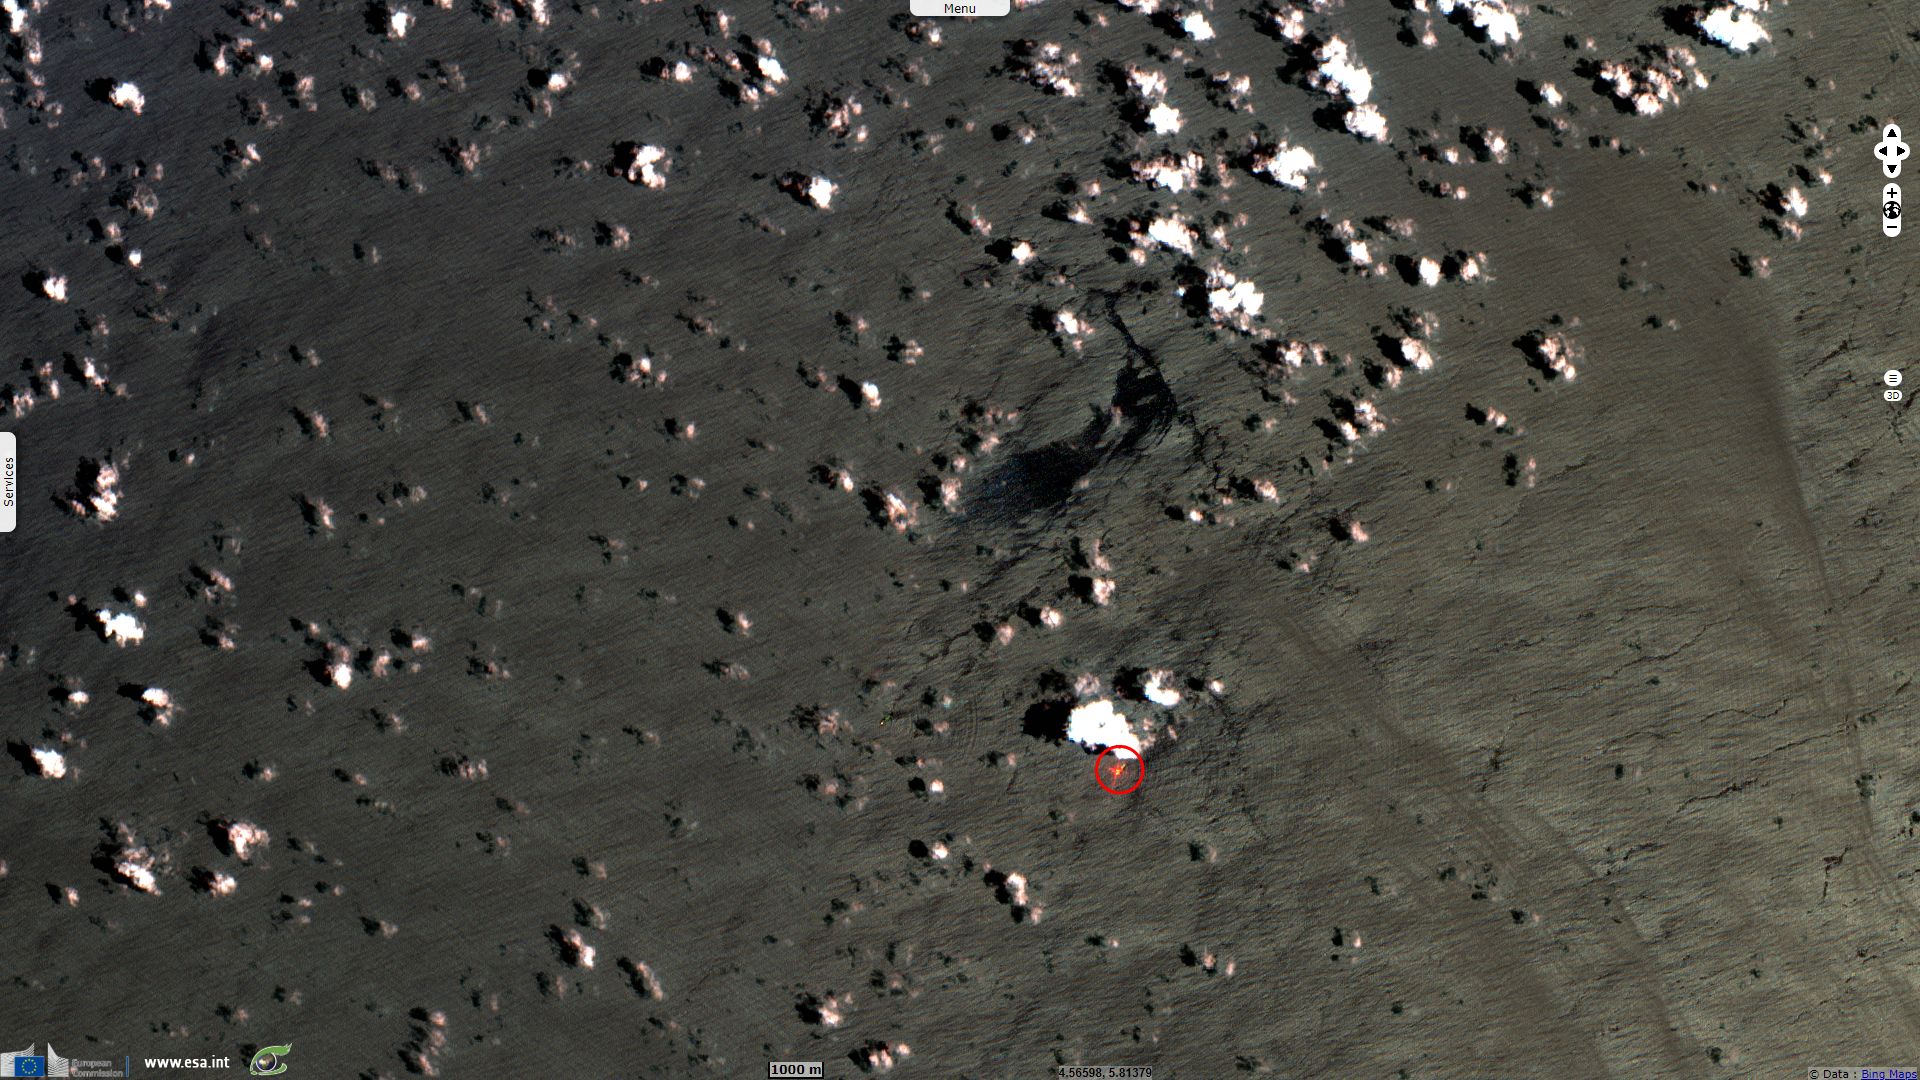
Sentinel-2 MSI acquired on 31 January 2019 at 10:02:41 UTC
Sentinel-2 MSI acquired on 27 March 2019 at 10:00:29 UTC
...
Sentinel-1 CSAR IW acquired on 31 January 2019 at 05:29:50 UTC
Sentinel-2 MSI acquired on 31 January 2019 at 10:02:41 UTC
Sentinel-2 MSI acquired on 27 March 2019 at 10:00:29 UTC
Keyword(s): Water monitoring, pollution, atmosphere, oil spill, oil slick, infrastructure, energy, Gulf of Guinea, Nigeria
Oil and Gas exploration is the search by petroleum geologists and geophysicists for deposits of hydrocarbons, particularly petroleum and natural gas, in the Earth using petroleum geology.
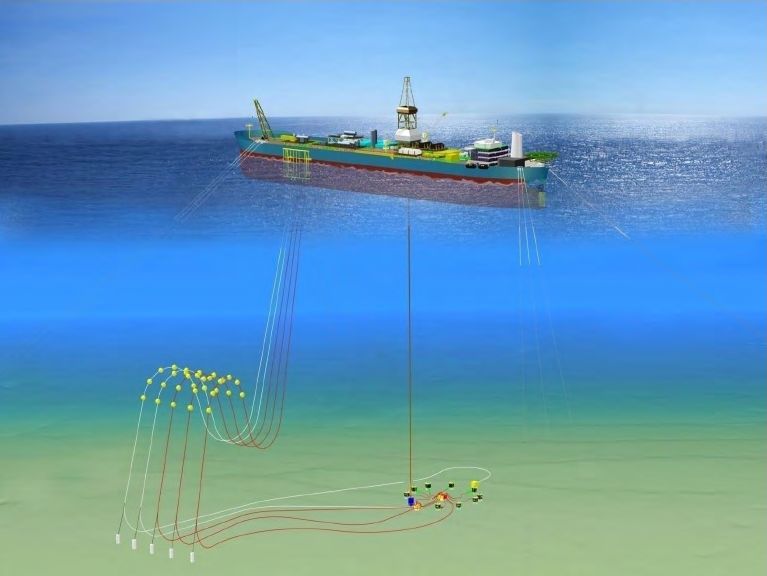
Floating Production Storage and Offloading (FPSO) is a floating vessel used by the offshore oil and gas industry to produce and process hydrocarbons, and to storage of oil. Generally a FPSO is designed to receive hydrocarbons produced by itself or from nearby platforms or subsea template, process them, and store oil until it can be offloaded onto a tanker or, less frequently, transported through a pipeline.
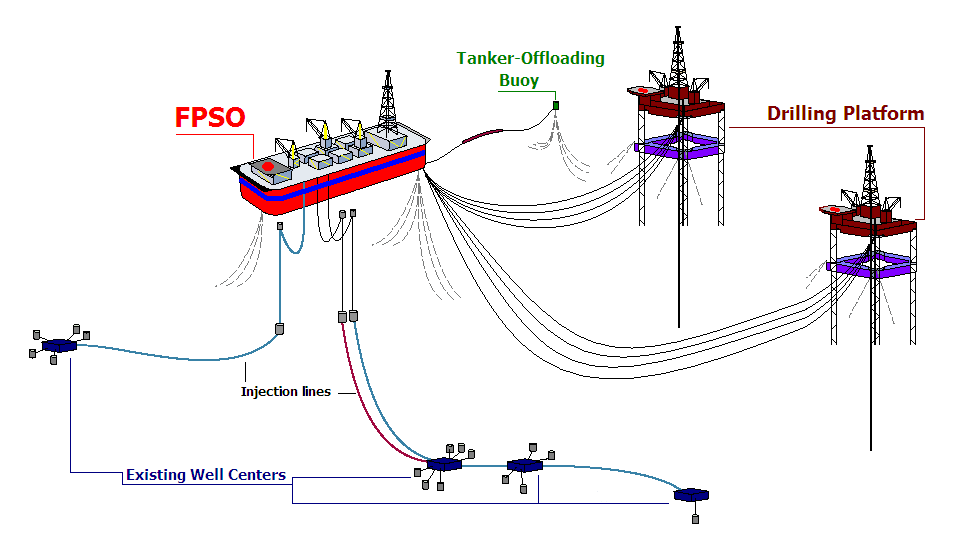
General concept of FPSO system - Source: Gunnernett
Abo FPSO Platform has been operating since 2003. It is located in OML 125, North-Western sector of the Nigerian Deepwater. ENI through its subsidiary Nigerian Agip Exploration (NAE) is the main operator of Abo platform with 50.19%; followed by Shell Nigerian Exploration and Production Company (SNEPCo) with 49.81%. To remind, the last extension of the deal for the Abo FPSO was signed in December 2018. It was set to expire on June 30, 2019, with options to extend until the fourth quarter of 2020.
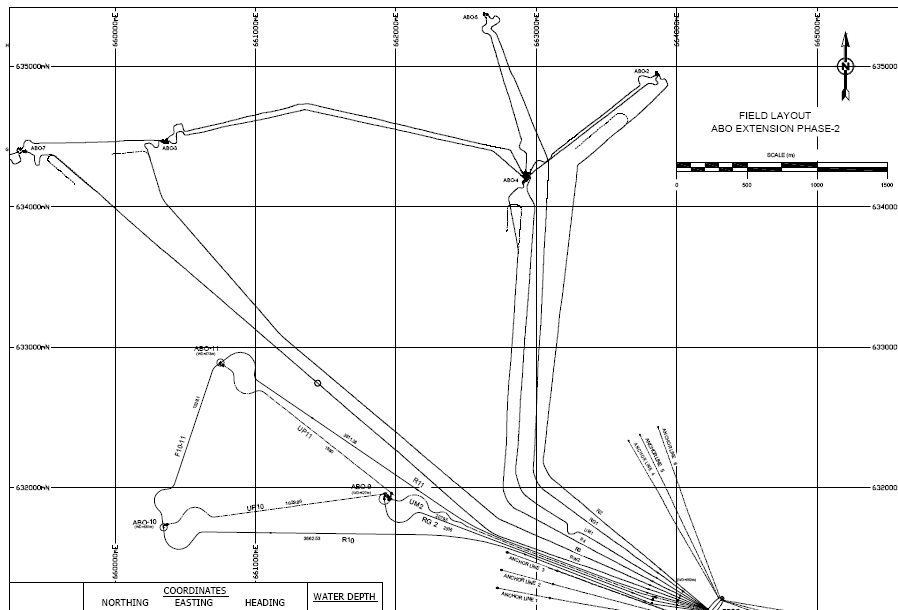
Abo FPSO underwater network map, field layout Abo extension phase 2 - Source: ENI Company
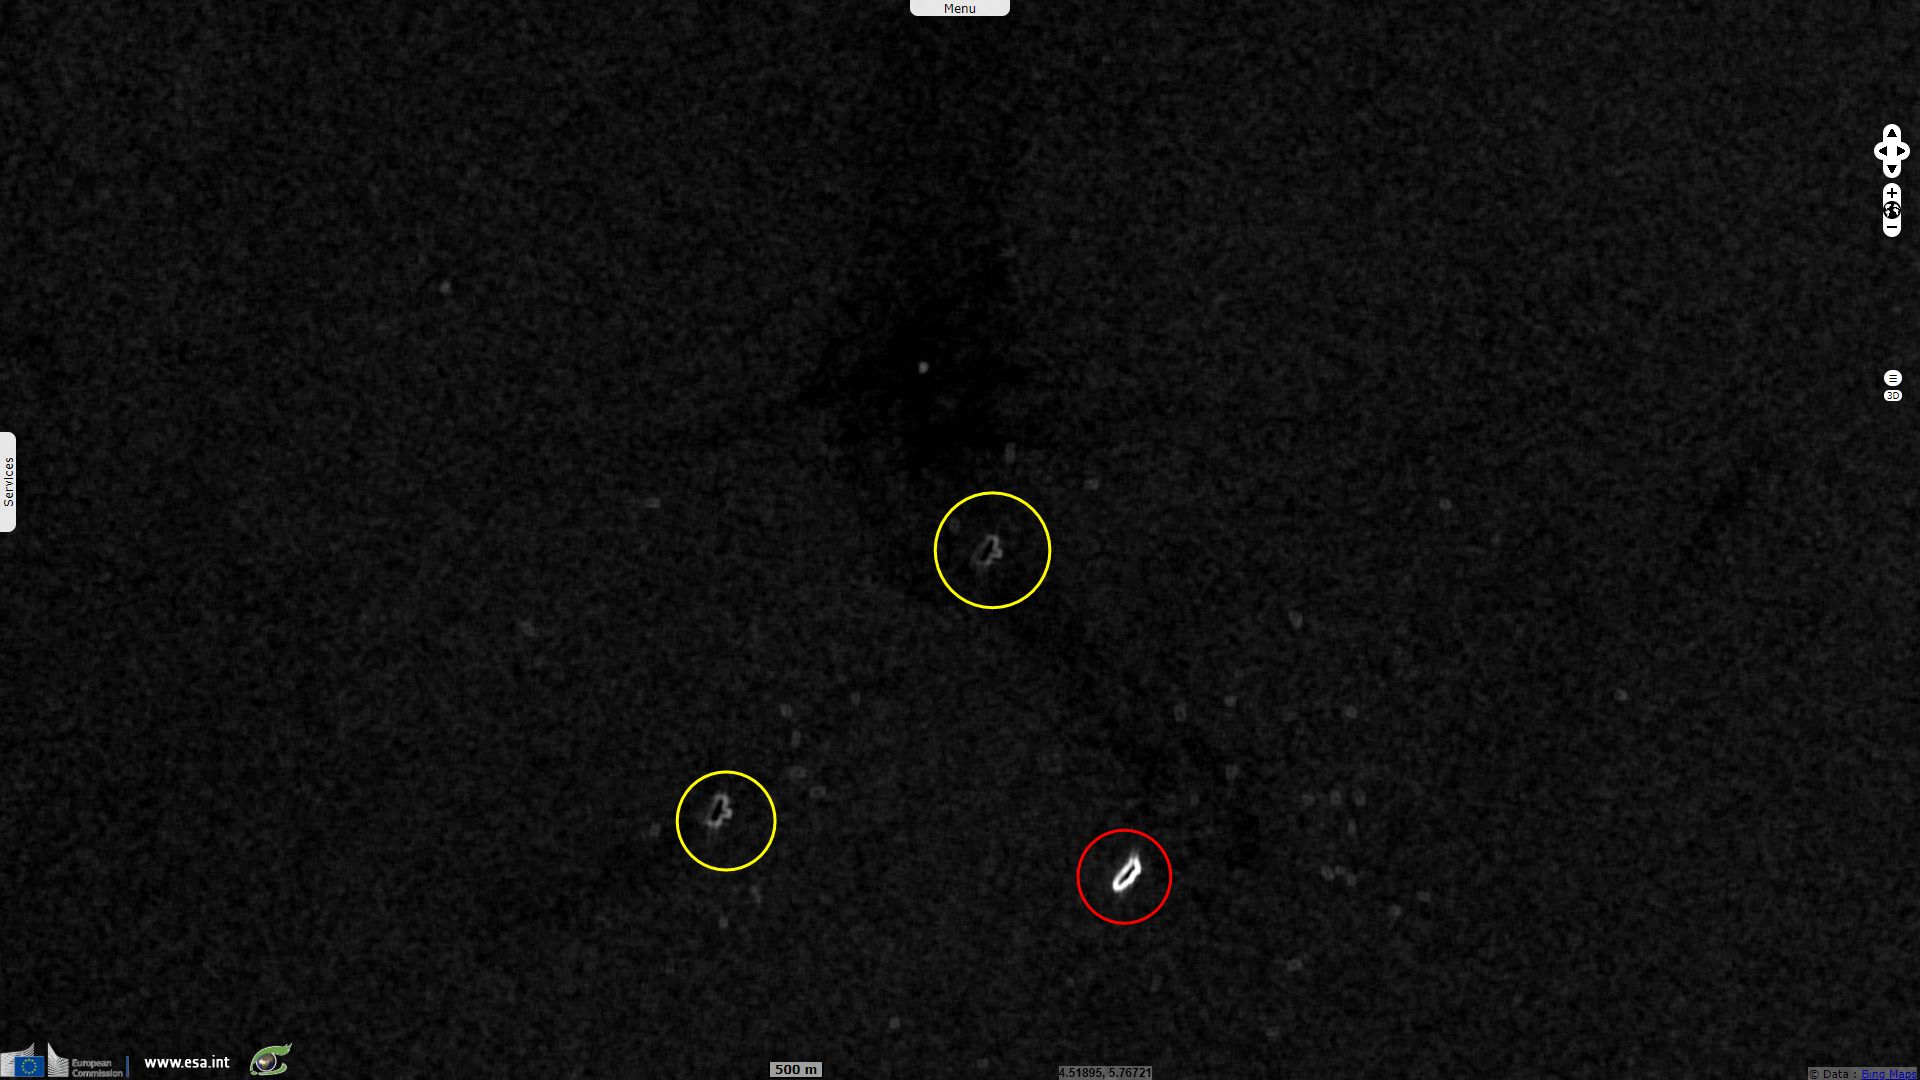
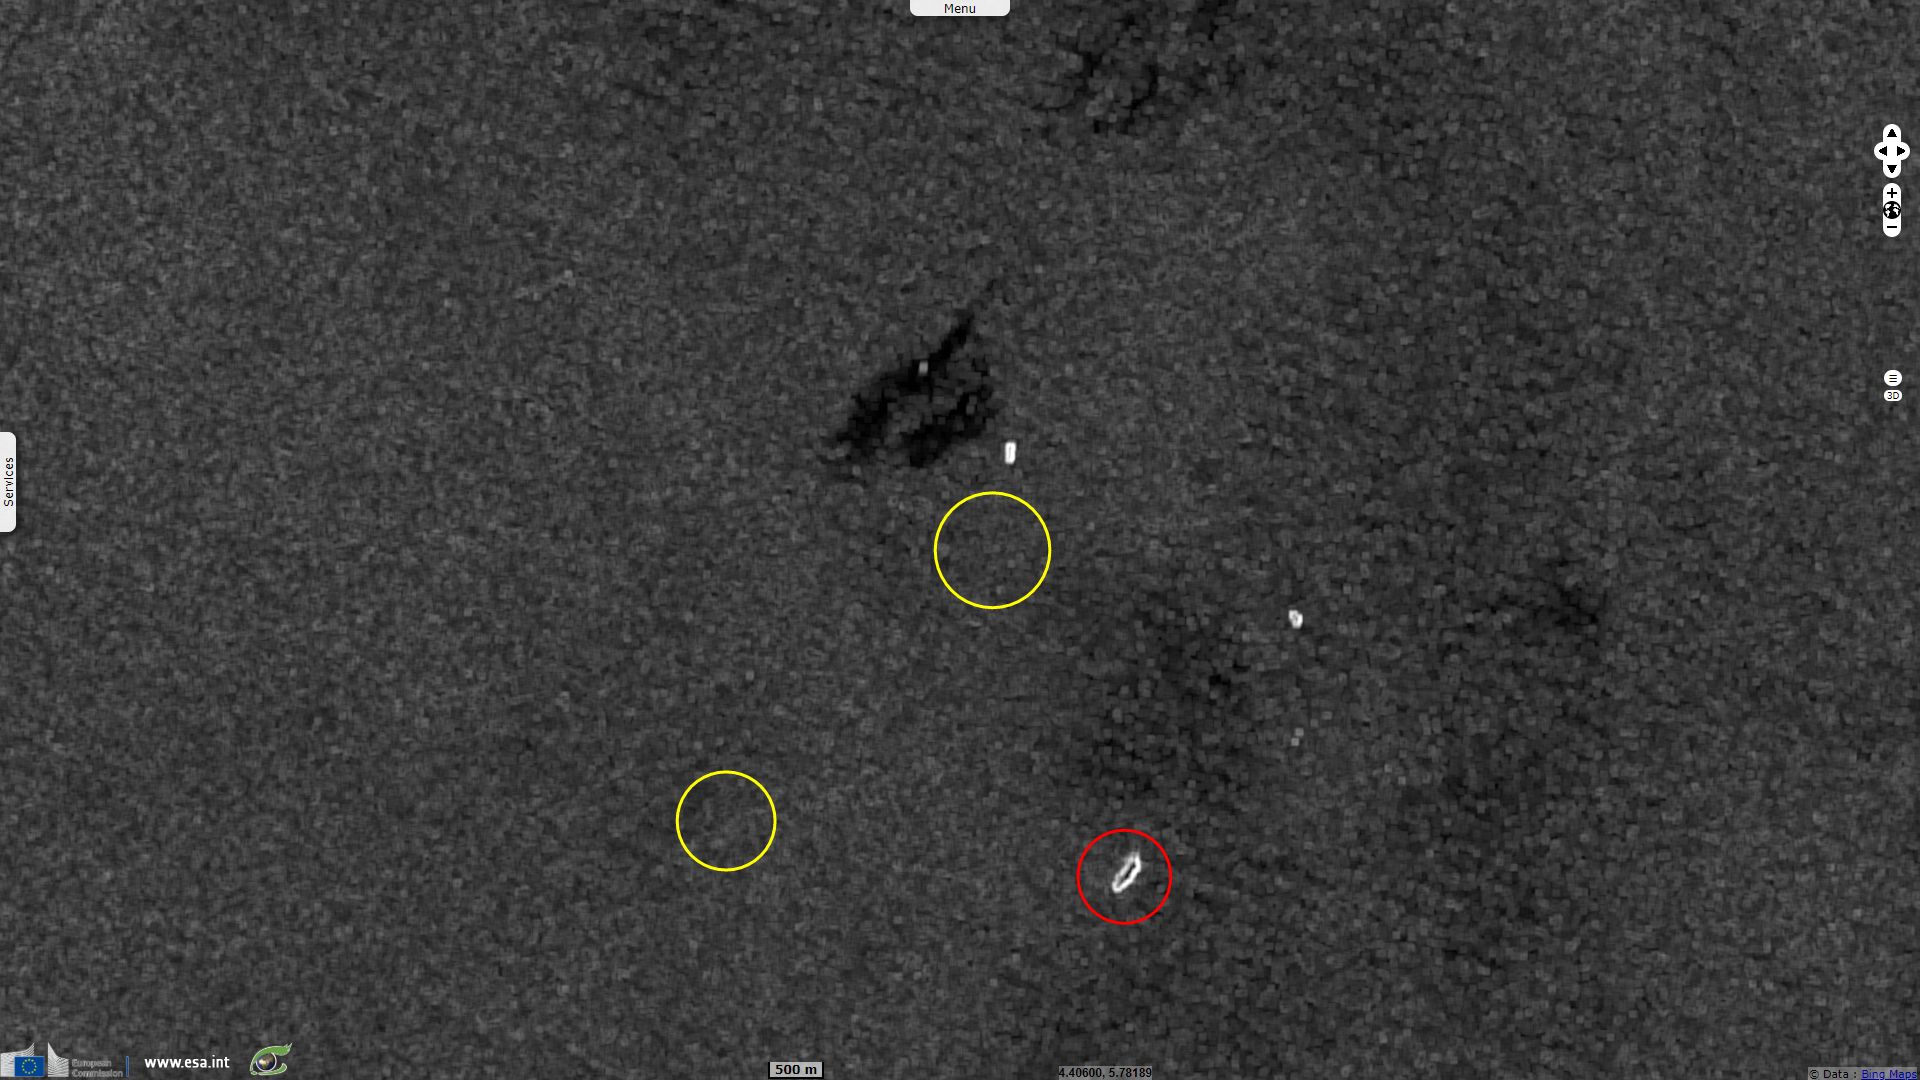
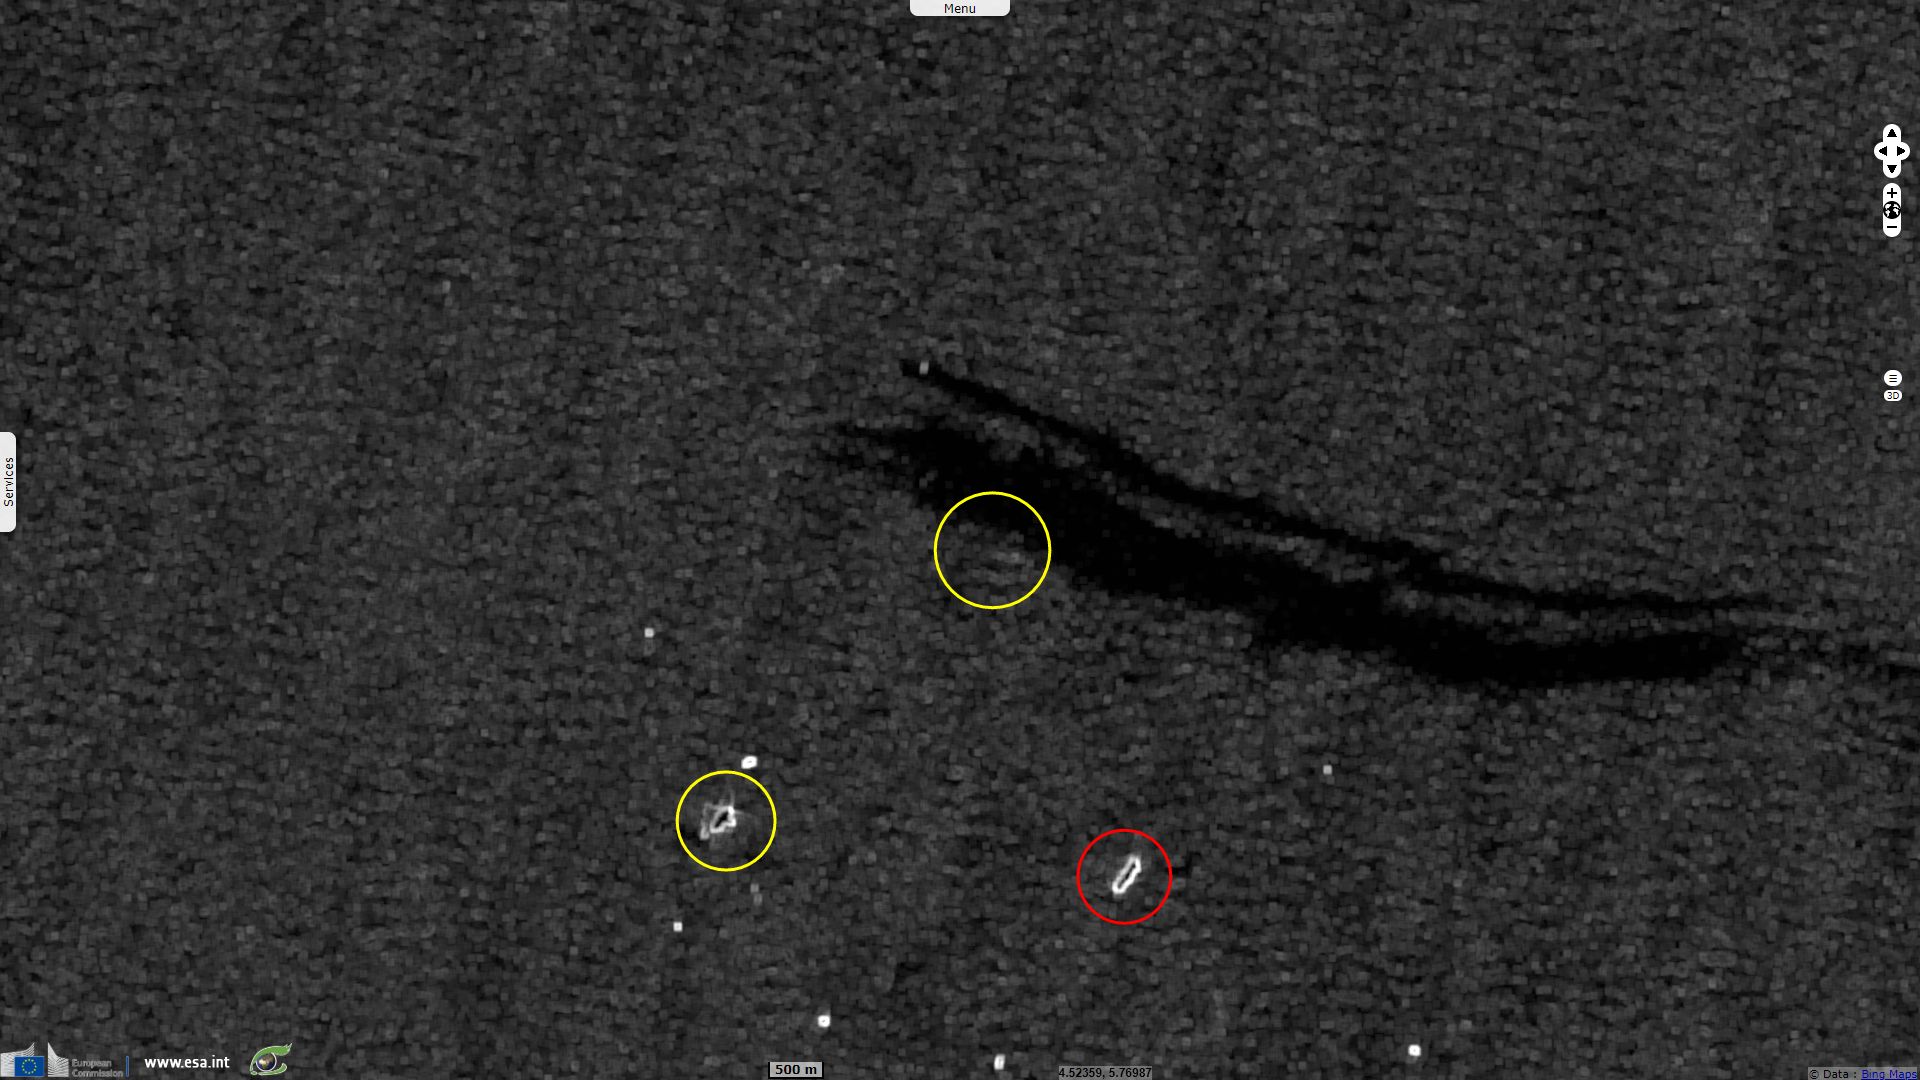
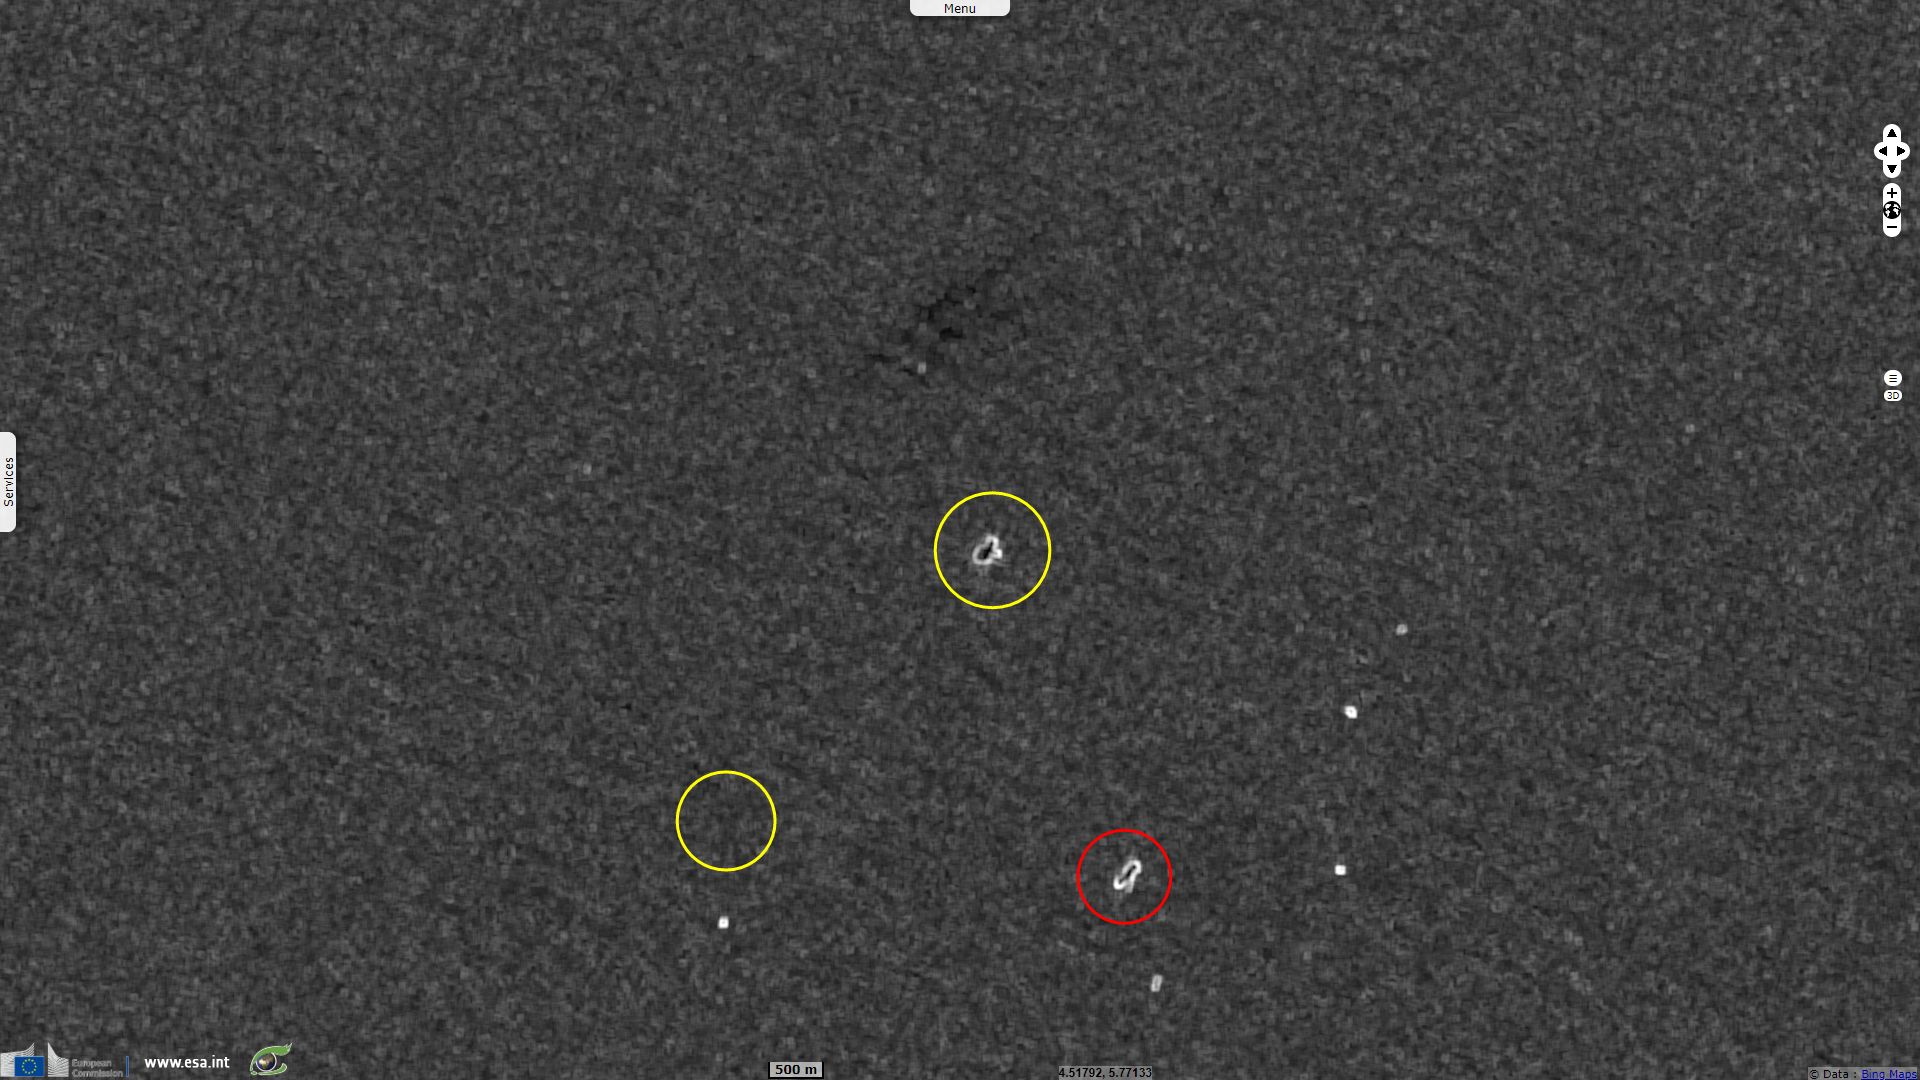
On this mean of the standard deviation of 10 acquisitions, the contour of Abo FPSO is visible in white (red circle) due to the fixed position of the ship and the high contrast between the dark sea and the bright ship.
Two identical bright grey forms are clearly visible (yellow circles). They show a ship remained stationary at one point for several months and moved to the other point for several months. It may be the signature of a drilling ship that moved from one well to the next.
Schematic representation Azurite Floating Drilling Production Storage and Offloading (FDPSO) - Source: Endeavor Management
This study builds on the success of VisioTerra's VtWeb platform, which provides access to a wide range of freely available Earth observation data. Layers of oil floating on the north-western part of the field have been identified, about 4 kilometres away from FPSO Abo’s Platform location. Presence of layer of oil floating on water surface of ABO field suggests the existence of oil pollution in the field, which is designated as oil slick. In general, oil slick results from sea floor leak, platform, and oil ship or container. Therefore, the objective of this study was to find the source of pollution at Abo Field.
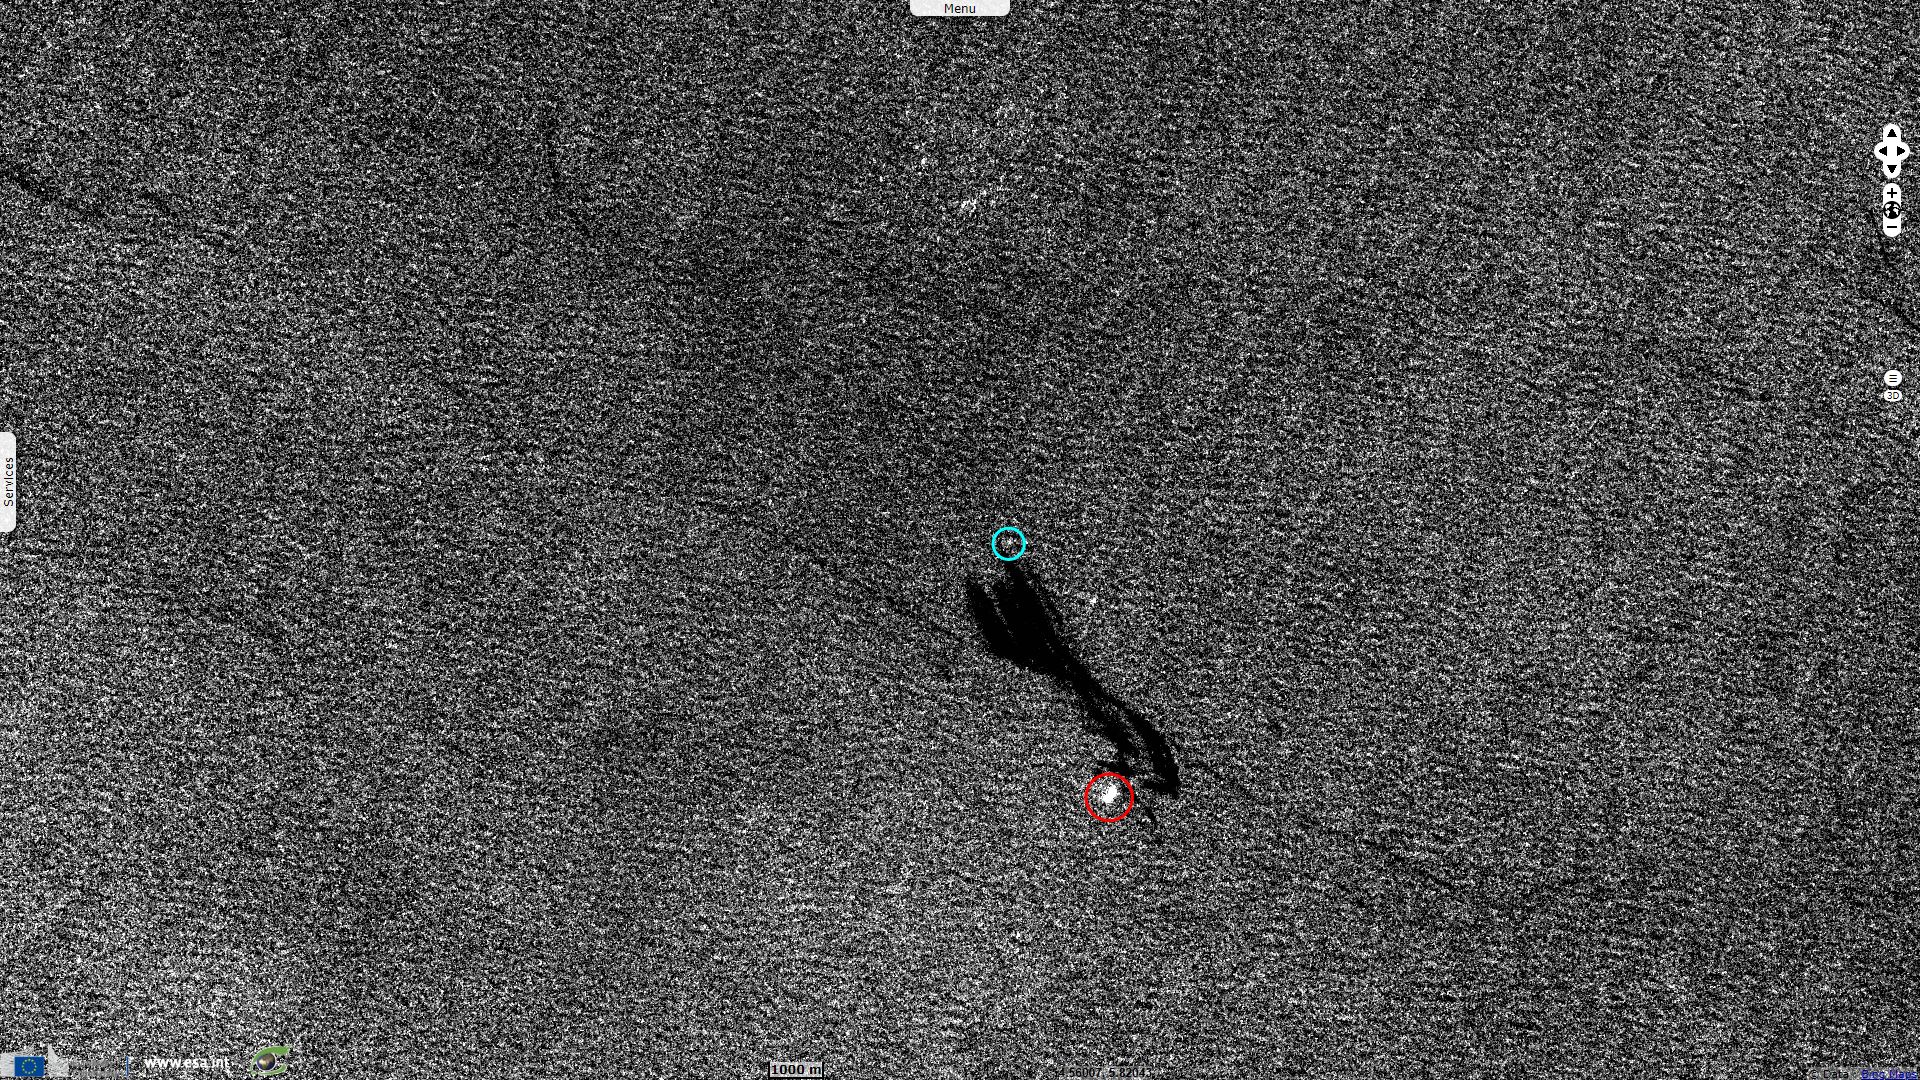
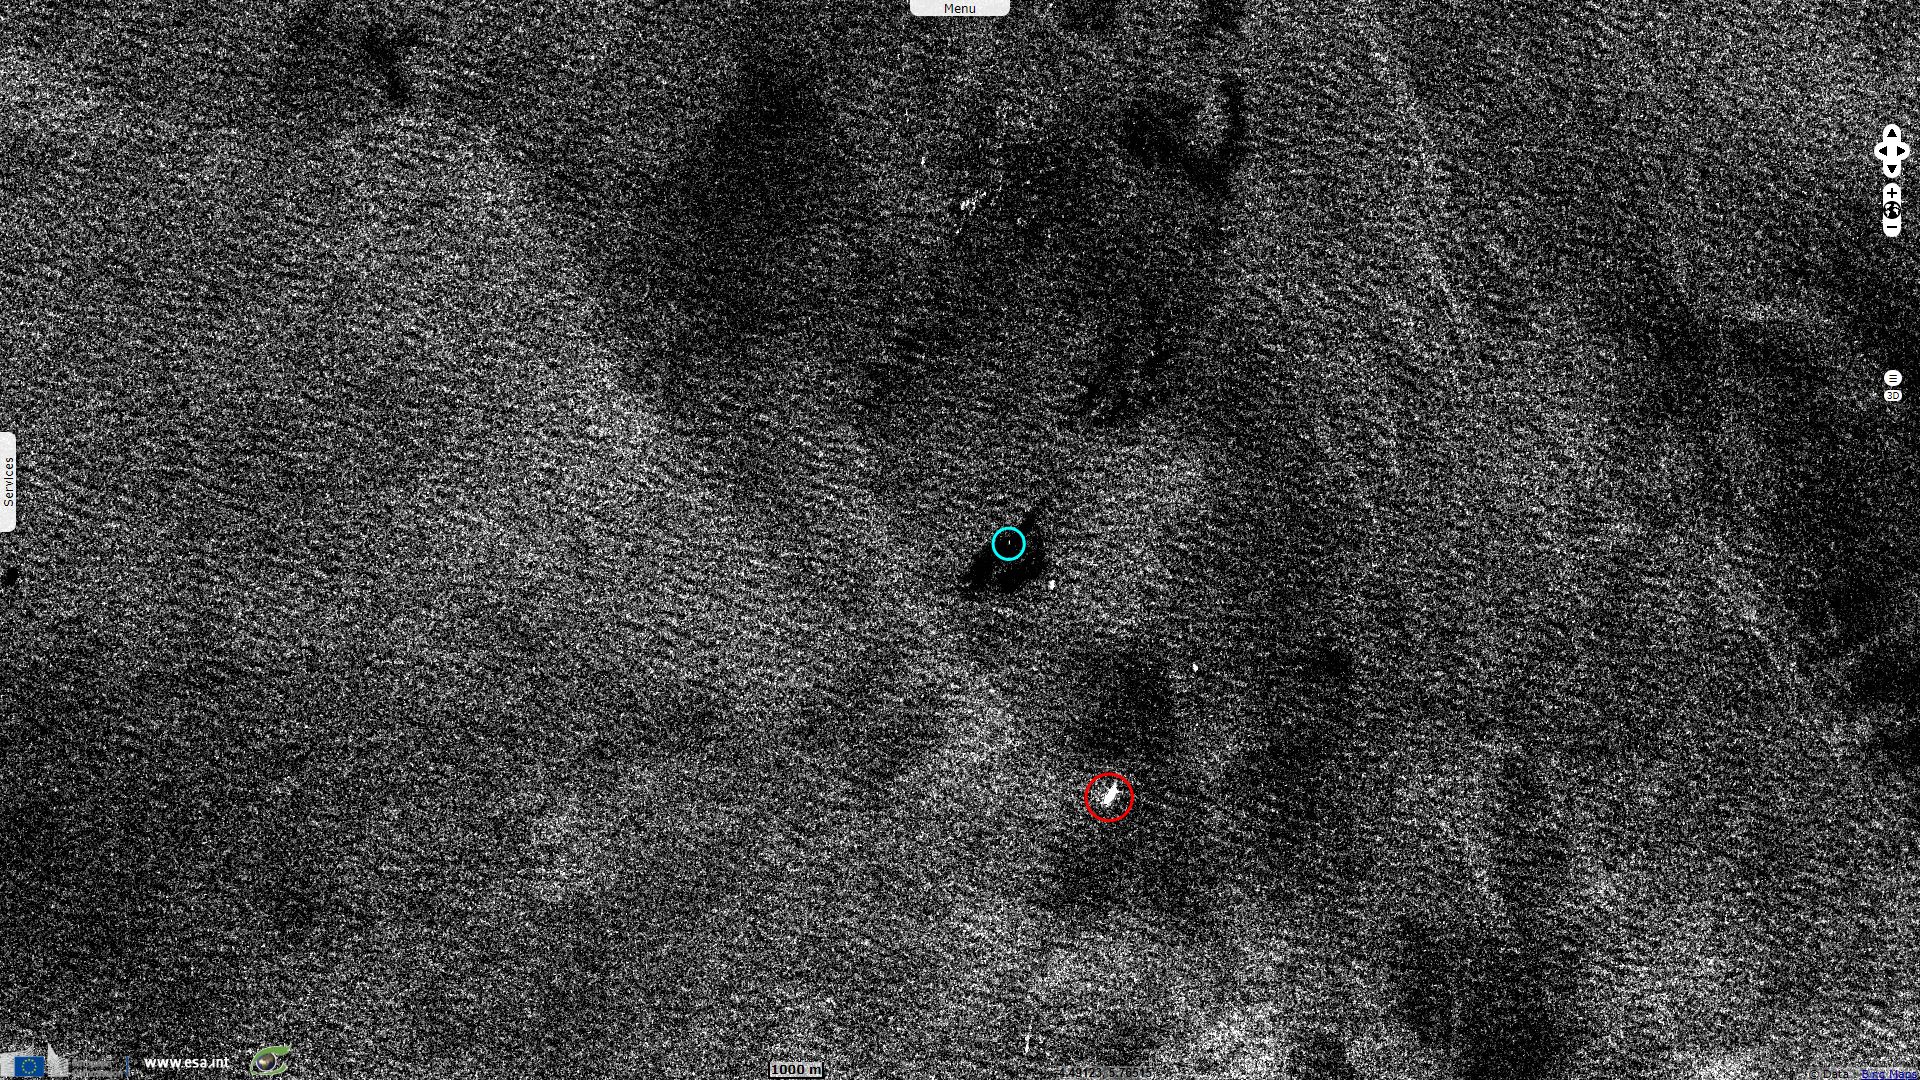
The observation process was done using Sentinel 1 CSAR since radar images are powerful tools enabling to easily observe both offshore platforms and oil slicks. Offshore platforms appear as a bright points, due to their metal structures. While oil slicks appear as very dark layer, because presence of oil on the surface of water suppresses the wavelength leading to radar signal not scattering back to the sensor.
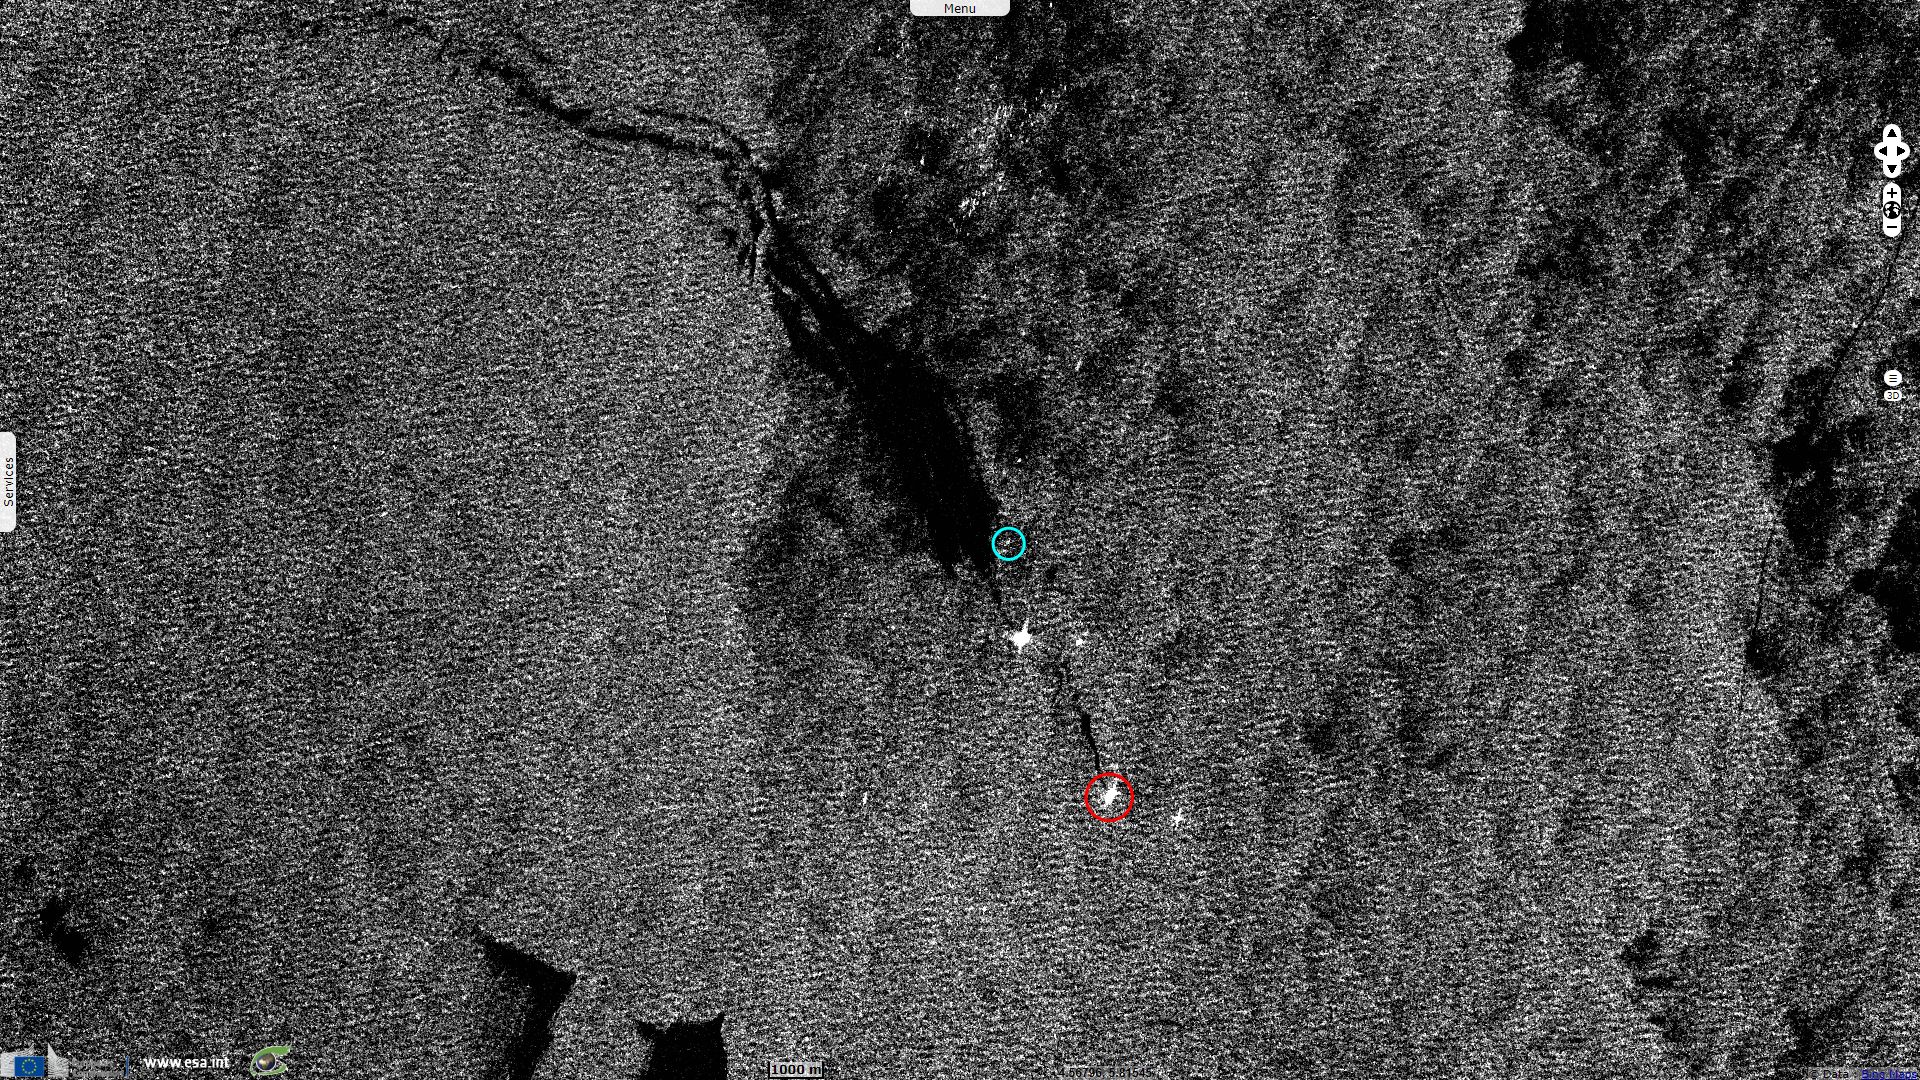
In order to reach objective of the study, 25 sentinel-1 images were captured between 9th September 2018 and 24th June 2019. These images illustrate that flow direction of oil slick has varied from time to time. Oil slicks flow toward different directions, forming a structure called oil flower, near Abo Platform (red circle mark). This formed oil flower was fully observed on the mean image, which is compilation of all observed images (fig 8). Formation of an oil flower confirms that oil has spread out from seawater surface outbreak, and flown toward different directions, that were determined by the direction of wind or water current.
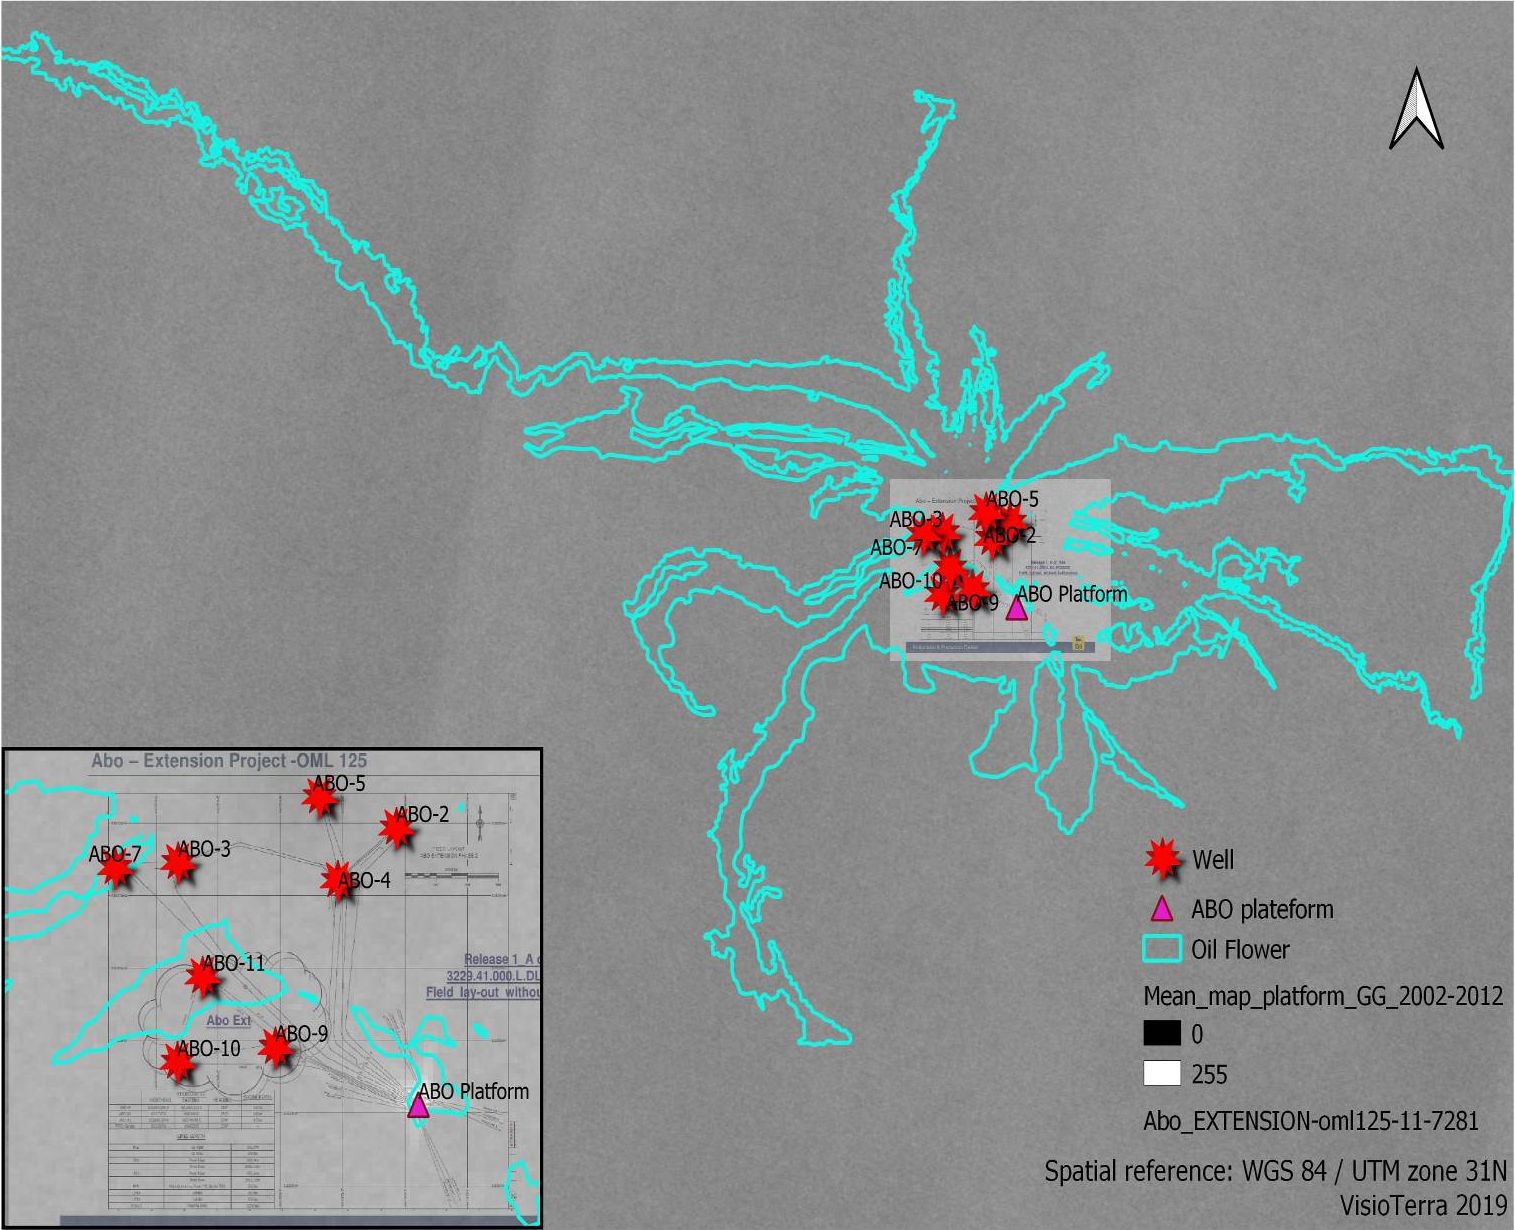
Mean of sentinel-1 images illustrating the entire Floating Production Storage and Offloading (FPSO) system installed at Abo Platform and the oil flower structure found around it - Source: VisioTerra.
Moreover, this study used “Abo FPSO underwater network map”, published by ENI Company. Then, it was made a relation between used map and mean image with oil flower. This relation has permitted to locate on surface the position of all wells installed on seabed, and to see if there is any relation between observed oil flower and wells. It was seen that oil flower was formed at the same place where wells of Abo FPSO underwater network were installed. Also, it was noticed that location from where oil spreads out on surface to create oil flower structure is the same location where well ABO-5 was installed on seabed.
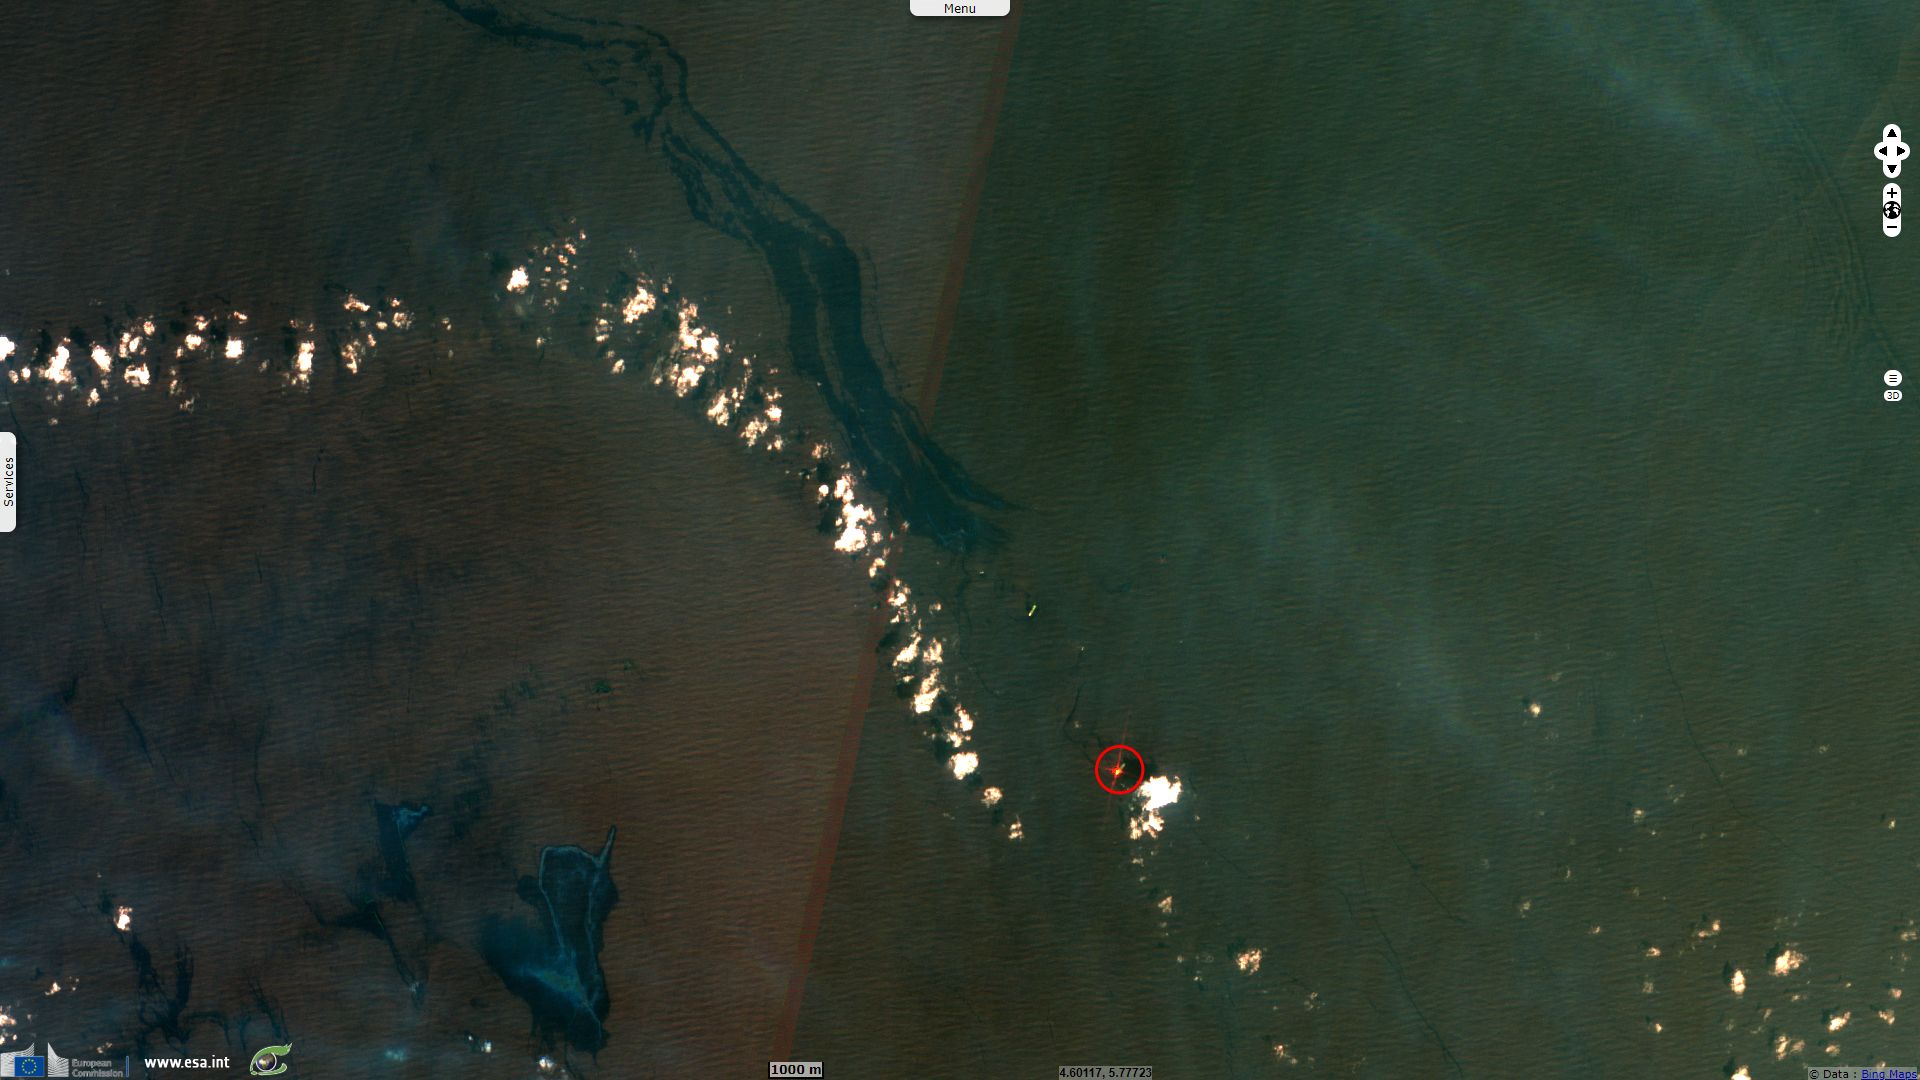
Depending on the thickness of the oil layer, its optical aspect changes as codified by the Bonn Agreement Oil Appearance Code (BAOAC), allowing a rough estimation of the volumes visualised.
After completing several observations and analysis, this study concludes that well ABO-5 system is the source of oil pollution in the Abo field. It seems that oil spills from well ABO-5, because spreading point of oil flower was founded at same place where well ABO-5 was installed beneath seawater. Regarding that well ABO-5 is attached on seabed and linked to FPSO platform by pipelines, this study recommends that rigorous maintenance should be done on the entire ABO-5 system (the well itself and its pipeline) to find the exact place where oil escapes out from.
The views expressed herein can in no way be taken to reflect the official opinion of the European Space Agency or the European Union.
Contains modified Copernicus Sentinel data 2026, processed by VisioTerra.
Contains modified Copernicus Sentinel data 2026, processed by VisioTerra.
| More on European Commission space: |  |
 |
 |
||||
| More on ESA: | |
|
|
S-1 website | S-2 website | S-3 website | |
| More on Copernicus program: | |
|
|
Scihub portal | Cophub portal | Inthub portal | Colhub portal |
| More on VisioTerra: | |
|
|
Sentinel Vision Portal | Envisat+ERS portal | Swarm+GOCE portal | CryoSat portal |