Santa Anas powered wildfires in South California
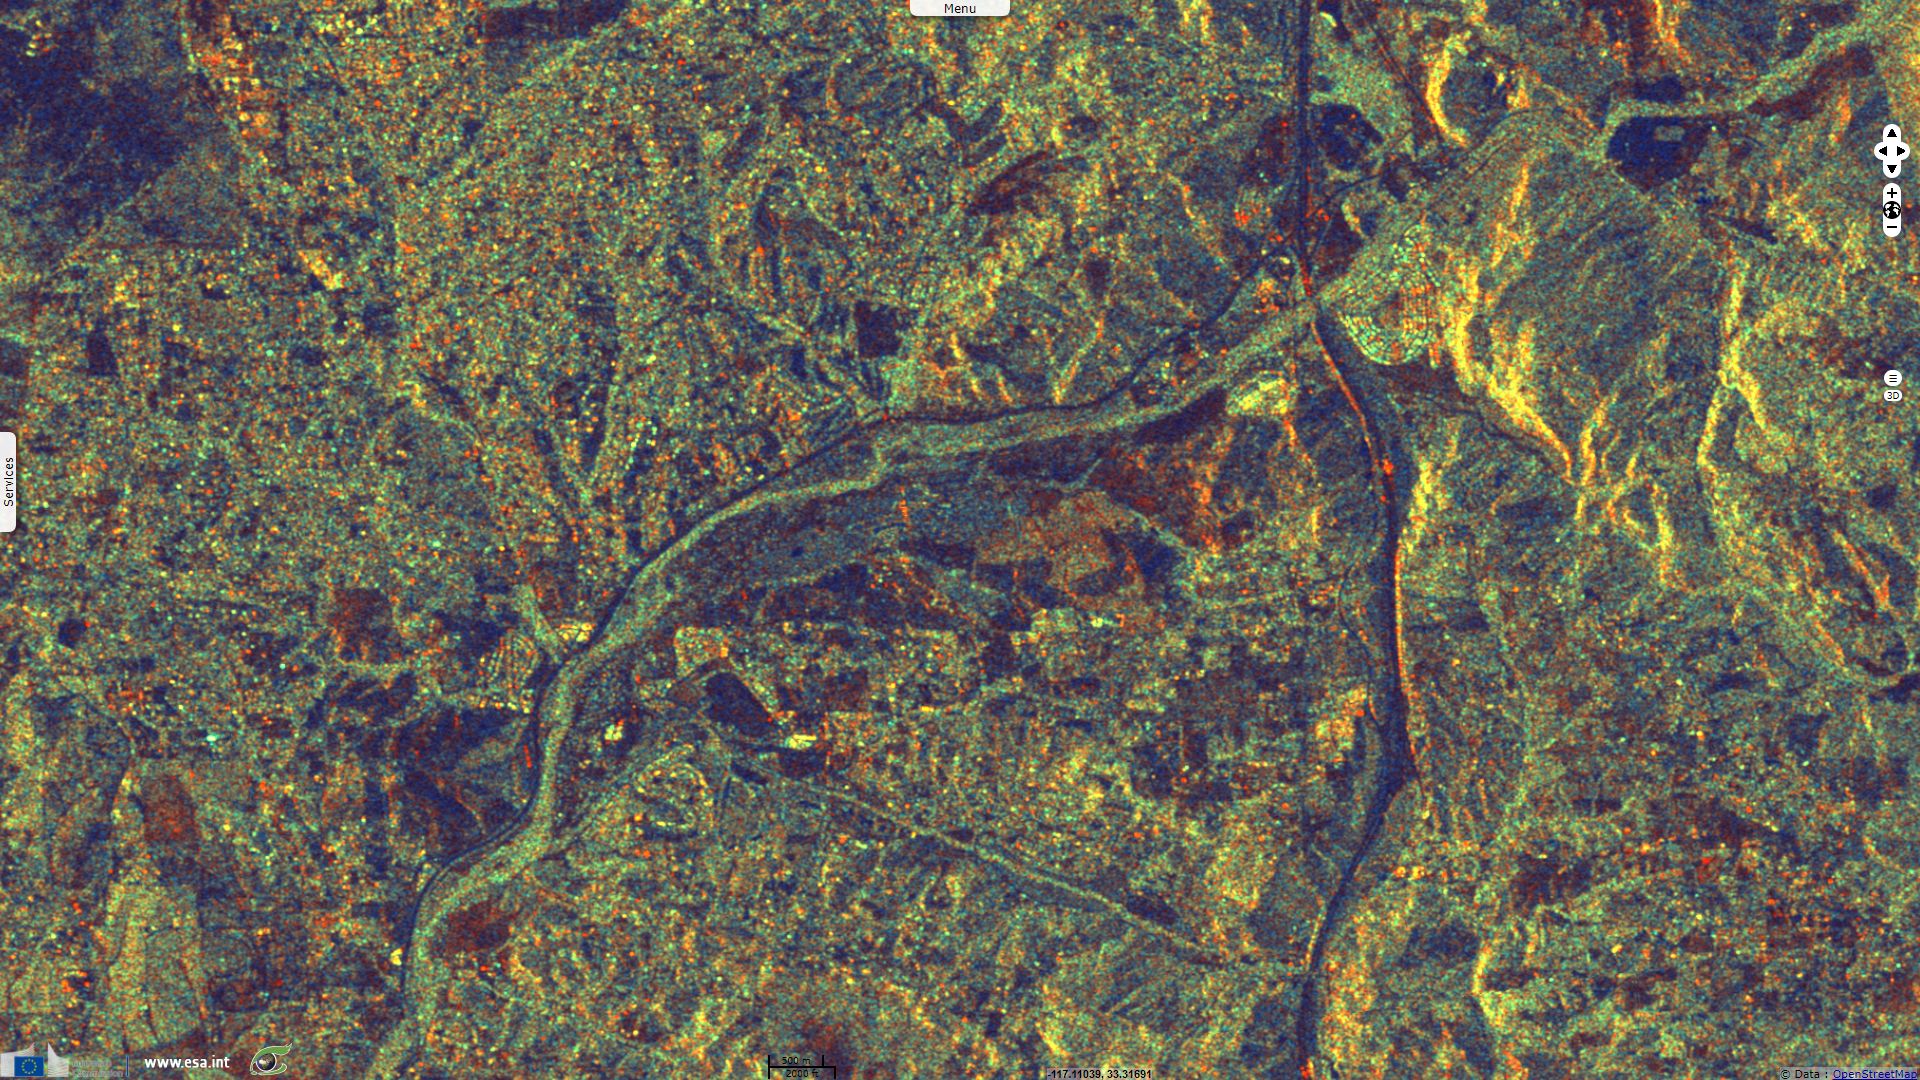
Sentinel-1 CSAR IW acquired on 28 November 2017 at 14:00:17 UTC
...
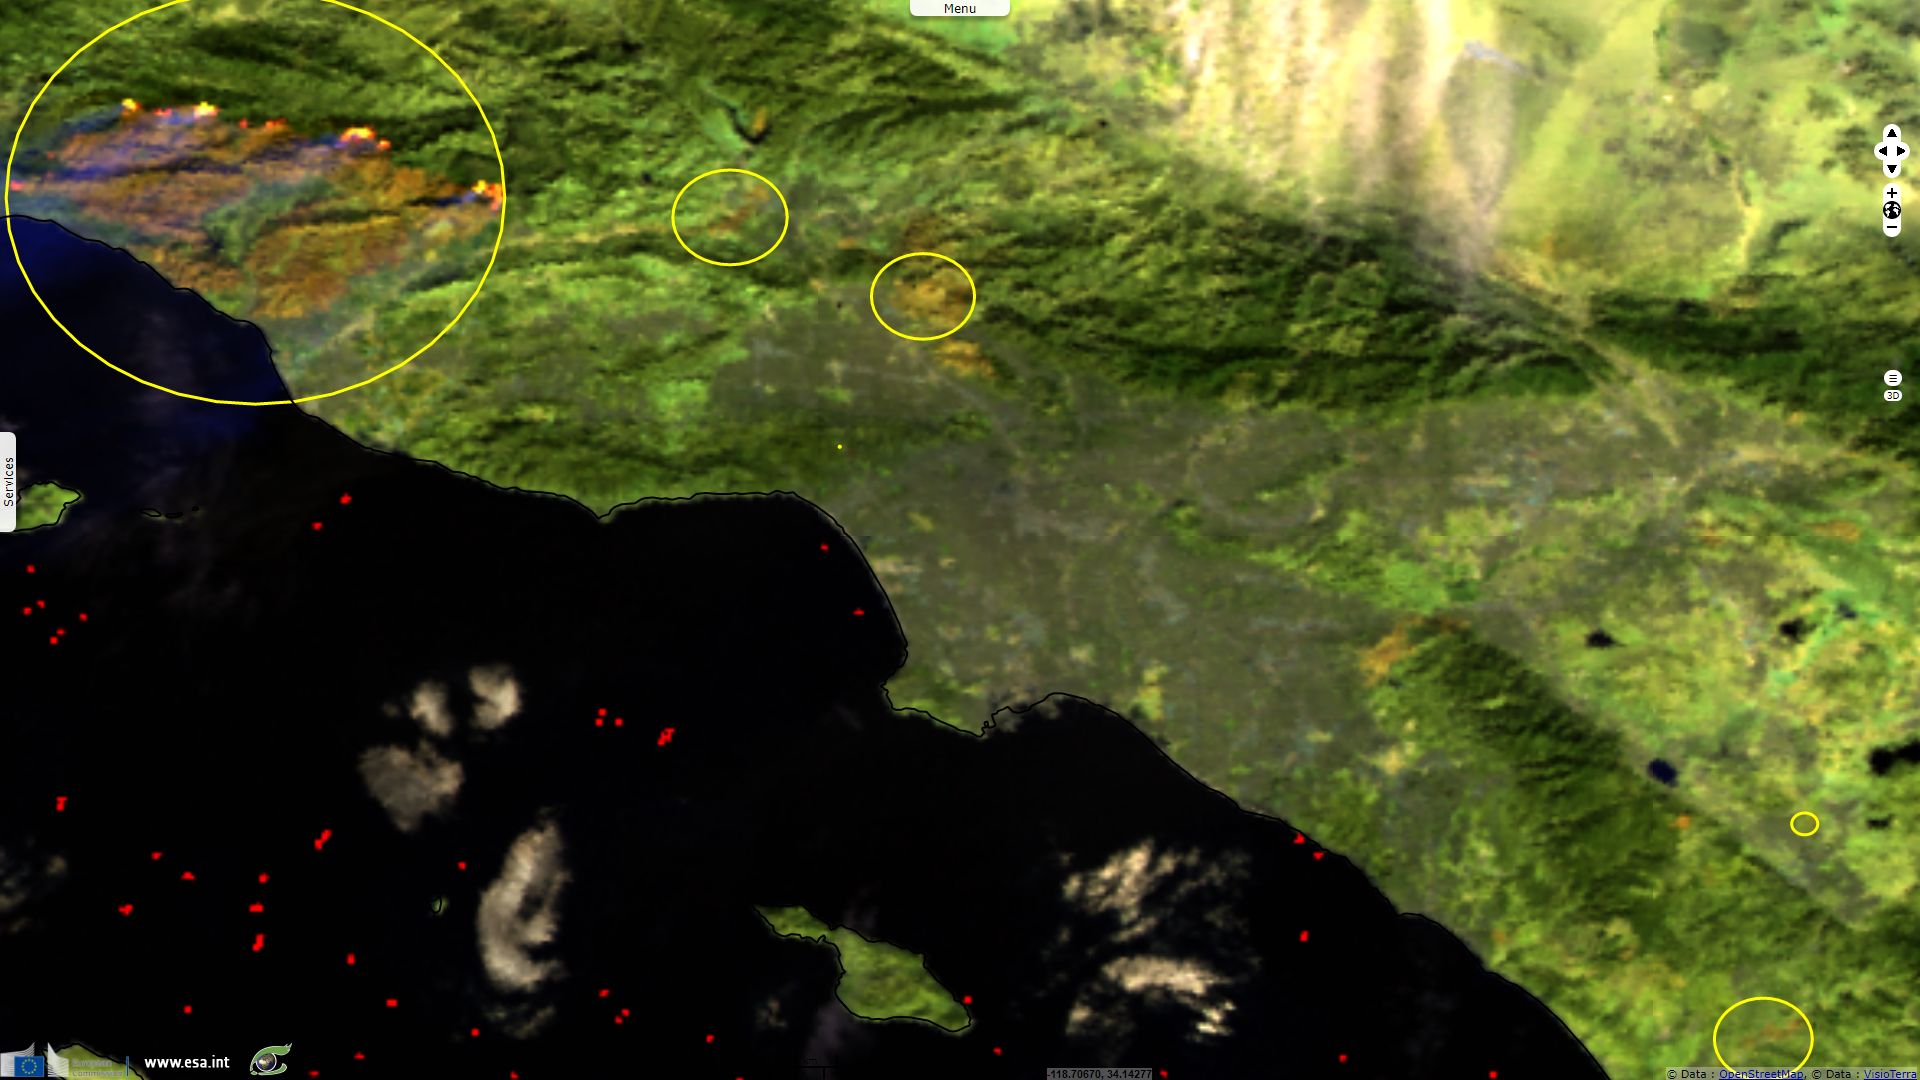
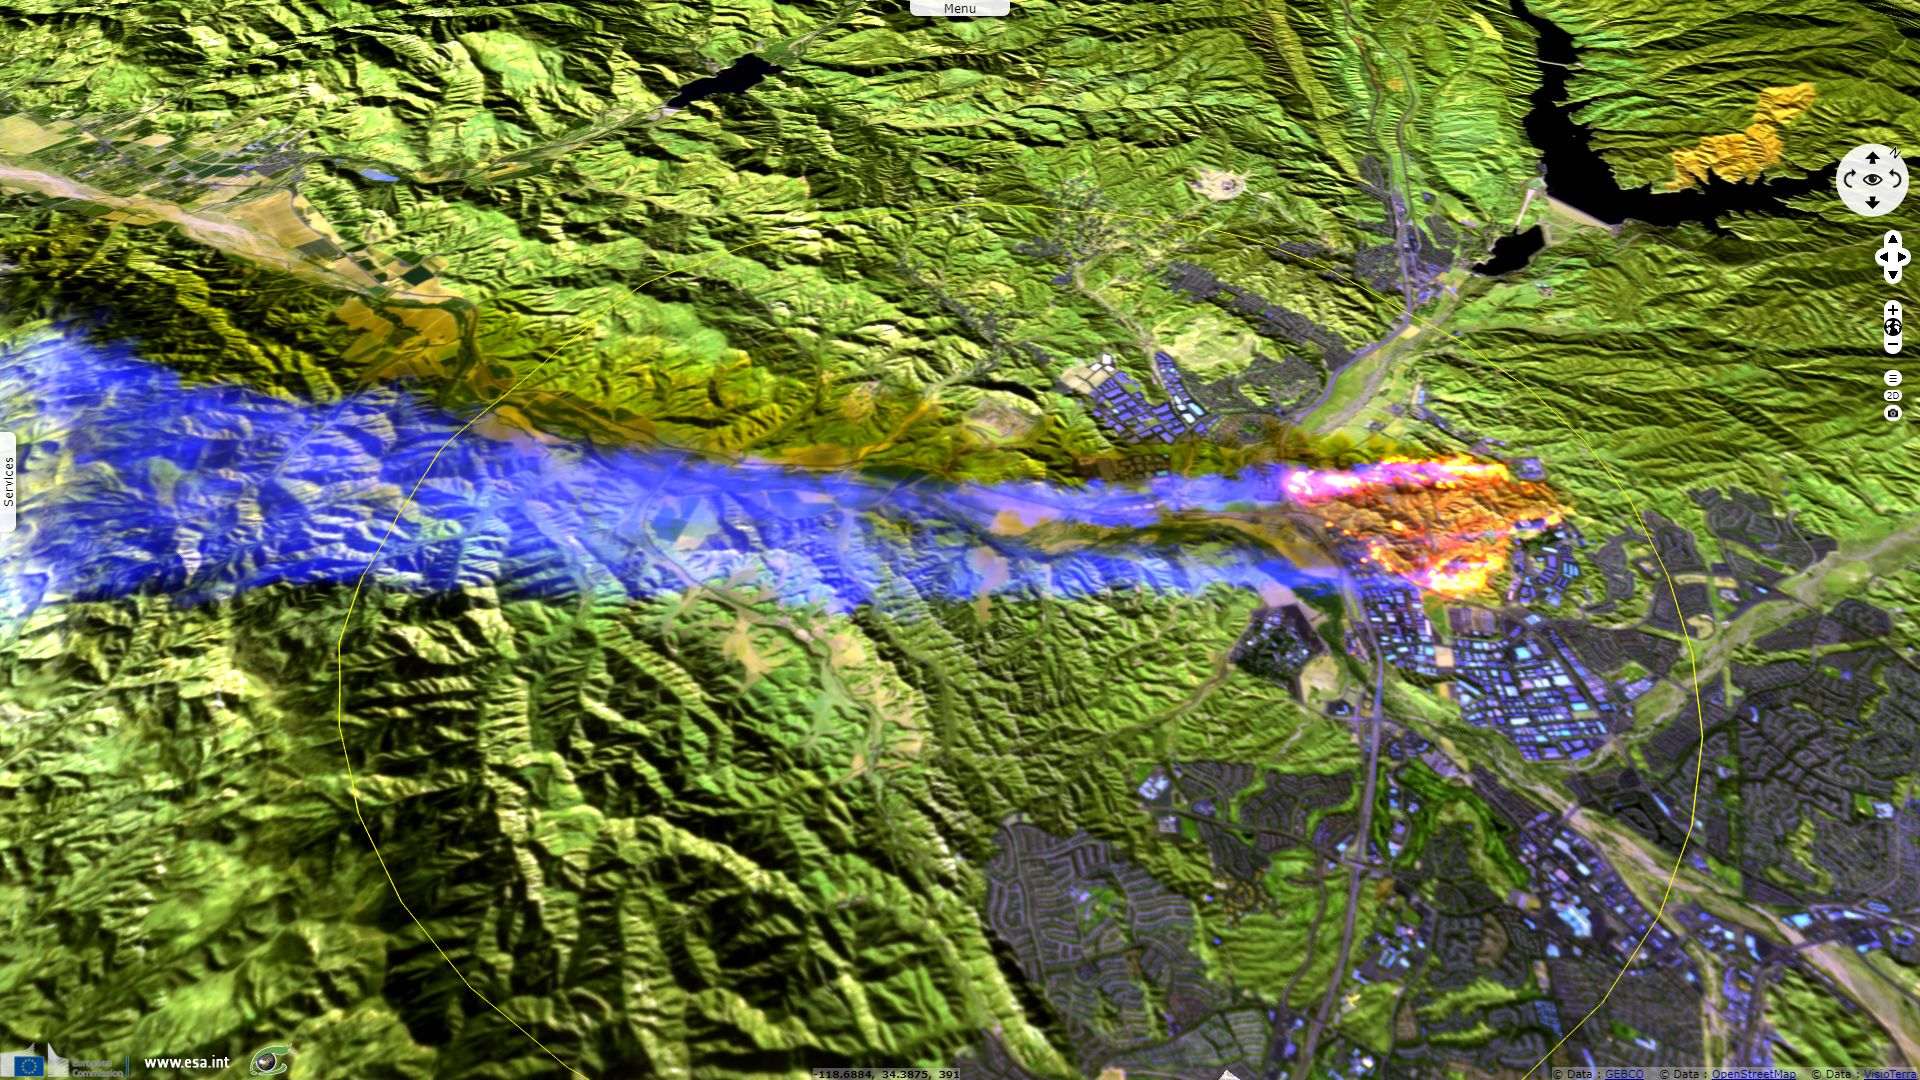
Sentinel-3 OLCI FR acquired on 18 December 2017 at 18:25:51 UTC
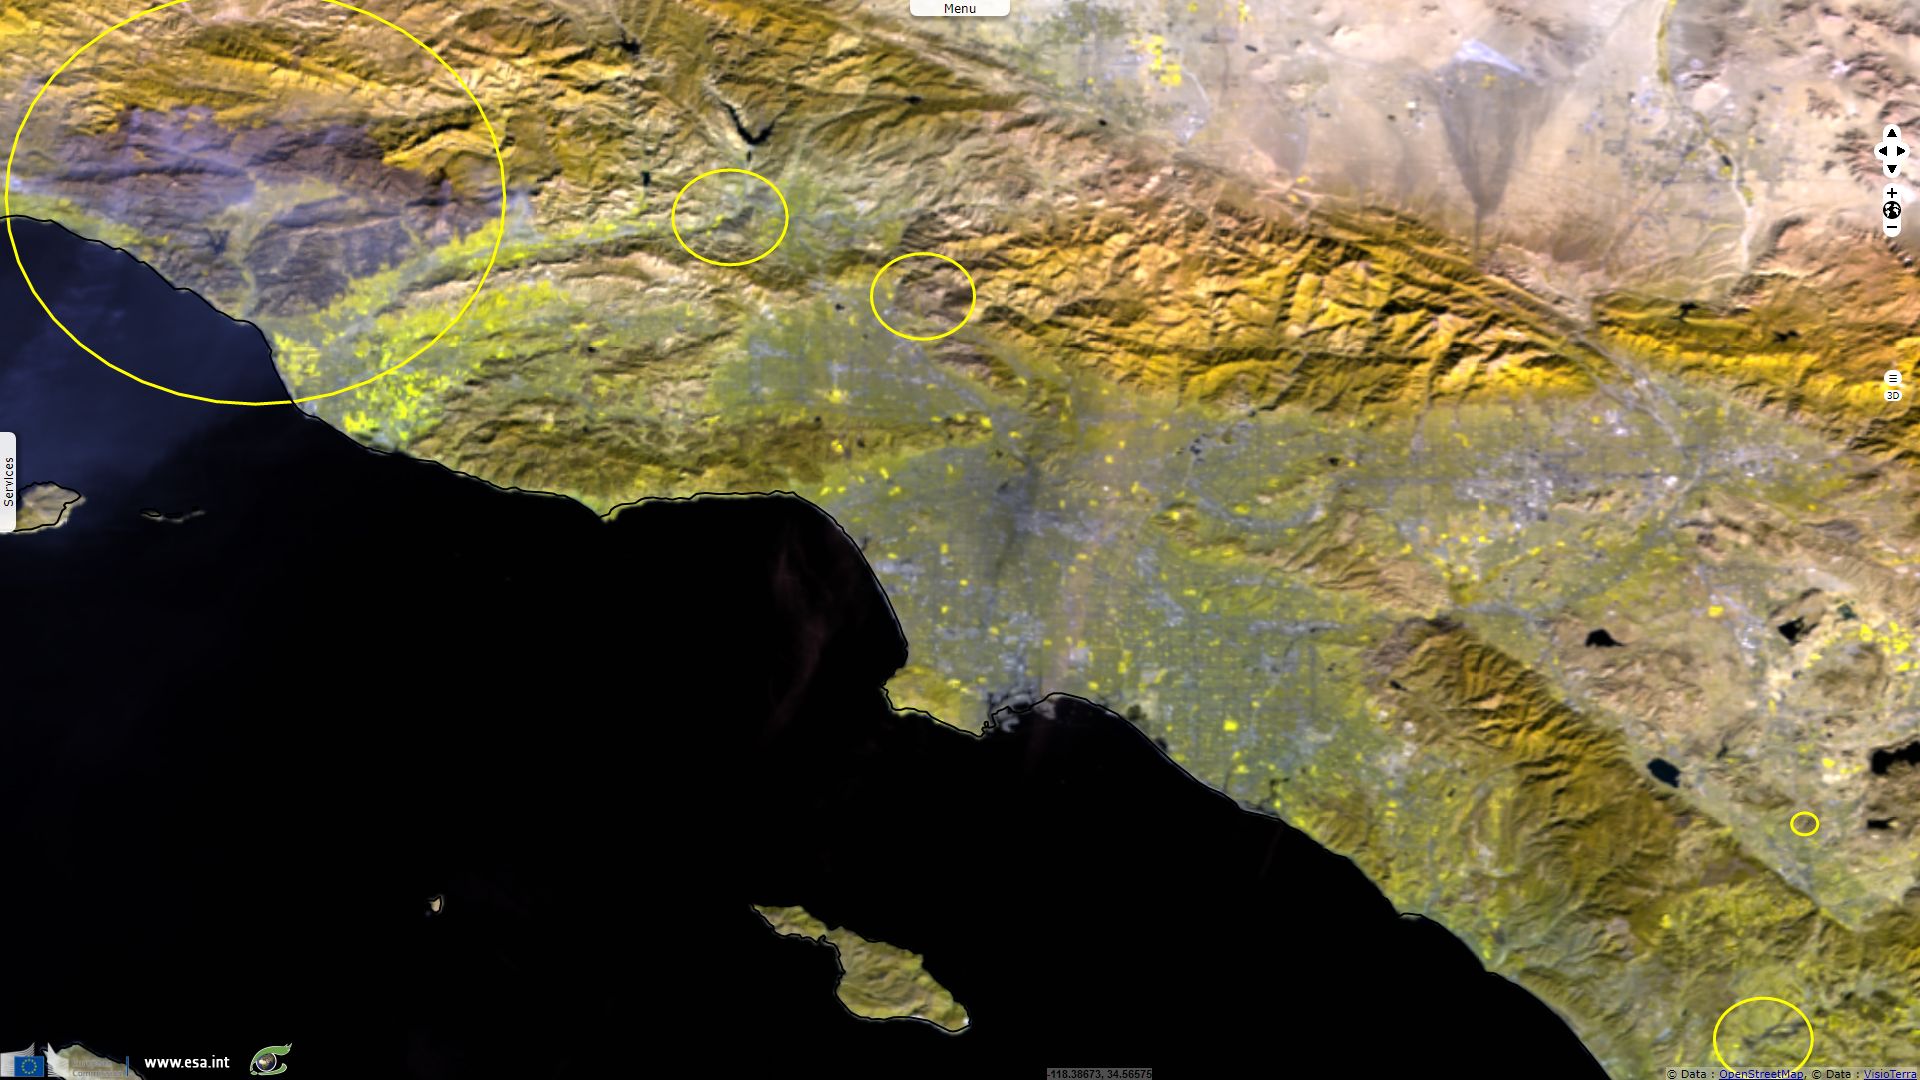
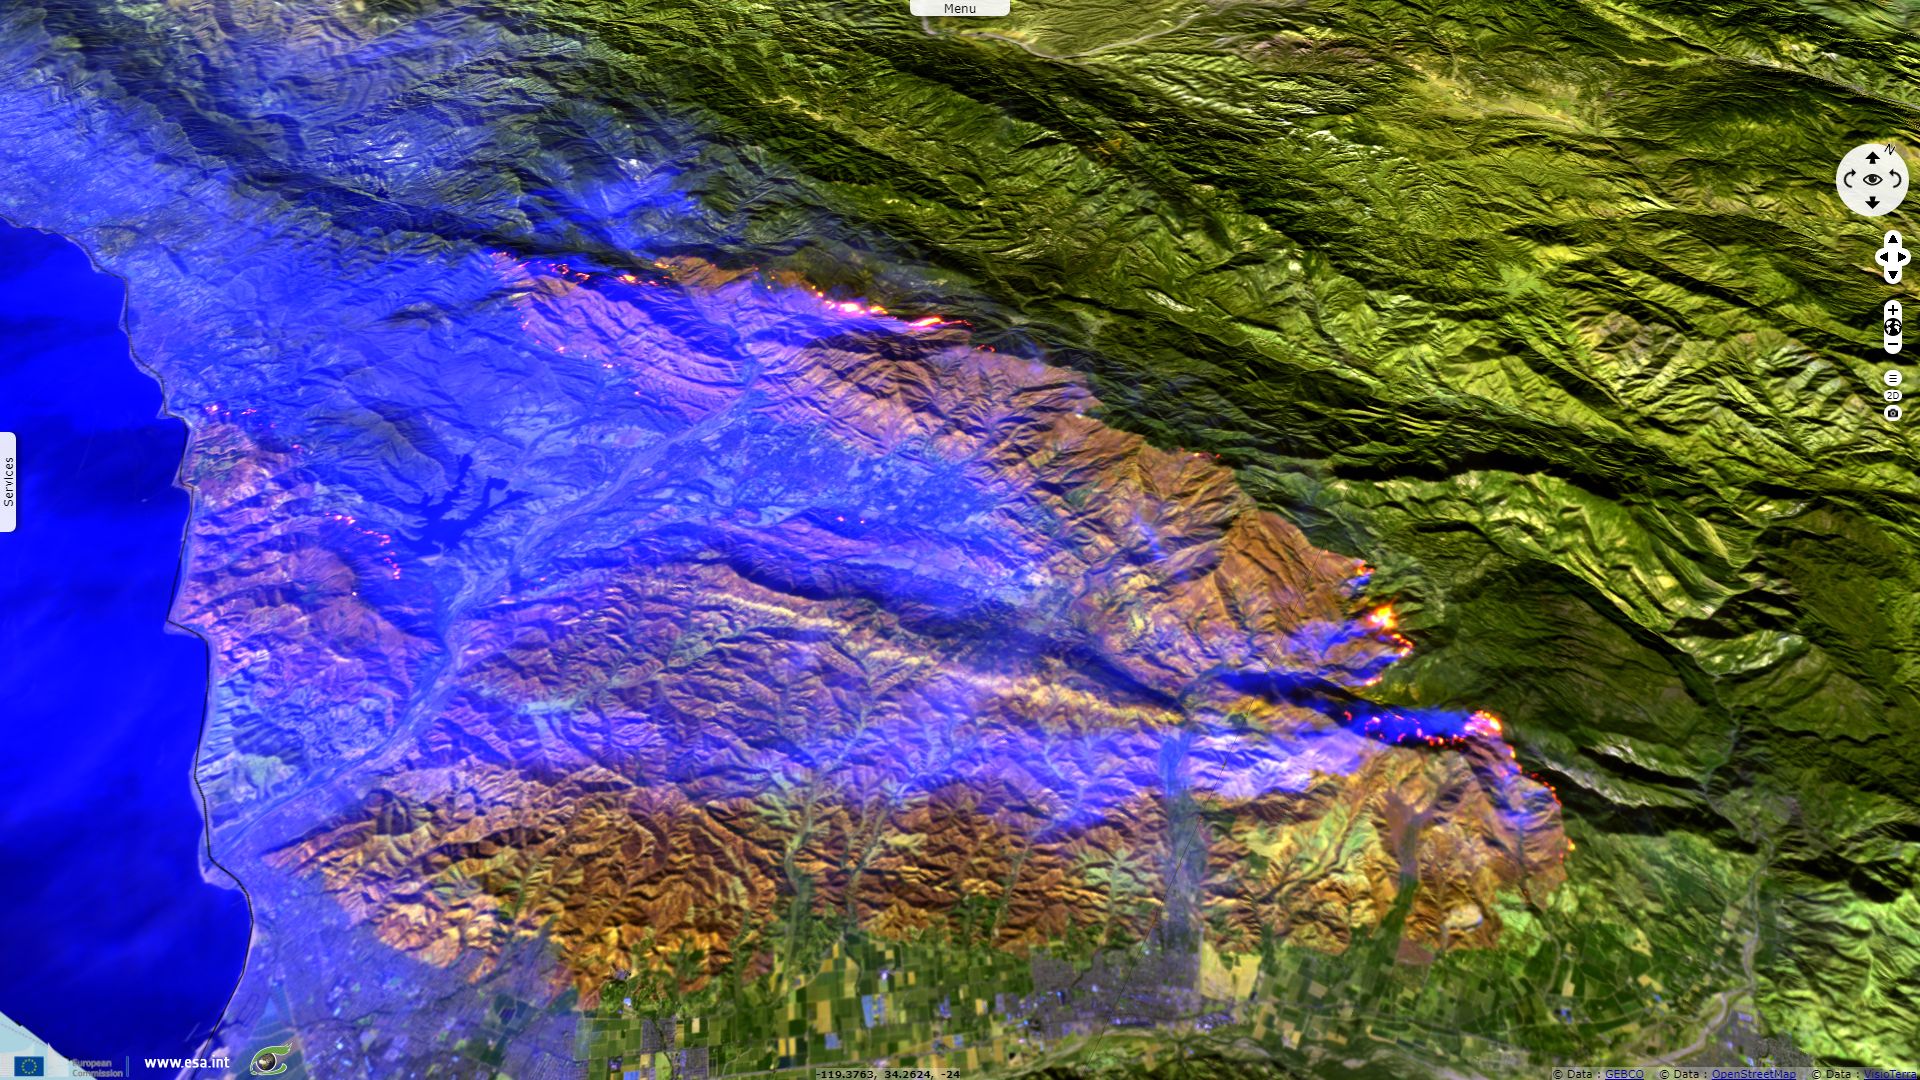
Sentinel-2 MSI acquired on 18 December 2017 at 18:47:49 UTC
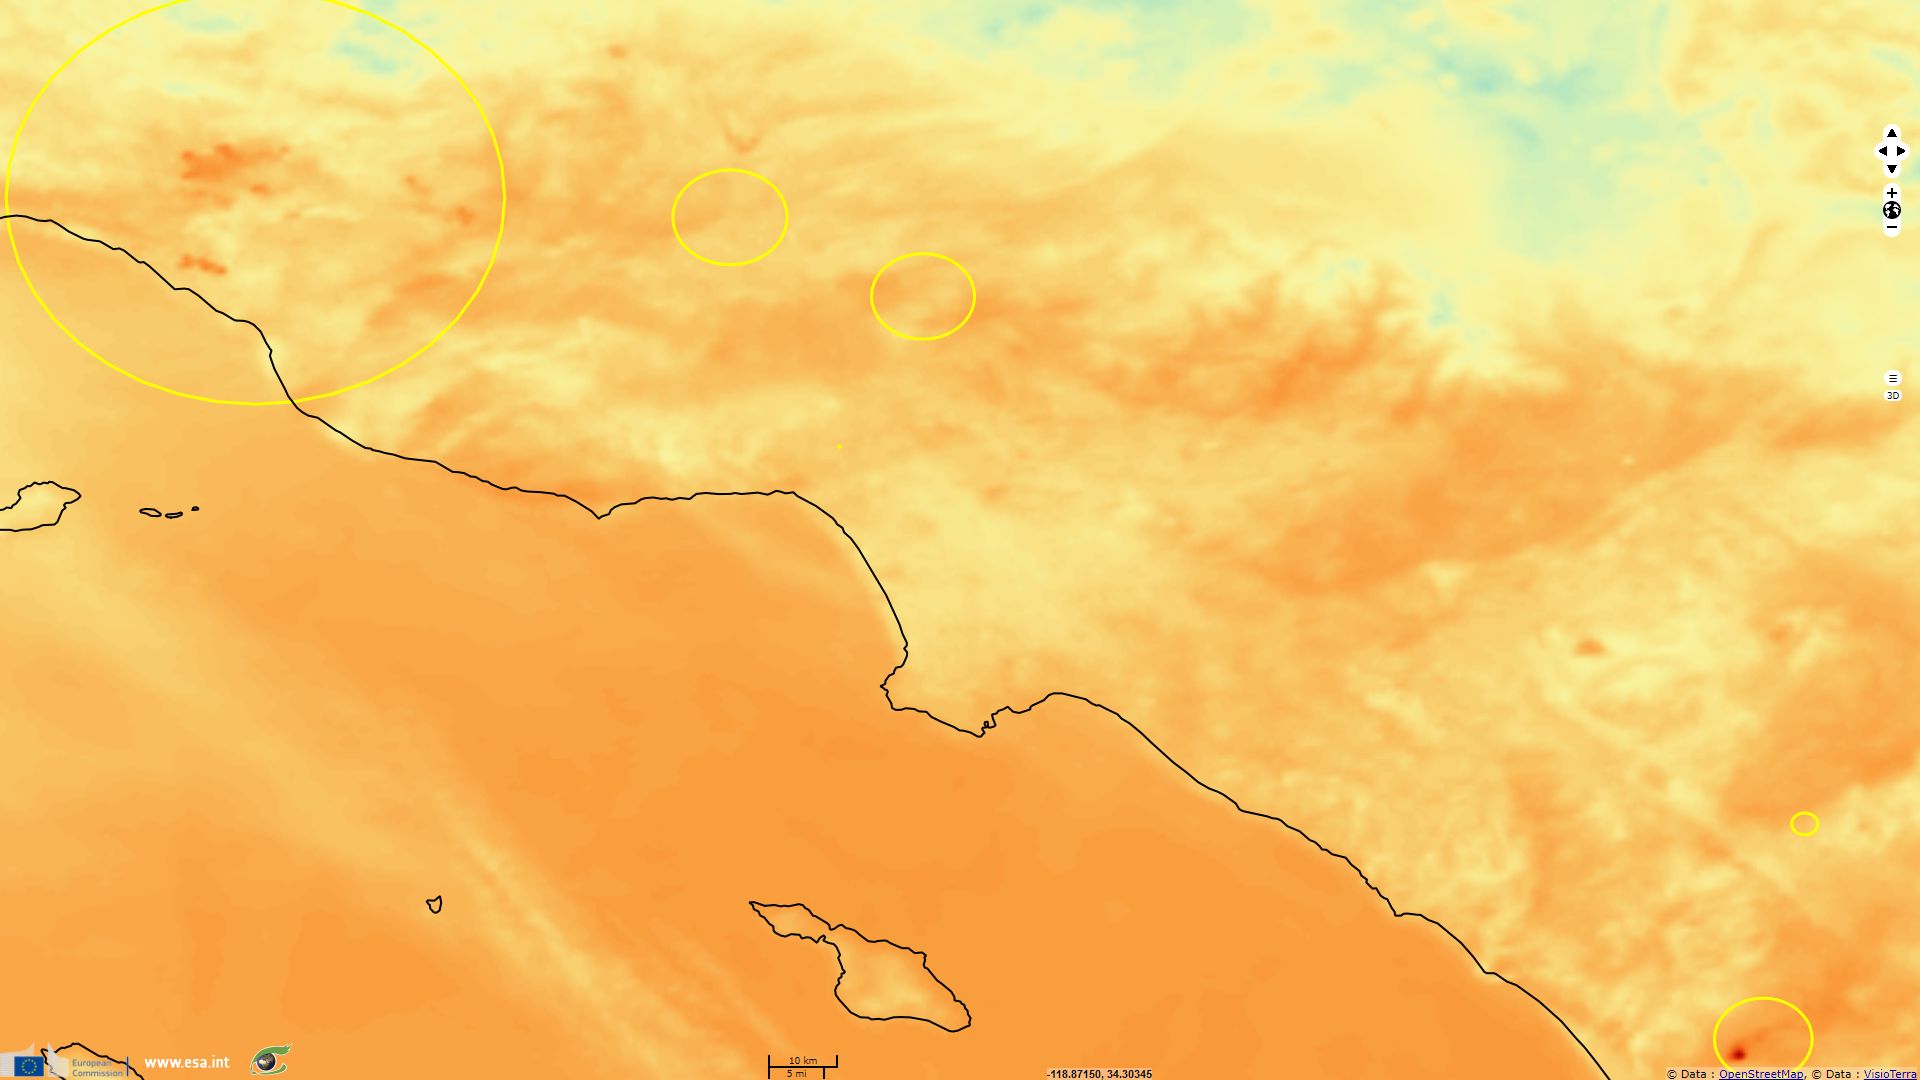
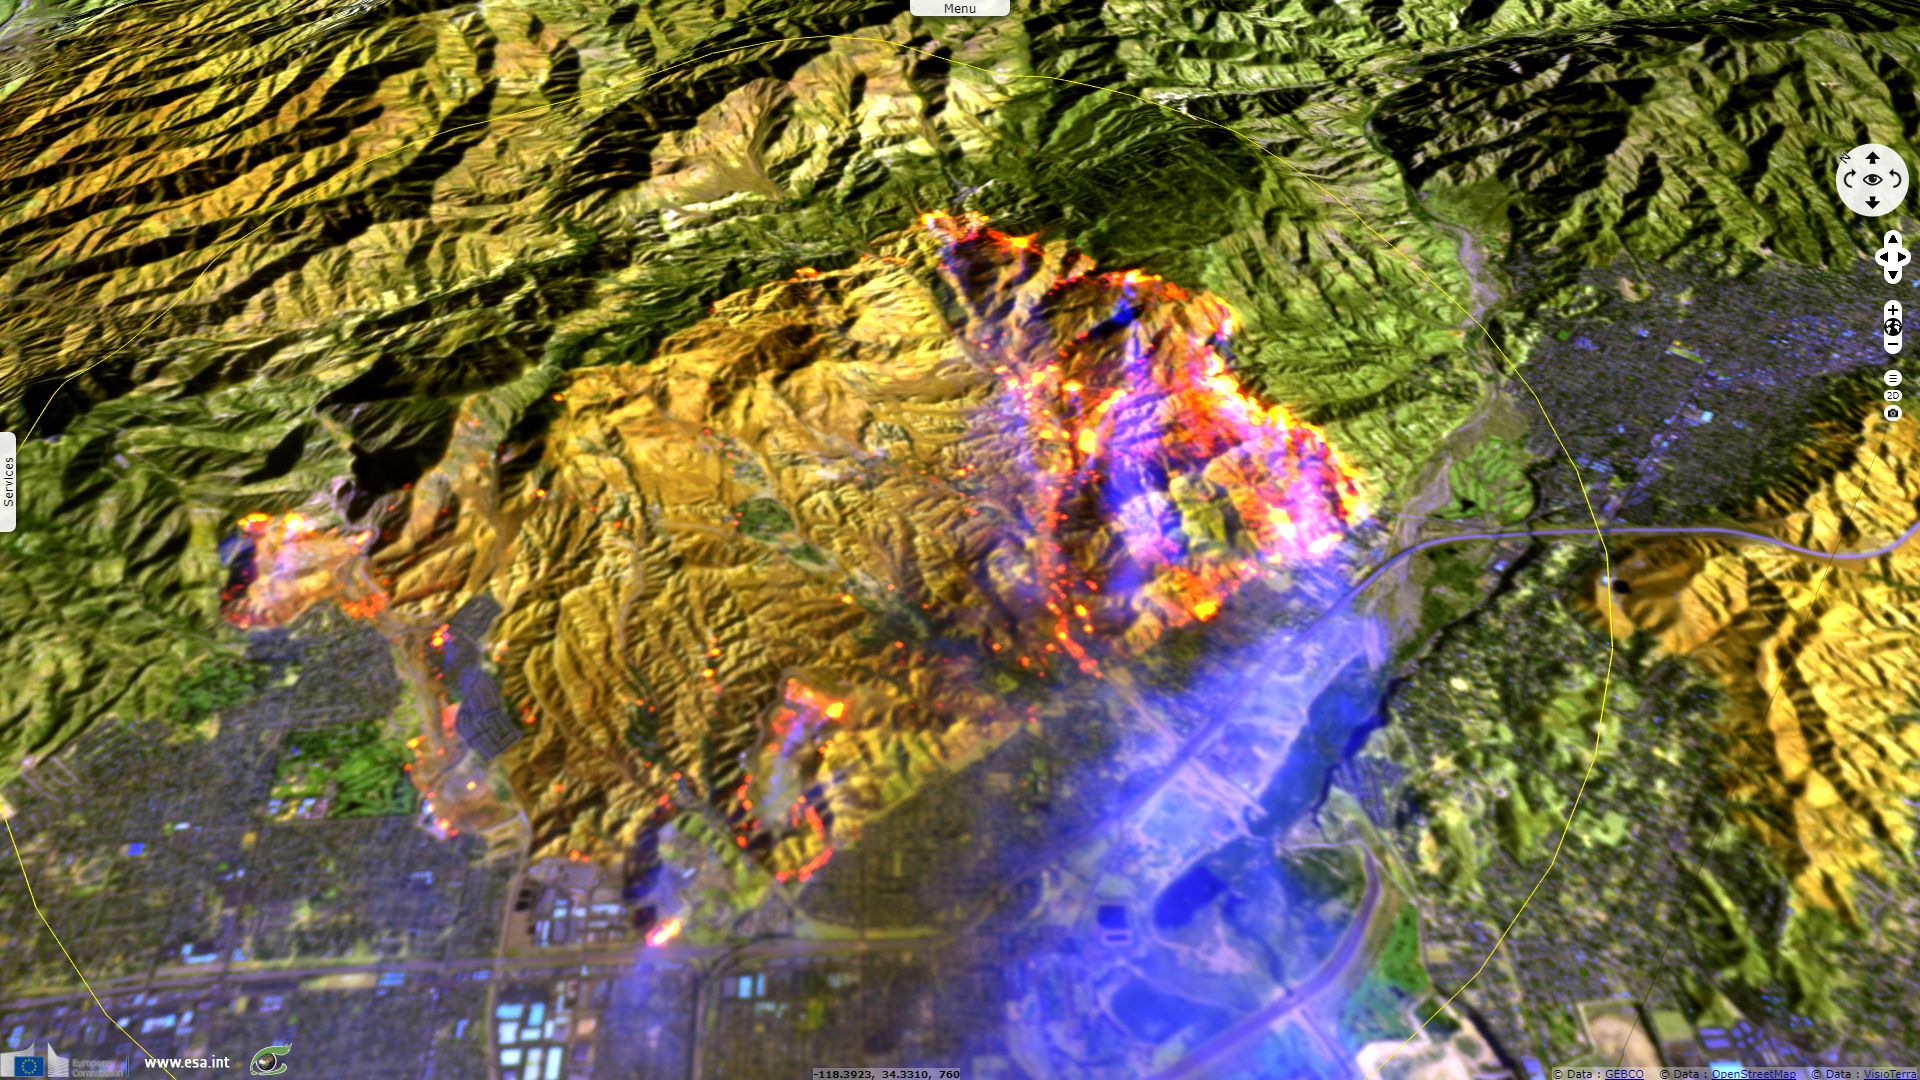
Sentinel-3 SLSTR RBT acquired on 19 December 2017 at 05:42:45 UTC
...
Sentinel-3 OLCI FR acquired on 18 December 2017 at 18:25:51 UTC
Sentinel-2 MSI acquired on 18 December 2017 at 18:47:49 UTC
Sentinel-3 SLSTR RBT acquired on 19 December 2017 at 05:42:45 UTC
Keyword(s): Climate change, land, emergency, wildfire, wind, urban growth, California, United States of America
Important rainfalls that caused floodings in early 2017. While it may have mitigated consecutive years of drought, it was not enough to prevent several wildfire episodes that happened in October and December 2017.
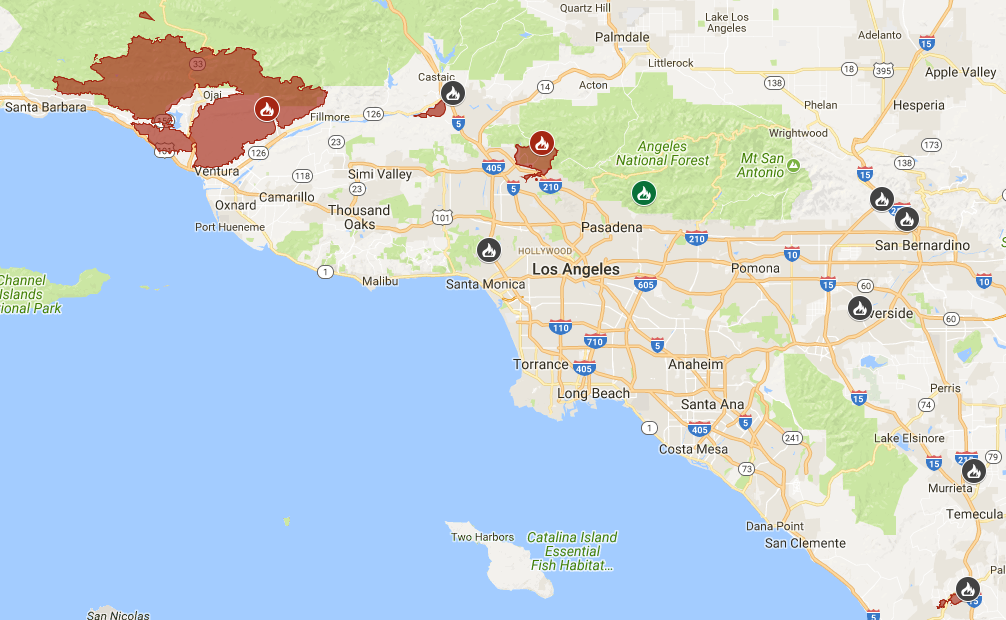
Statewide Fire Map as of 20 December 2017 provided by California Department of Forestry and Fire Protection (CalFire)
One of the causes is that almost all of South California is abnormally dry or faces a moderate drought. This makes the vegetation more vulnerable to wildfires.

Drought map of California as of 14.12.2017 by Jessica Blunden for NCEI/NOAA
One of the contributing factors to this winter drought are the Santa Anas, a strong foehn-like wind that blows through mountain passes.
Robert Fovell, professor of atmospheric and oceanic sciences at the University of California in Los Angeles describes the Santa Anas: "Actually, the Santa Anas develop when the desert is relatively cold, and are thus most common during the cool season stretching from October through March. High pressure builds over the Great Basin (e.g., Nevada) and the cold air there begins to sink. However, this air is forced downslope which compresses and warms it at a rate of about 10C per kilometer (29F per mile) of descent. As its temperature rises, the relative humidity drops; the air starts out dry and winds up at sea level much drier still. The air picks up speed as it is channeled through passes and canyons.
Santa Anas can cause a great deal of damage. The fast, hot winds cause vegetation to dry out, increasing the danger of wildfire. Once the fires start, the winds fan the flames and hasten their spread. The winds create turbulence and establish vertical wind shear (in which winds exhibit substantial change in speed and/or direction with height), both posing aviation hazards."
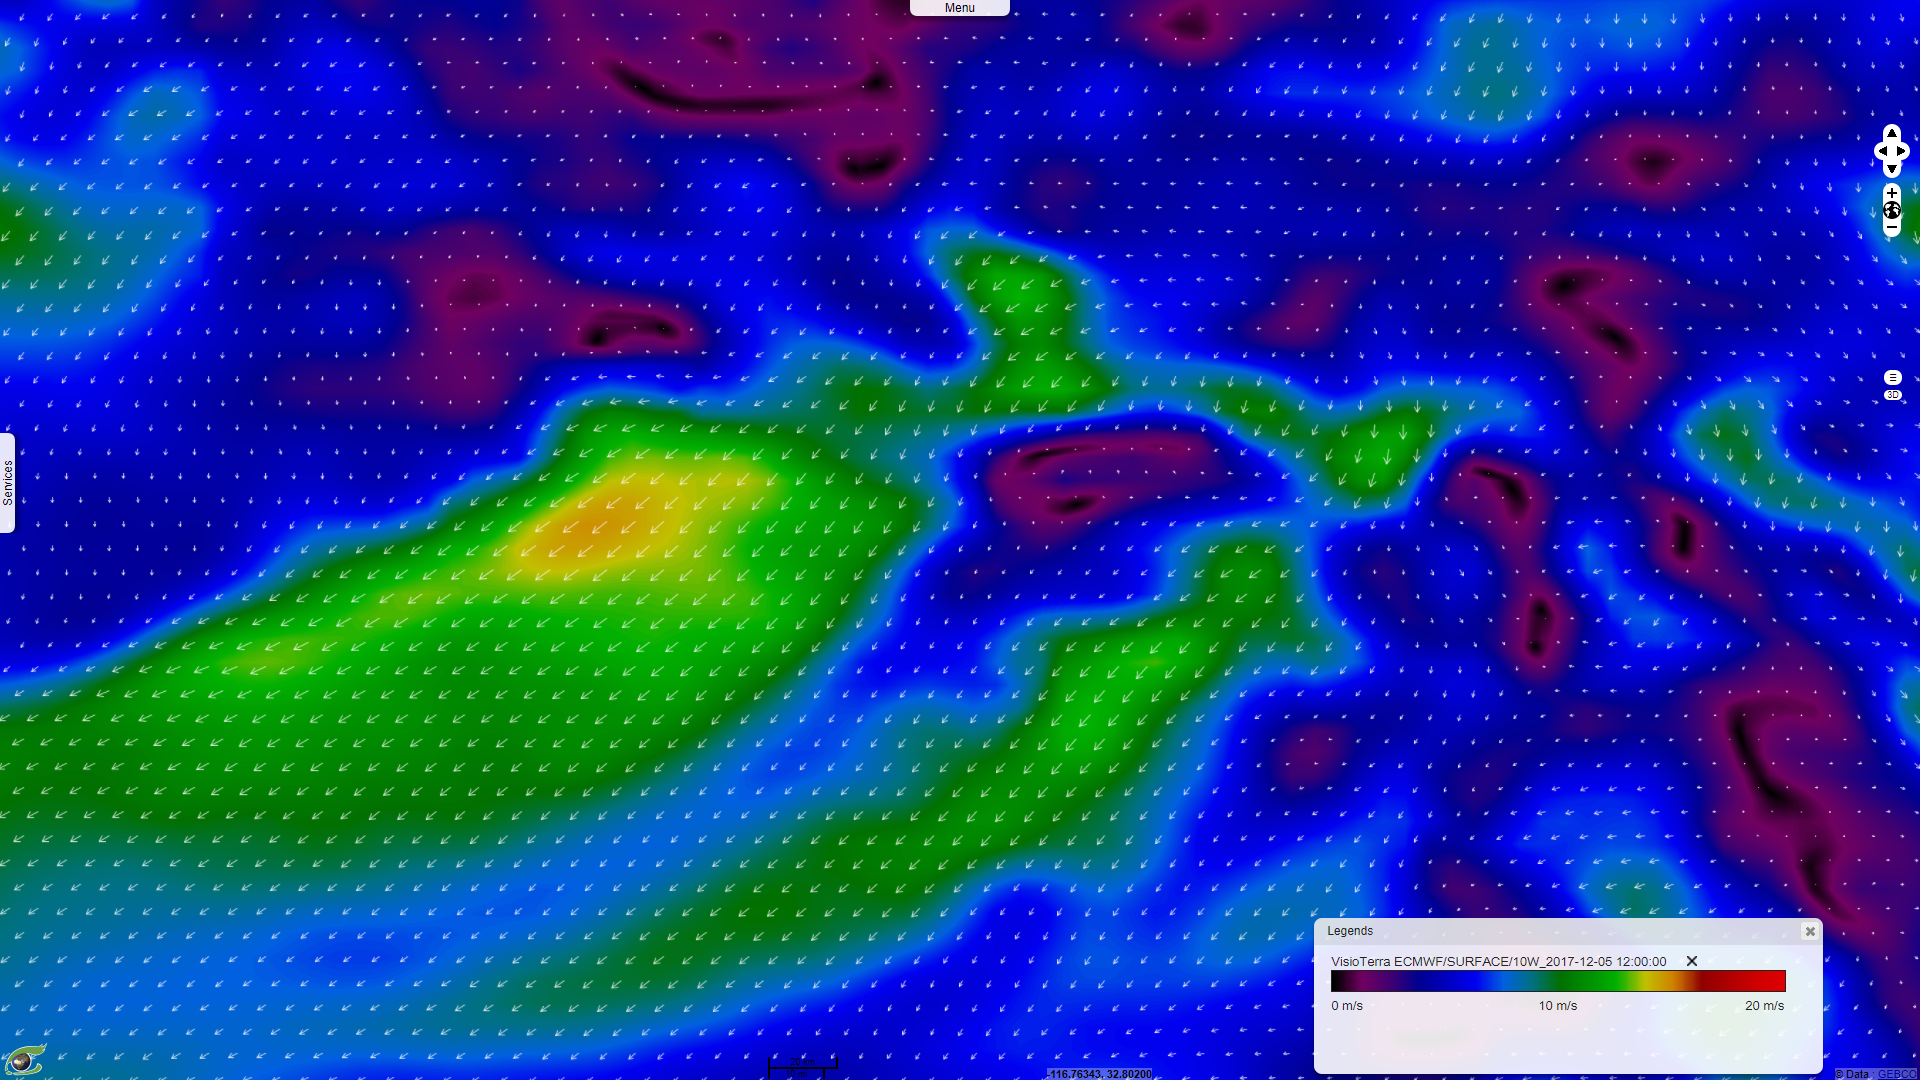
04 to 06.12.2017 mean 6-hourly 10m wind speed by ECMWF animated on animated on VisioTerra's VtWeb.
These conditions make California vulnerable to wildfires, even outside summer. A large number of them happen each year, causing all wild areas to be destroyed and then rejuvenated periodically.
History of previously burnt areas around Santa Barbara since 1991 by CalFire.
In the article "The causes of foehn warming in the lee of mountains", Andrew D. Elvidge And Ian A. Renfrew of the School of Environmental Sciences, University of East Anglia, Norwich, United Kingdom explains:
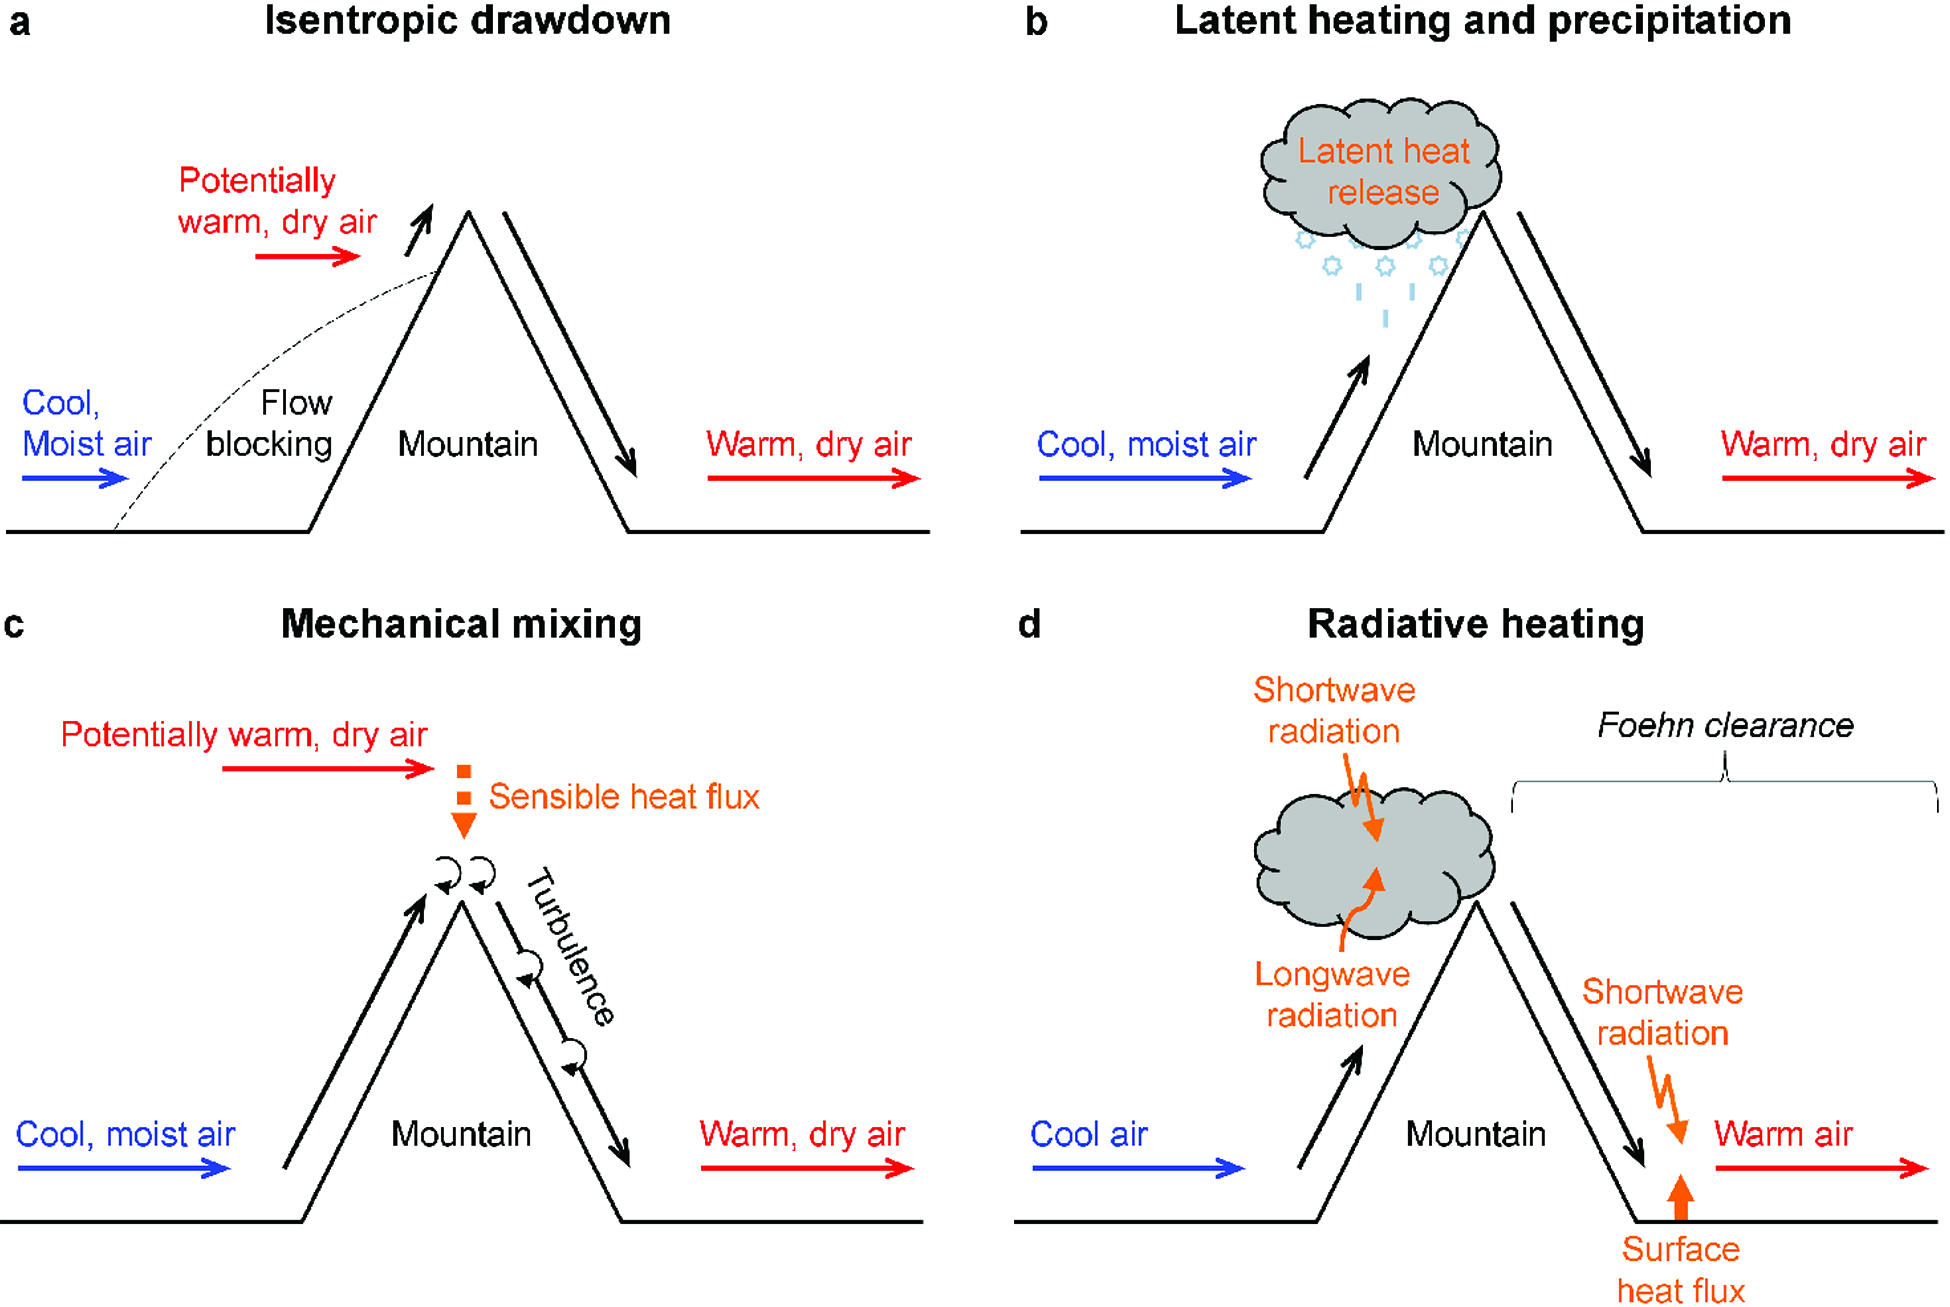
Foehn warming mechanisms
"(a) Upwind of the mountain, cool, moist air can be blocked allowing potentially warmer, drier air to be advected isentropically down the lee slopes. (b) Without flow blocking, there is ascent on the windward slopes so the air cools, leading to condensation and latent heat release that reduces the cooling; precipitation removes the condensed water so that descent on the lee side is dry, which increases the (pressure related) warming leading to higher leeside temperatures. (c) As cool, moist air passes over the mountain, it will mix mechanically with the overlying air mass; for a statically stable atmosphere, this is potentially warmer (and usually drier) and so corresponds to a turbulent flux of sensible heat into the foehn flow (and a turbulent flux of moisture out of it). (d) Associated with the mechanisms described in (a)–(c), there is often clear, dry air on the downwind slopes, the “foehn clearance,” and cloud on the upwind slopes; this situation encourages radiative flux convergence and thus warmer air on the lee side."
"This warming can be spectacular (e.g., 25°C in an hour; Richner and Hächler 2013) and is typically accompanied by a decrease in humidity and accelerated downslope winds."
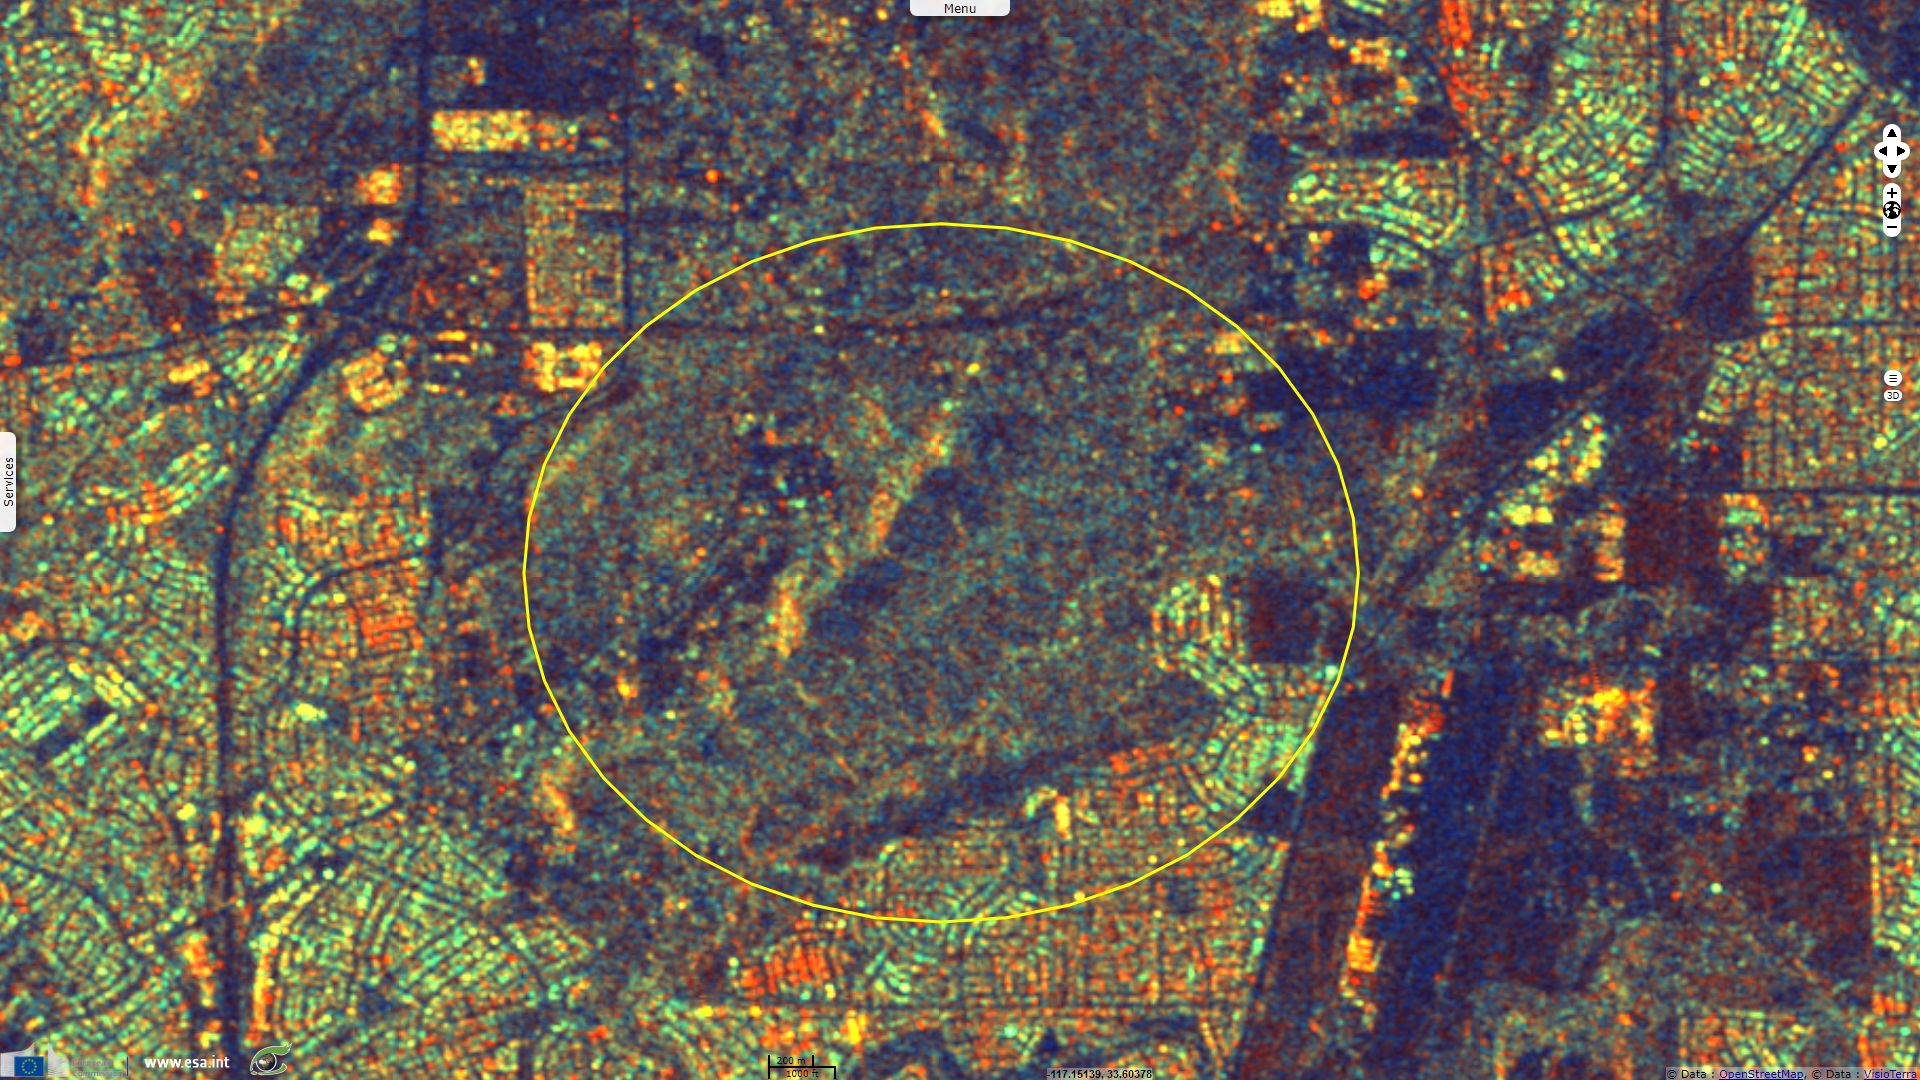
Radar images allow accessing land cover change (here due to wildfire) even when clouds and smoke are thick.
These images are one of the tools available to help firemen creating situation maps.

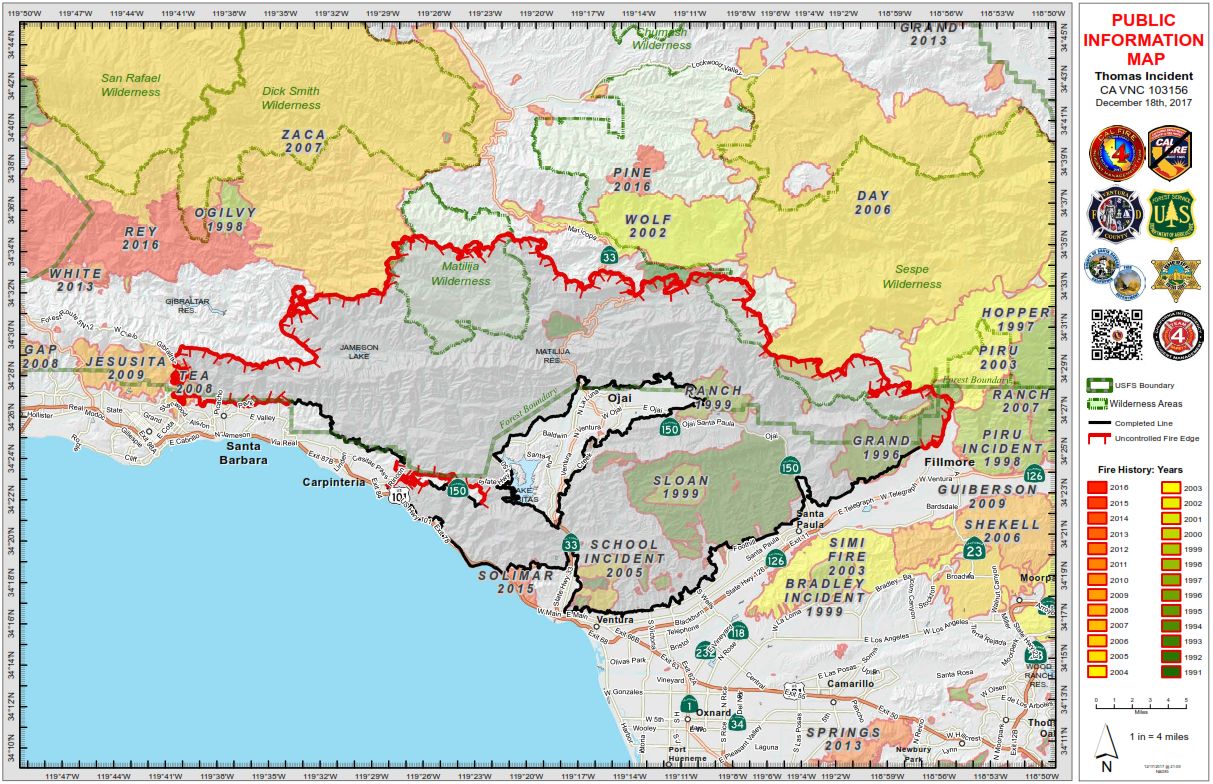
Thomas fire progression map by CalFire
Started the December 4, 2017 6:28 pm, the massive Thomas fire alone destroyed 1101km² as of 20.12.2017 (but only 60% is contained), second only to Cedar Fire in 2003 (1134 km²) in California history. It mobilized up to 8300 fire personnel through the US.
As urban pressure increases, residential quarters are more likely to be built in areas previously thought risky. Over a thousand structures were damaged, and 18000 others are threatened forcing the evacuation of several urban areas. So far, with one firefighter and one civilian killed, Thomas fire toll is however much lighter than the Tubbs Fire last October which had caused 22 deaths and destroyed 5,300 structures.
The views expressed herein can in no way be taken to reflect the official opinion of the European Space Agency or the European Union.
Contains modified Copernicus Sentinel data 2026, processed by VisioTerra.
Contains modified Copernicus Sentinel data 2026, processed by VisioTerra.
| More on European Commission space: |  |
 |
 |
||||
| More on ESA: | |
|
|
S-1 website | S-2 website | S-3 website | |
| More on Copernicus program: | |
|
|
Scihub portal | Cophub portal | Inthub portal | Colhub portal |
| More on VisioTerra: | |
|
|
Sentinel Vision Portal | Envisat+ERS portal | Swarm+GOCE portal | CryoSat portal |