Monitoring oil spills in the EEZ of the Republic of Congo
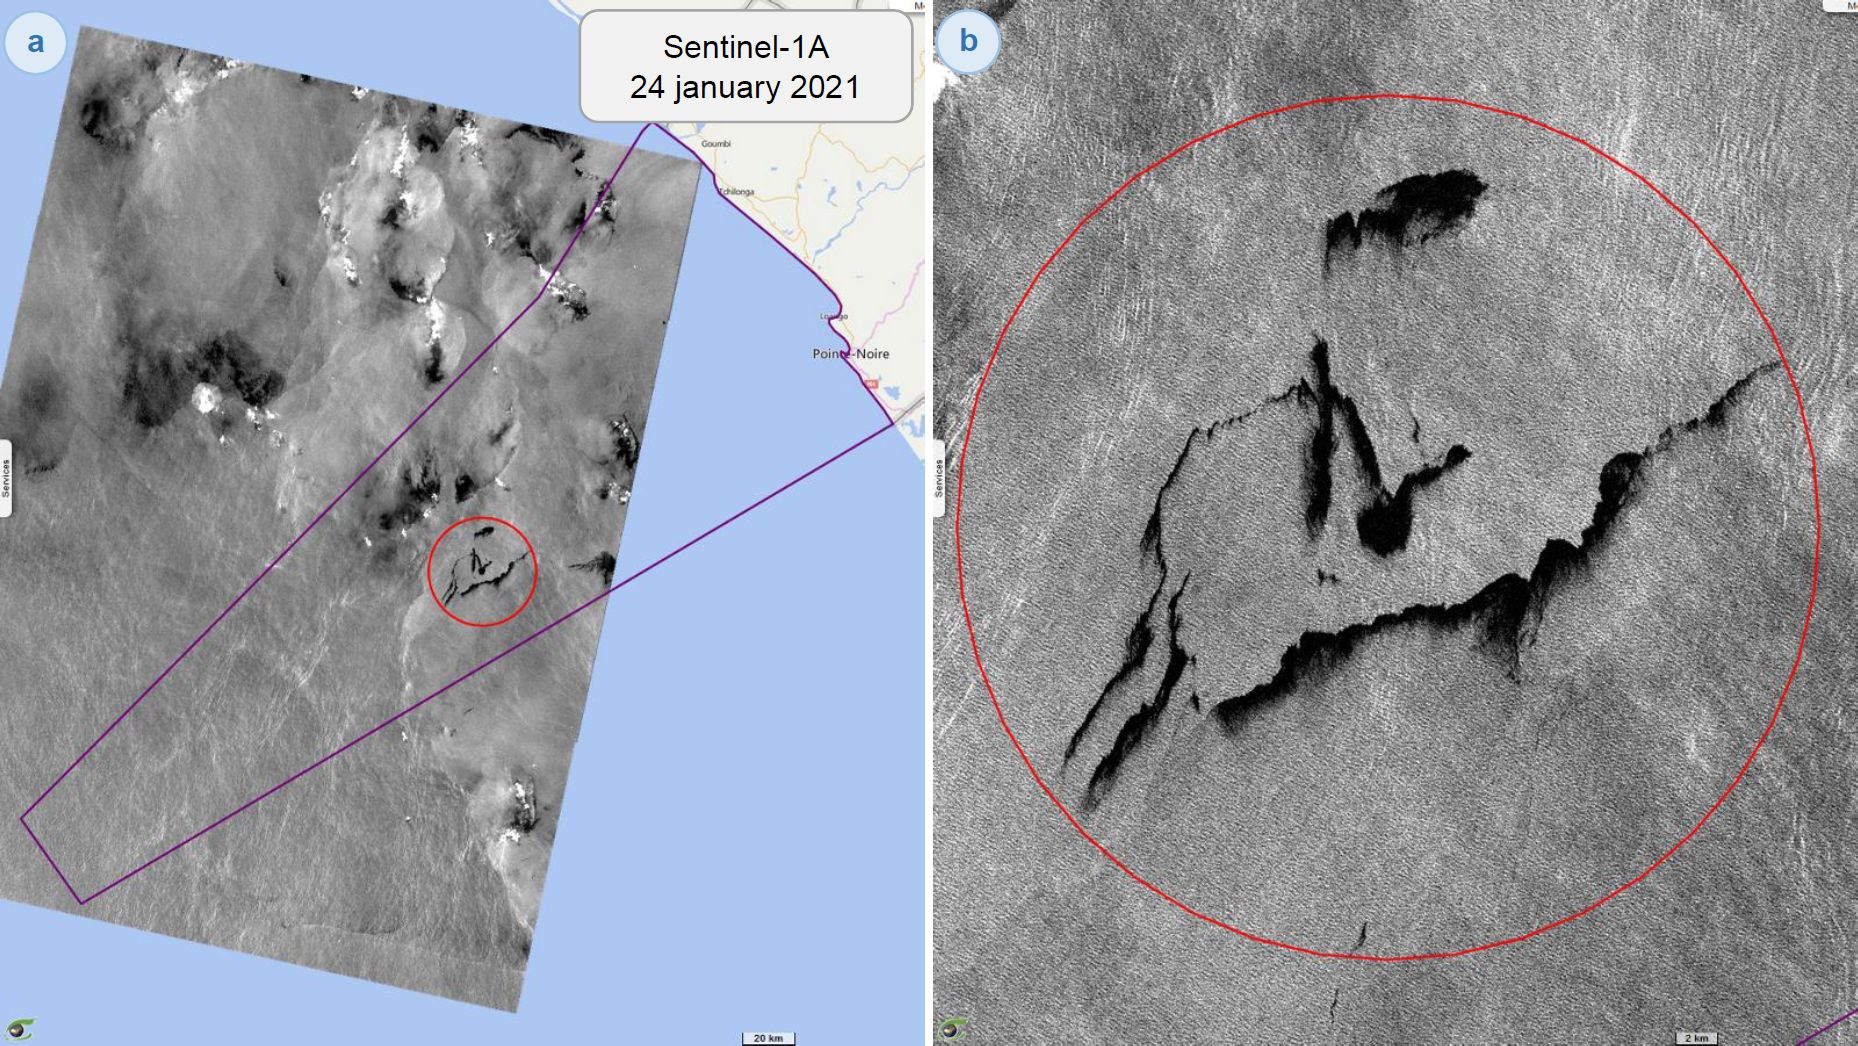
Sentinel-1 CSAR IW acquired on 24 January 2021 at 05:00:06 UTC
Sentinel-1 CSAR IW acquired on 12 February 2021 at 04:51:48 UTC
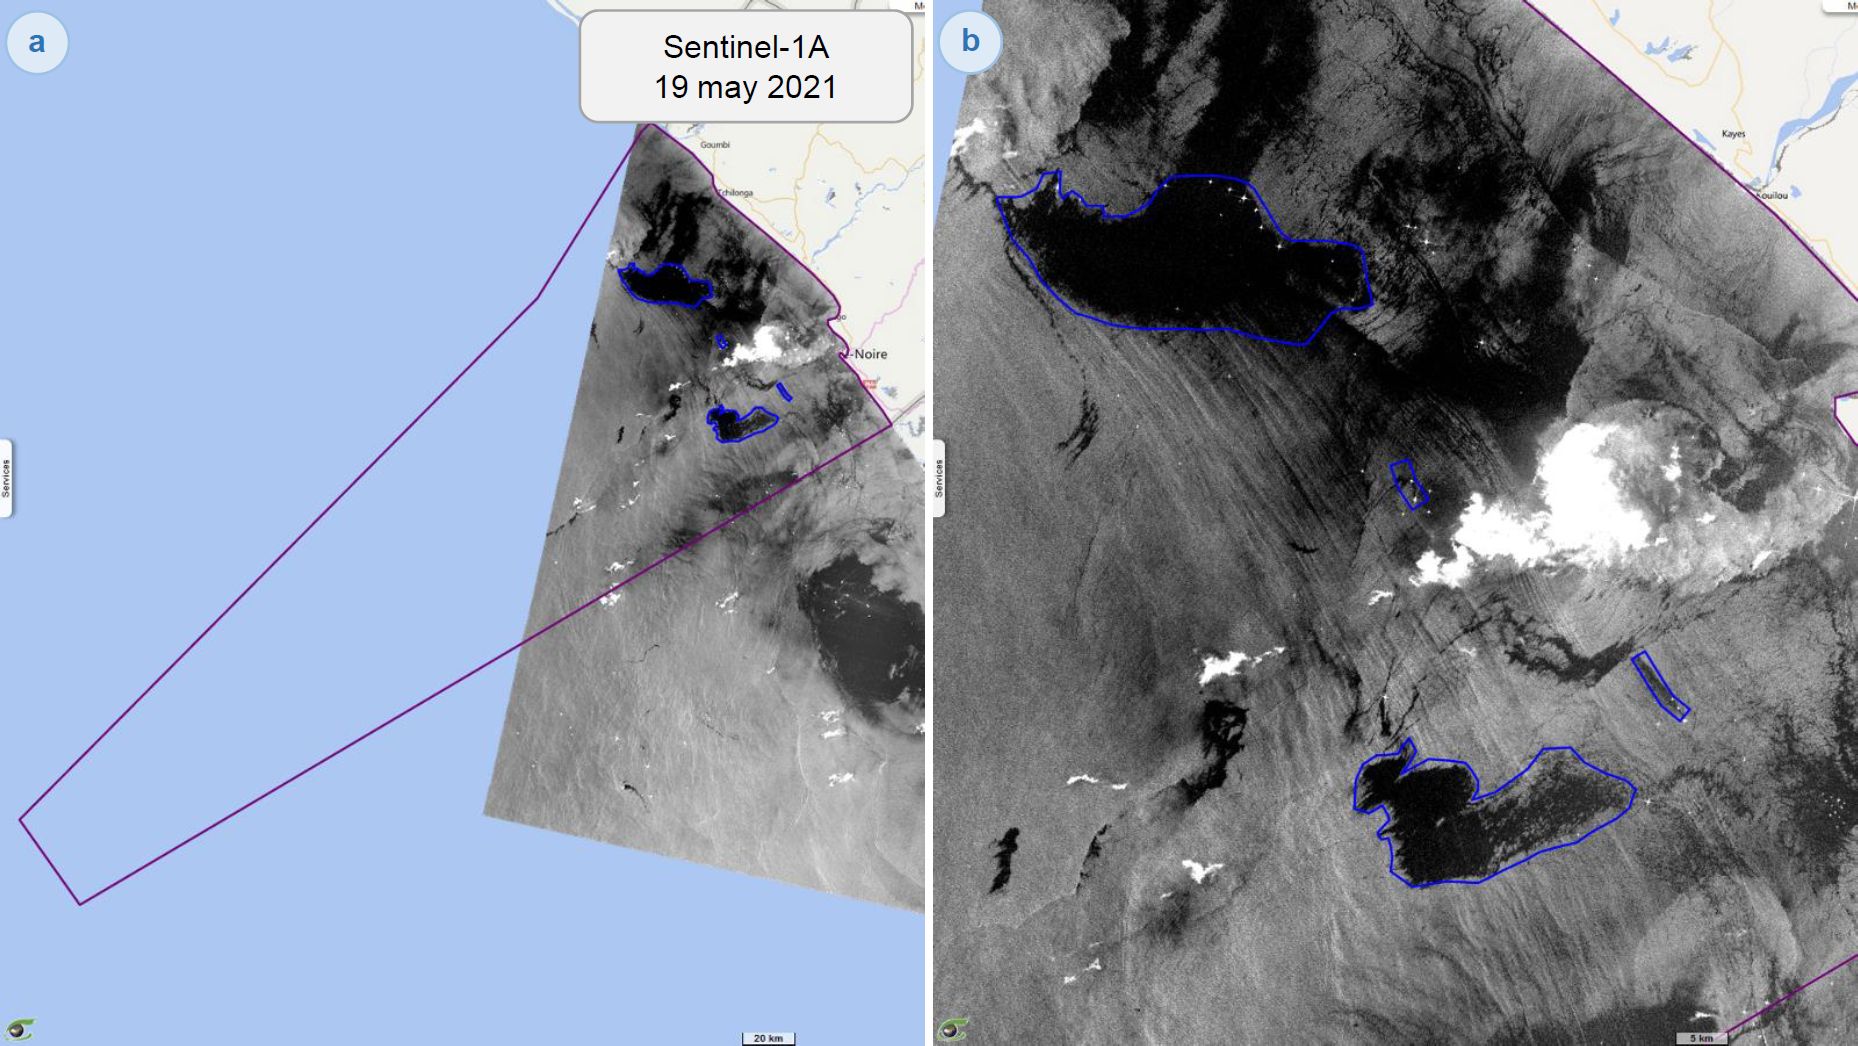
Sentinel-1 CSAR IW acquired on 19 and 31 May 2021 at 04:51:50 UTC
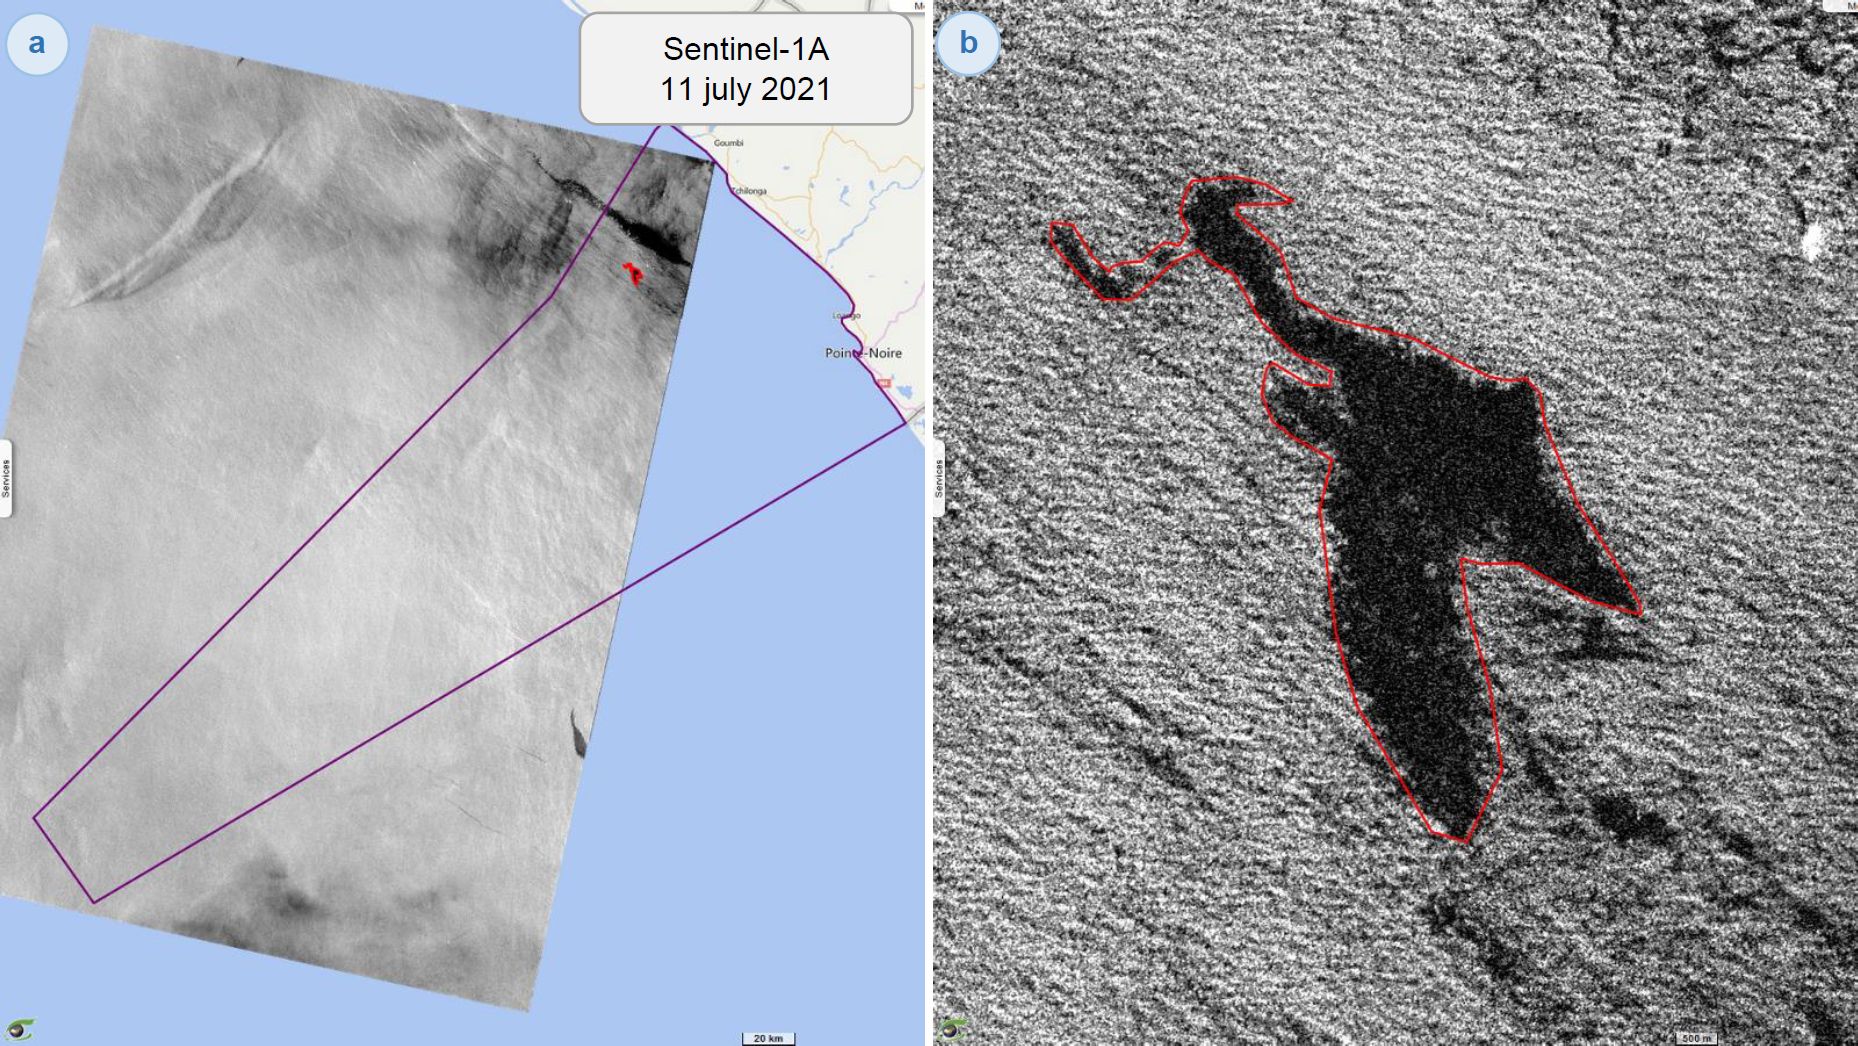
Sentinel-1 CSAR IW acquired on 11 July 2021 at 05:00:11 UTC
Sentinel-1 CSAR IW acquired on 12 February 2021 at 04:51:48 UTC
Sentinel-1 CSAR IW acquired on 19 and 31 May 2021 at 04:51:50 UTC
Sentinel-1 CSAR IW acquired on 11 July 2021 at 05:00:11 UTC
Keyword(s): Oil spill, pollution, marine environment, infrastructure, oil and gas, Republic of Congo, Gulf of Guinea
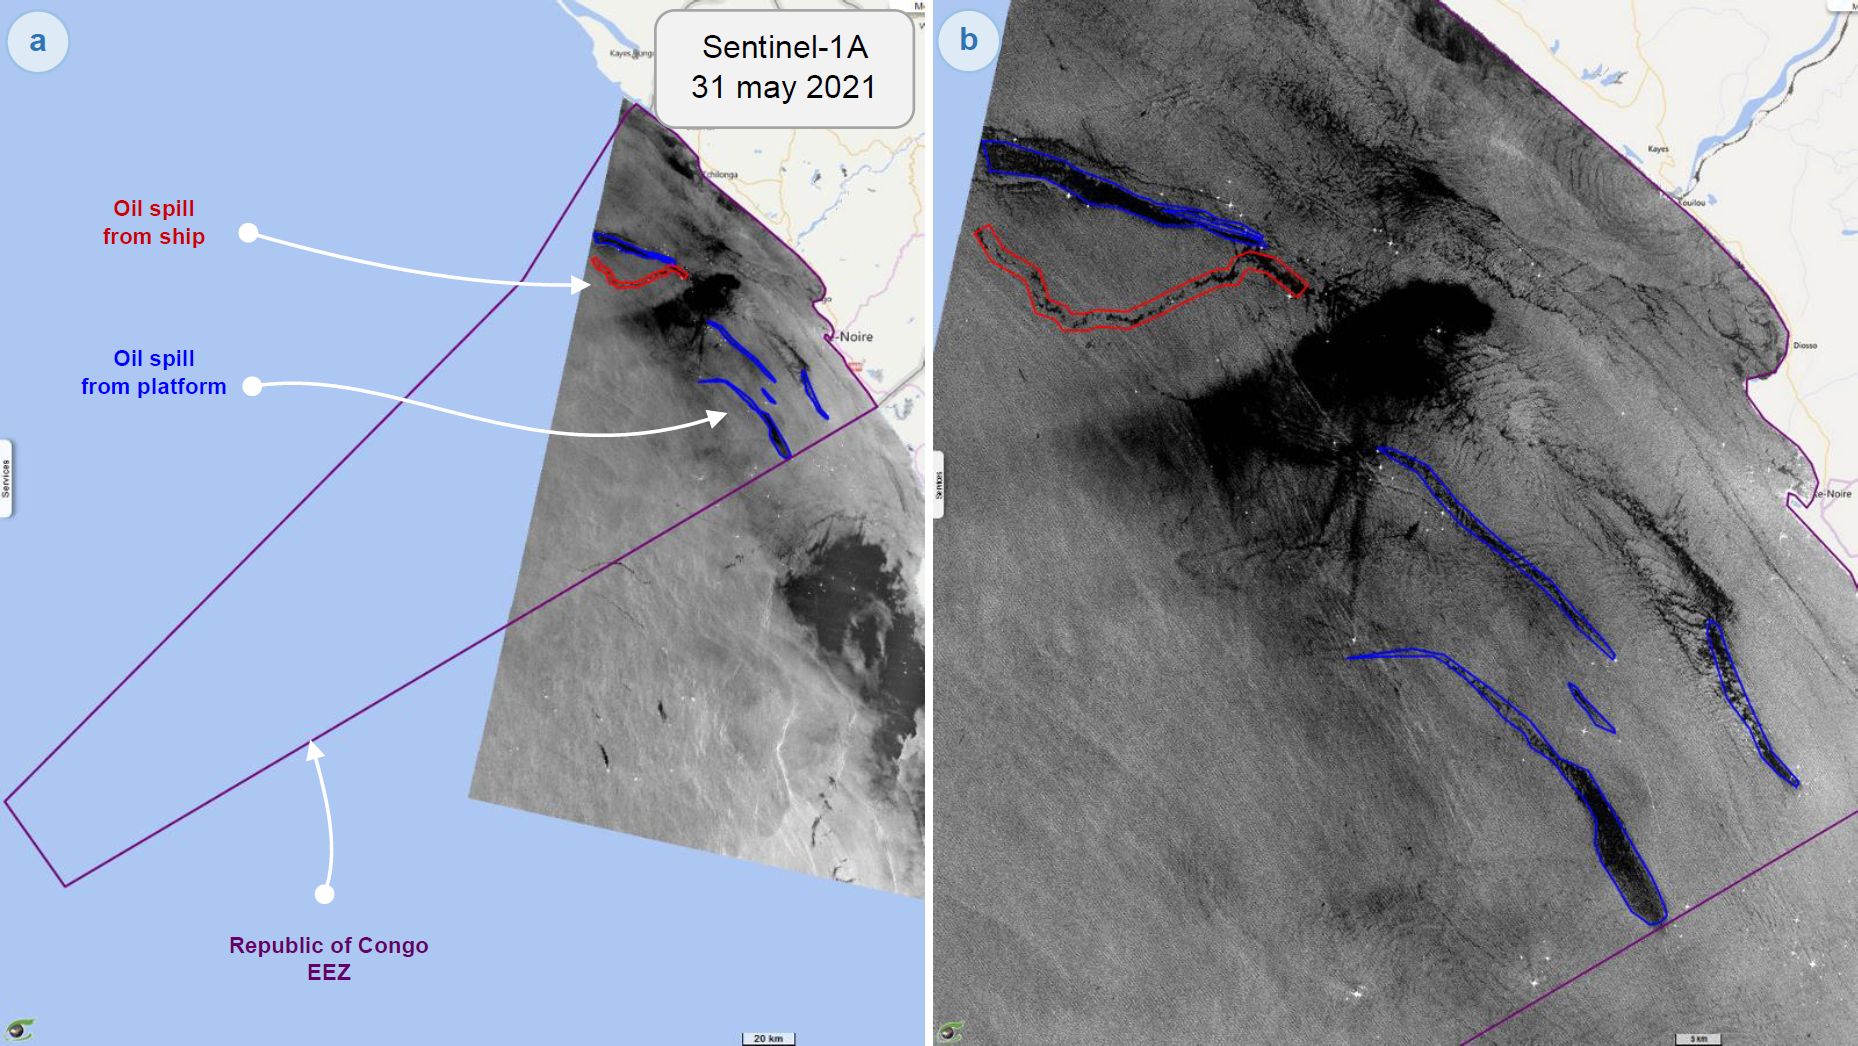
It is possible to distinguish pollution from platforms from that from tankers using radar images. Oil rigs are permanent and therefore appear as bright spots visible on several images.
The figure opposite shows an average of 39 Sentinel-1 images acquired during 2021. The bright spots represent oil platforms
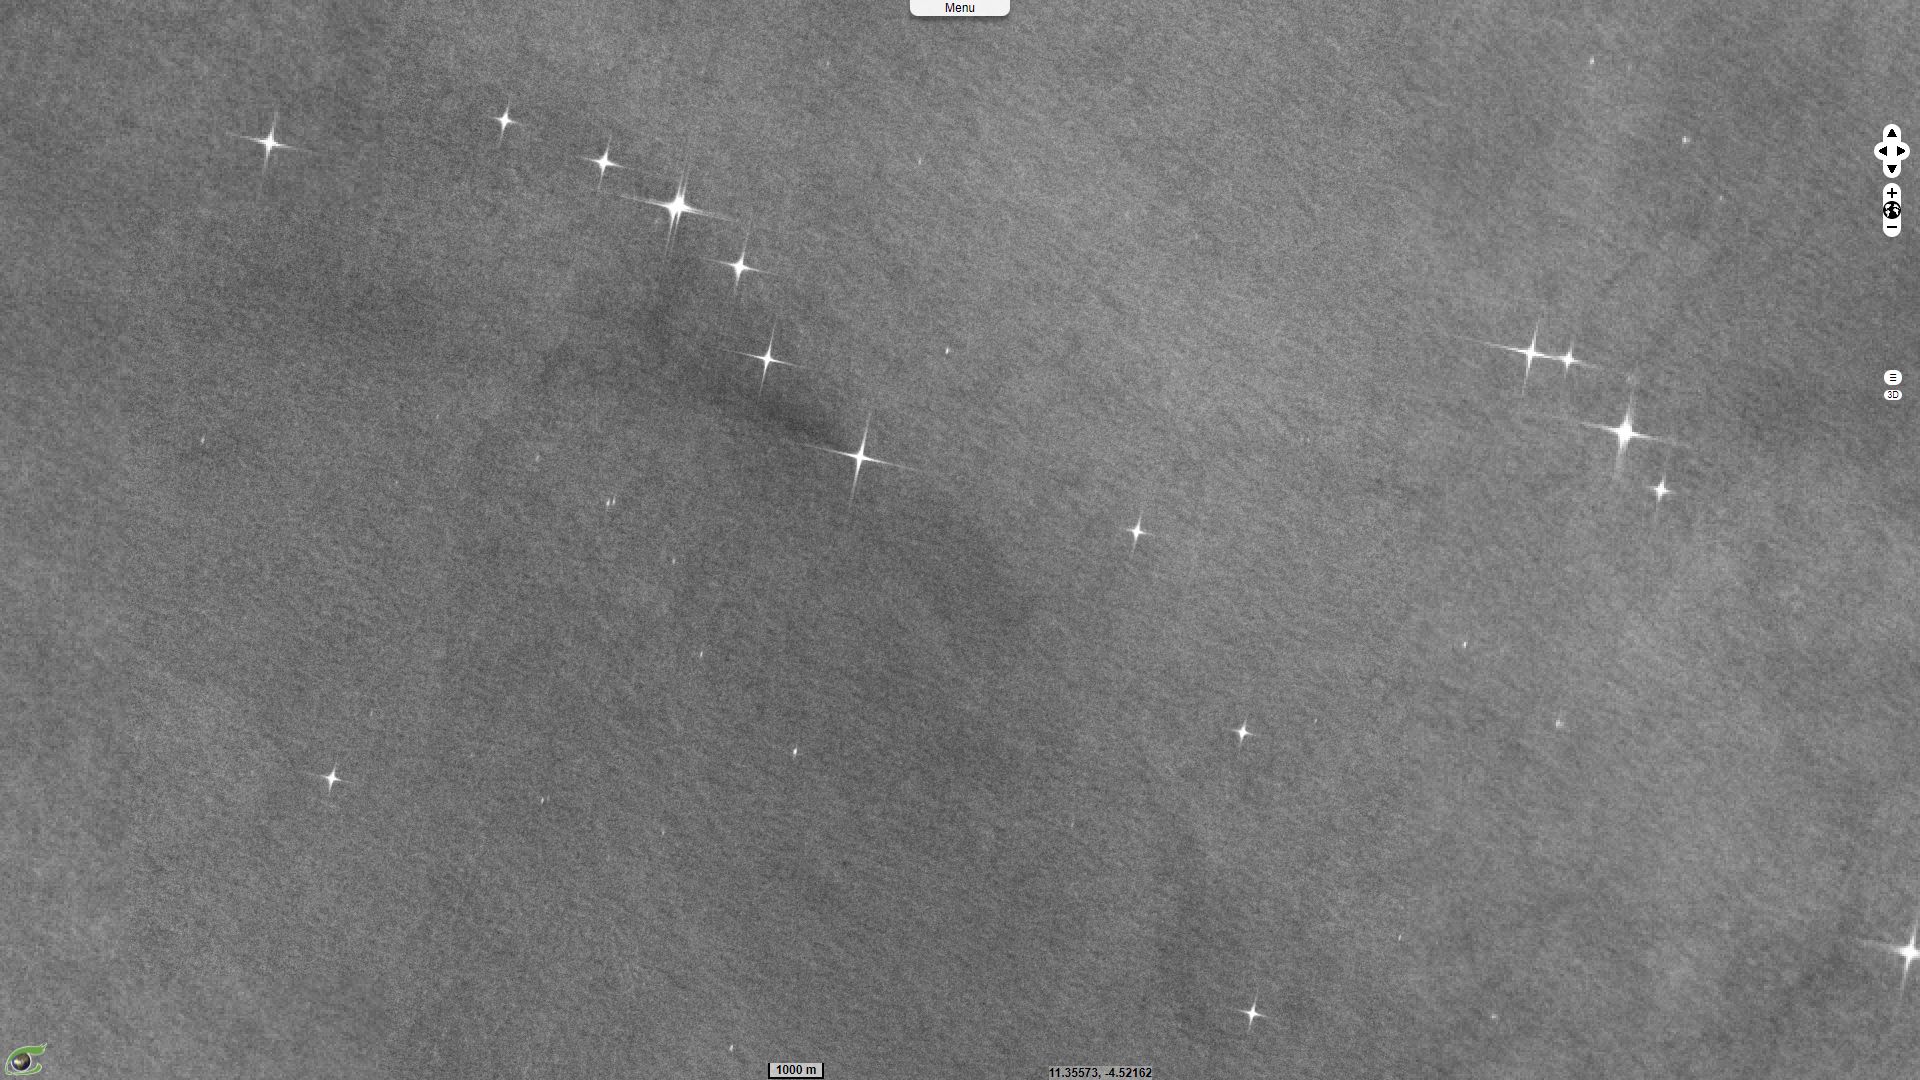
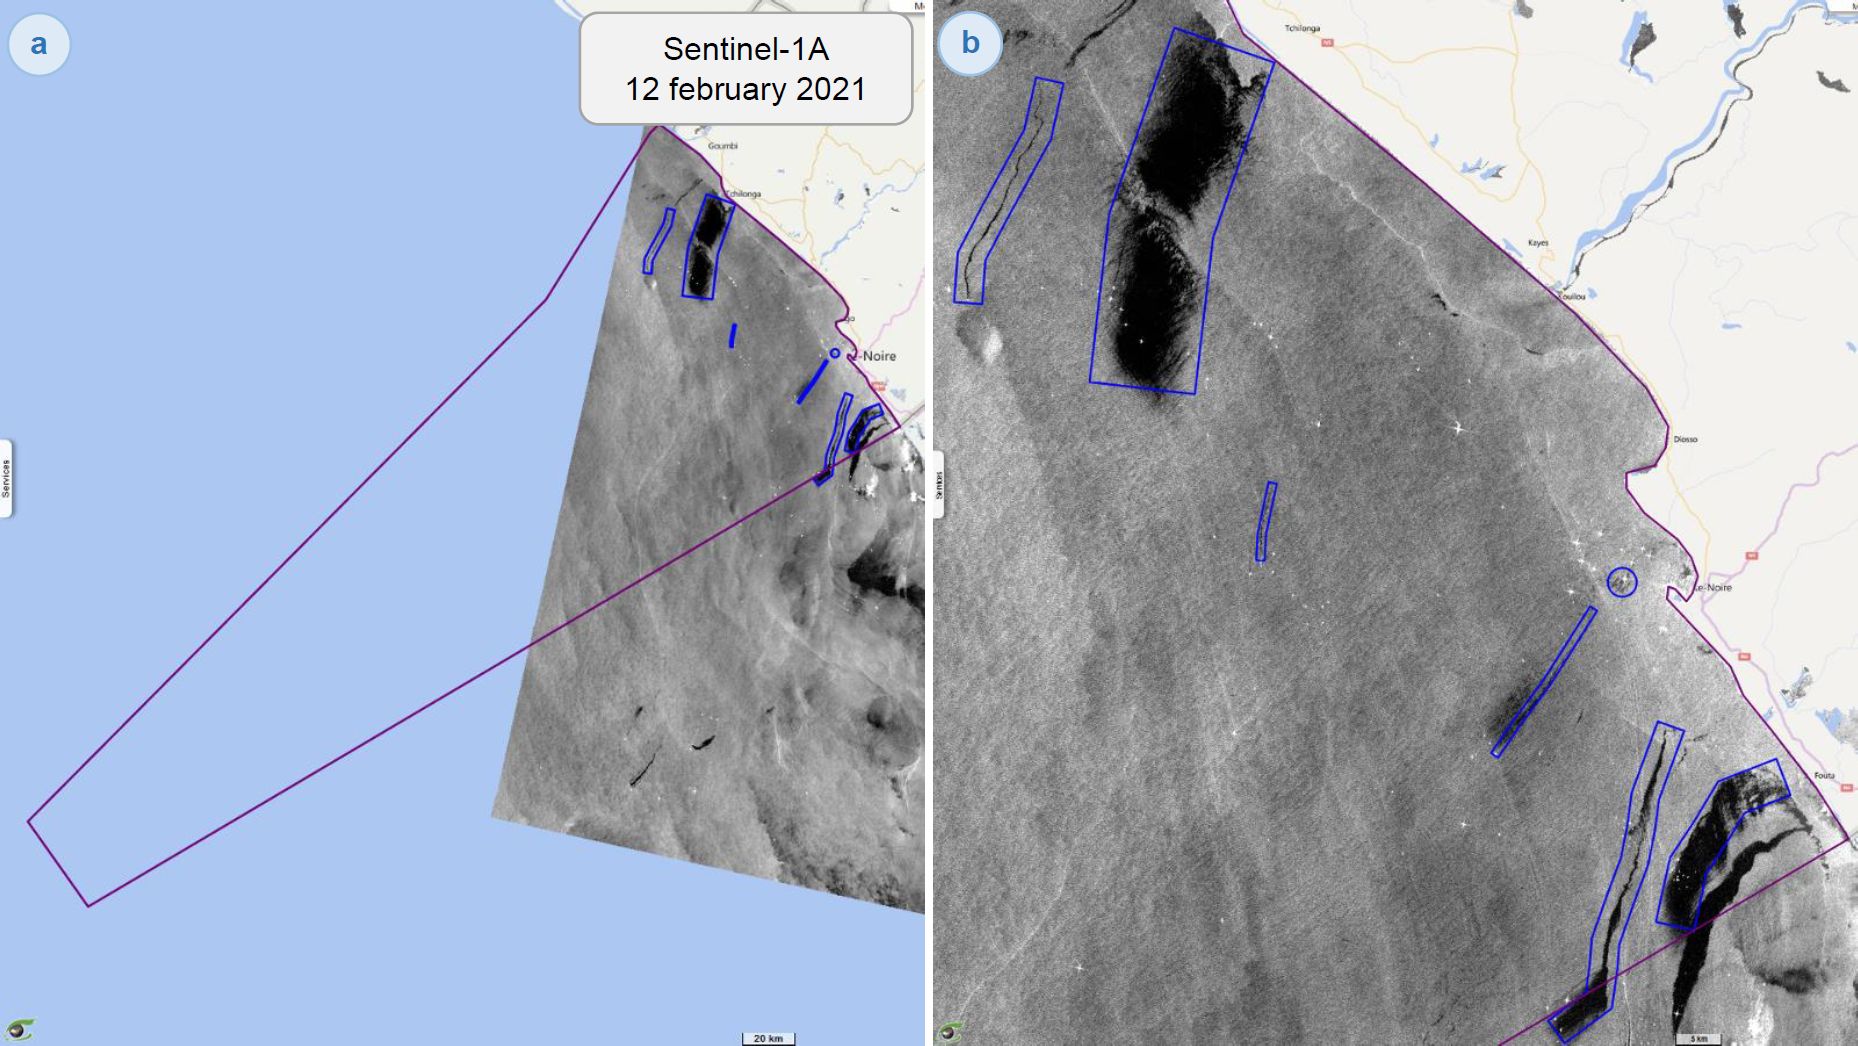
Fig - Map of slicks according to their 3 classes (a) and density of oil slicks from oil platforms (b) detected by the Envisat satellite in the Gulf of Guinea between 2002 and 2012.
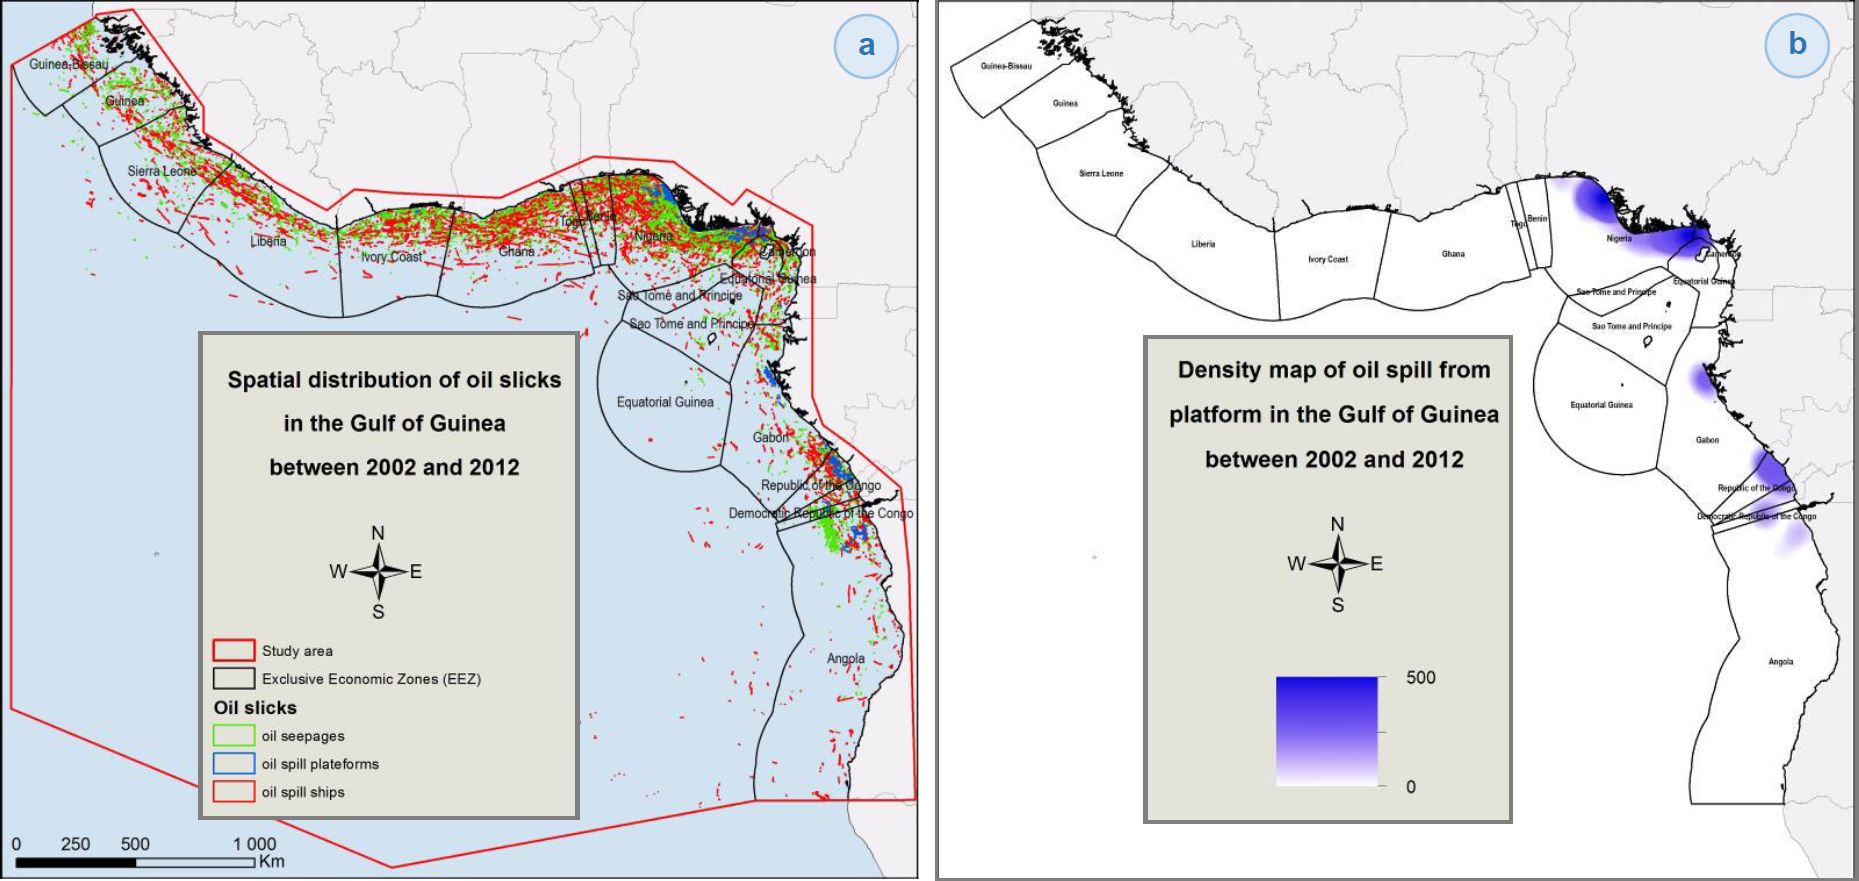
Upper Fig.a shows the spatial distribution of all oil slicks in the Gulf of Guinea. The three types of oil slicks are shown in different colours: green for natural slicks, blue for leaks from oil platforms and red for deballasting from ships. Upper Fig.b shows a density map of oil slicks from oil platforms in the Gulf of Guinea between 2002 and 2012. The frequency of pollution is illustrated by a blue scale. A high density of oil spills from oil rigs can be observed in the EEZ of the Republic of Congo.
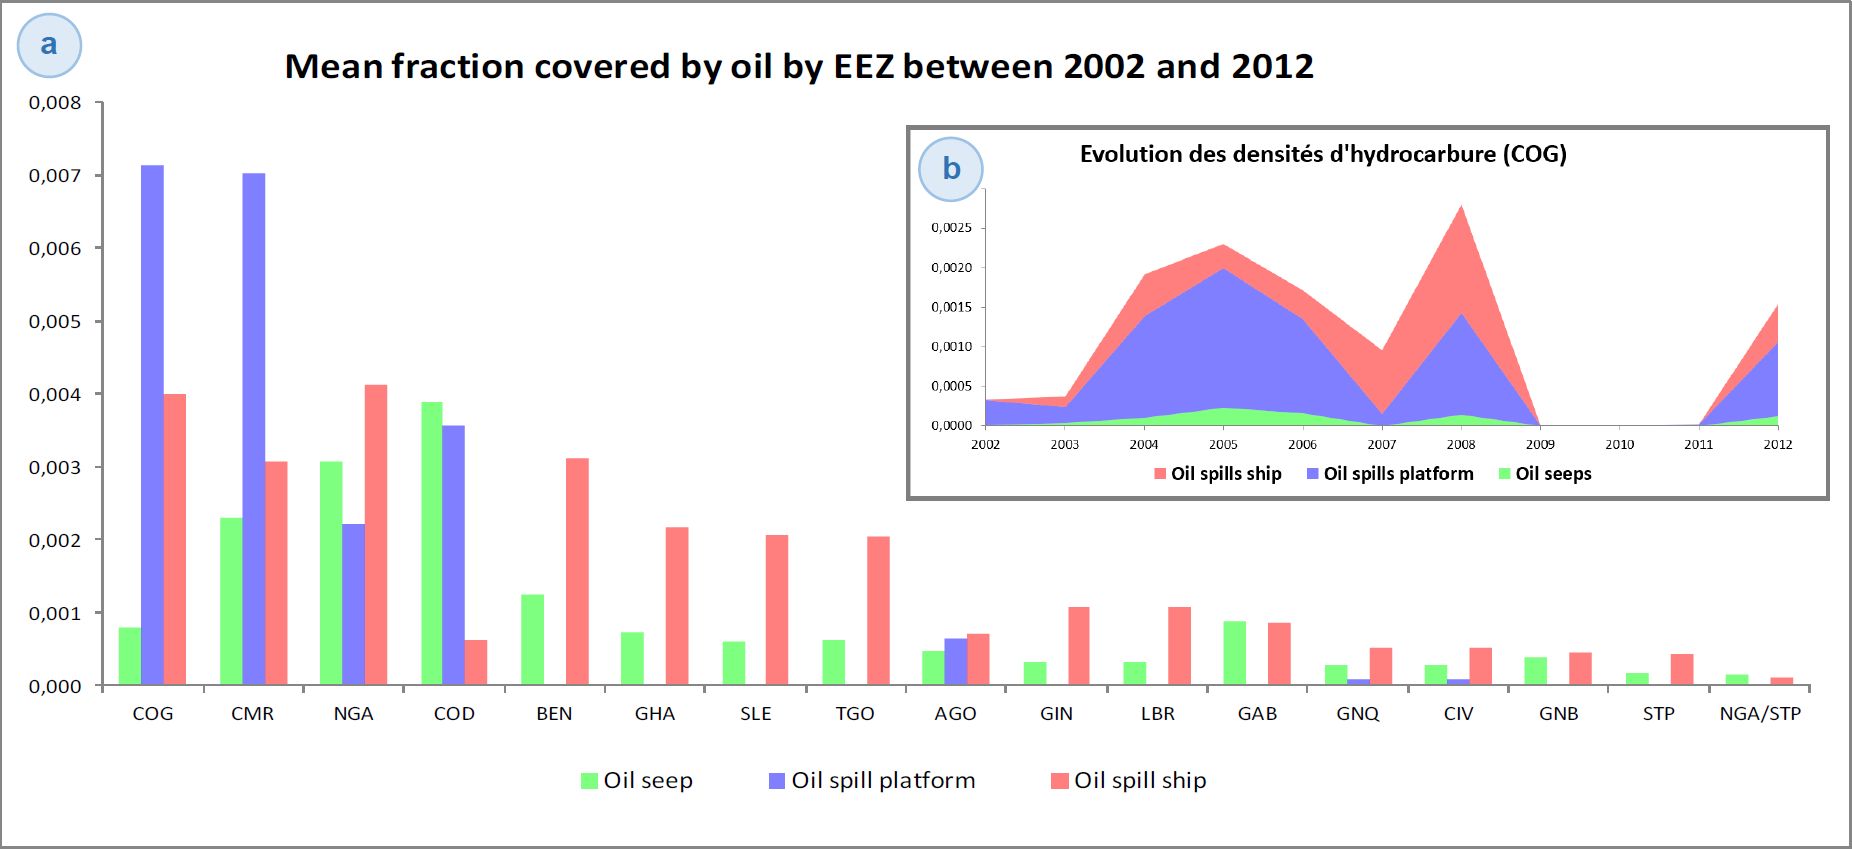
Fig - Average area covered by oil slicks per country's EEZ between 2002 and 2012 (a) and evolution over the years of the density of oil pollution in the Republic of Congo's EEZ alone (COG).
The views expressed herein can in no way be taken to reflect the official opinion of the European Space Agency or the European Union.
Contains modified Copernicus Sentinel data 2026, processed by VisioTerra.
Contains modified Copernicus Sentinel data 2026, processed by VisioTerra.
| More on European Commission space: |  |
 |
 |
||||
| More on ESA: | |
|
|
S-1 website | S-2 website | S-3 website | |
| More on Copernicus program: | |
|
|
Scihub portal | Cophub portal | Inthub portal | Colhub portal |
| More on VisioTerra: | |
|
|
Sentinel Vision Portal | Envisat+ERS portal | Swarm+GOCE portal | CryoSat portal |
Fig - ECMWF surface wind model (a) and CMEMS ocean current model (b) showed through the VtWeb platform. 2D left / 2D right
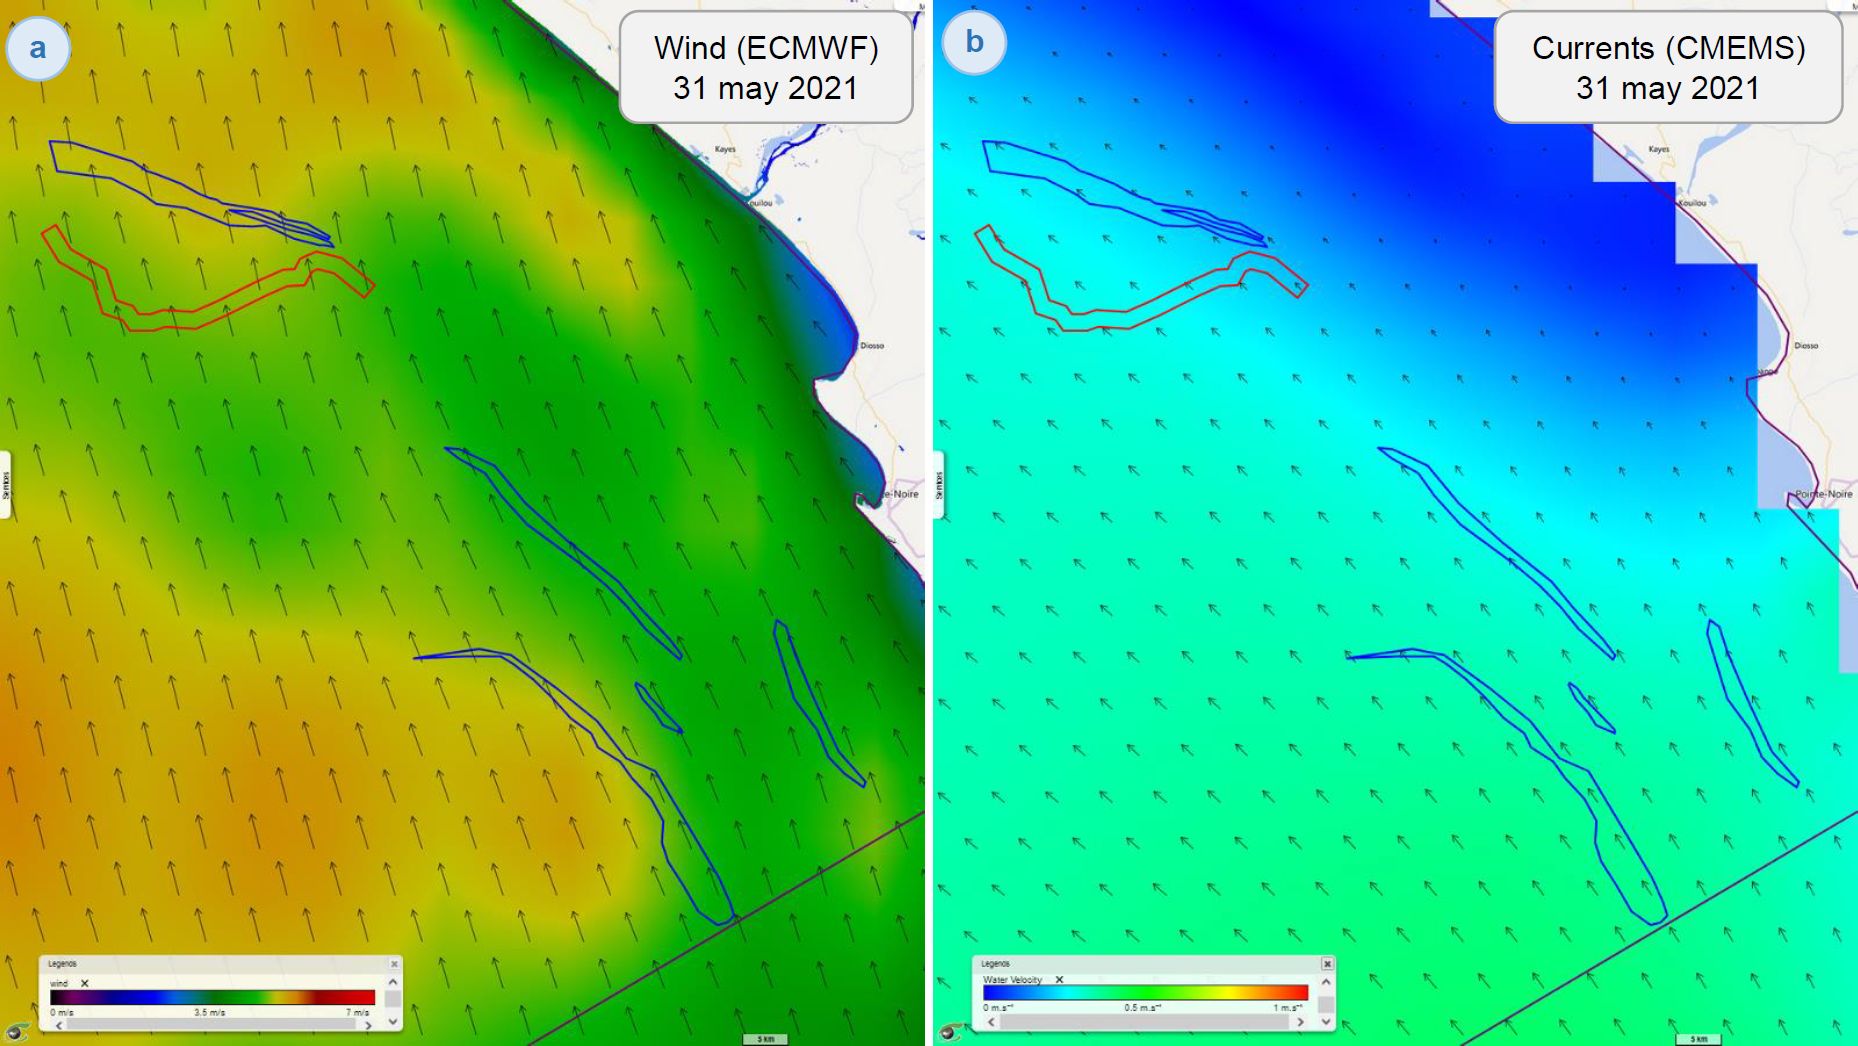
The oil films smooth the sea surface by preventing the backscatter of the signal that would have been caused by the waves. The oil slicks thus appear in black. However, other objects can also appear black when the wind is very weak or other substances such as biogenic oils smooth the water surface.In the images in Fig. 1, two types of oil slick pollution can be seen: slicks from leaking oil platforms (shown in blue) and deballasting slicks released by tankers (shown in red).
The drift of these slicks over time can be analysed and predicted by taking into account wind and ocean current conditions. In Fig. 2a, the wind strength is shown in a colour chart in the range [0; 7 m/s] and arrows indicate the wind direction. Fig. 2b shows the intensity and direction of ocean surface currents. The two measurements combine to drift the slicks to the northwest.