Landslide along RN1 in Kinshasa DRC
Sentinel-1 CSAR IW acquired on 24 November 2022 at 04:35:32 UTC
Sentinel-1 CSAR IW acquired on 06 December 2022 at 04:35:32 UTC
Sentinel-1 CSAR IW acquired on 18 December 2022 at 04:35:31 UTC
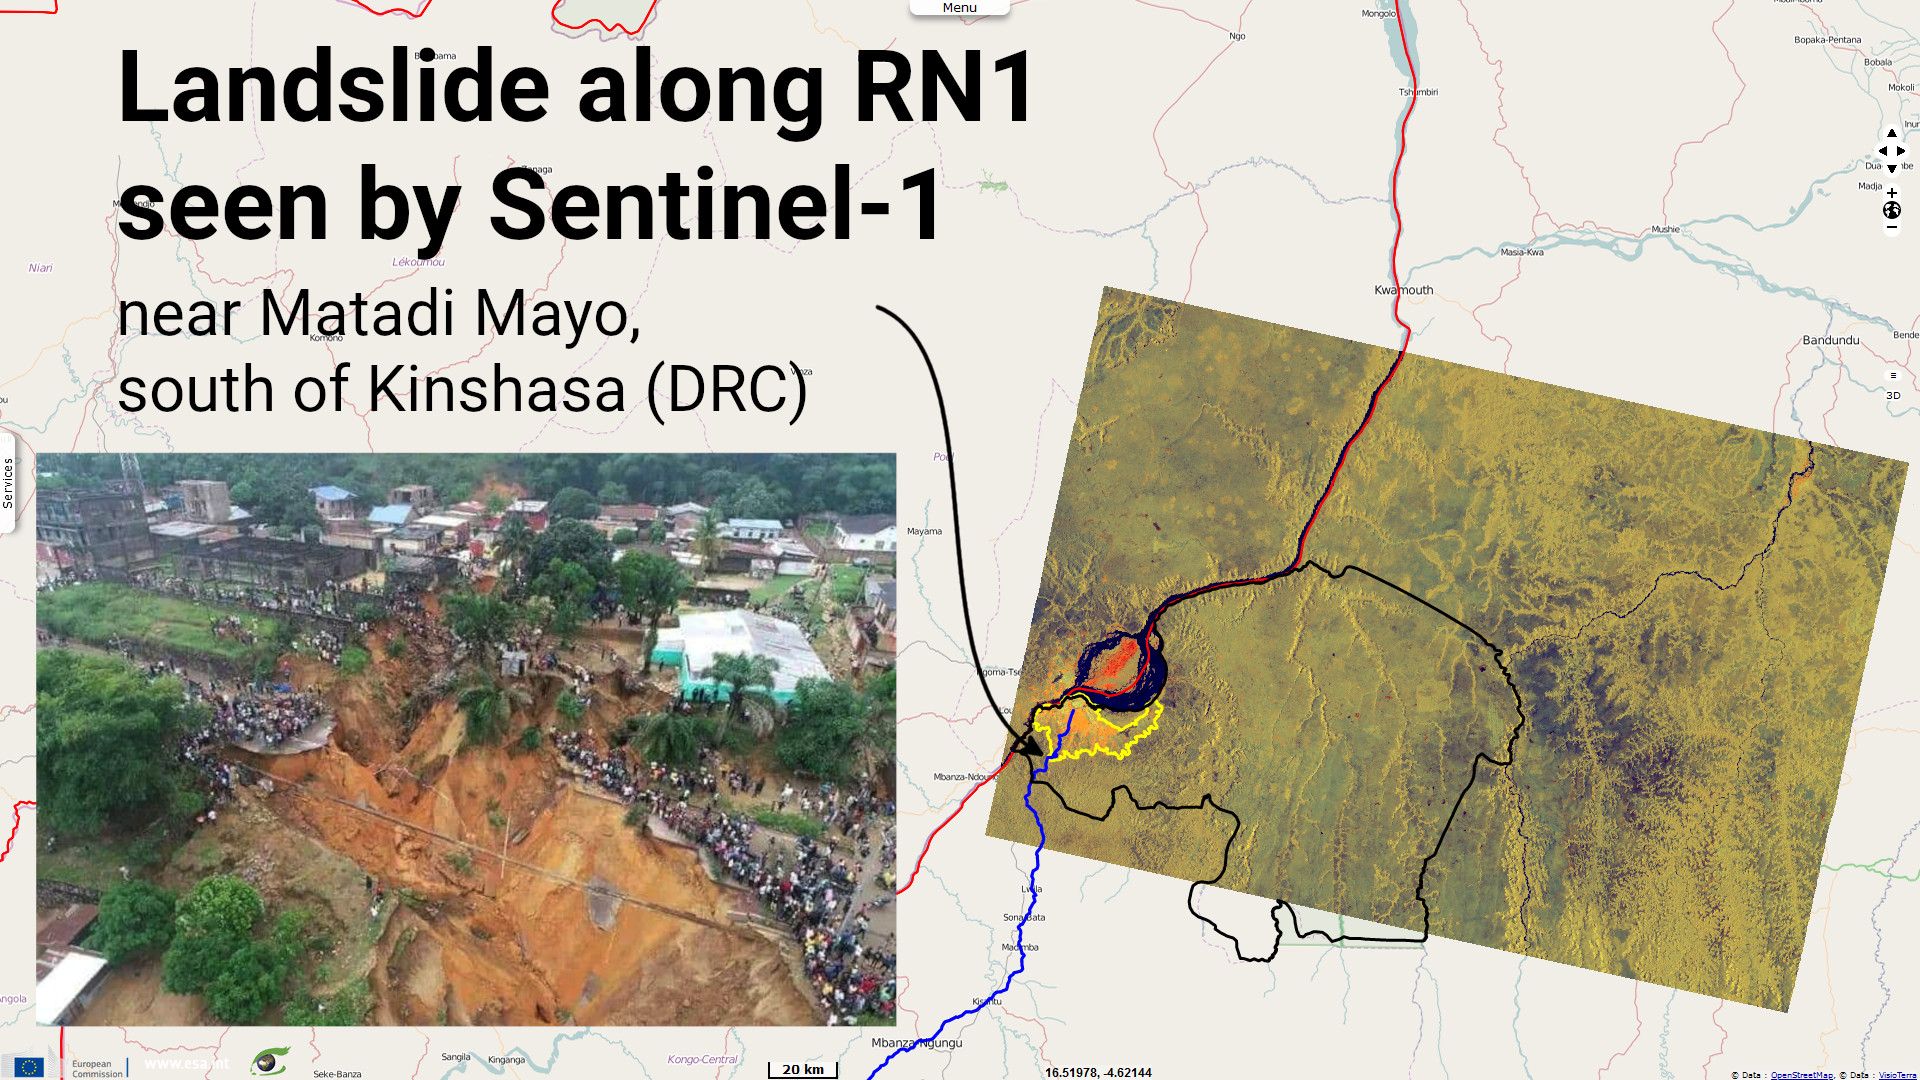
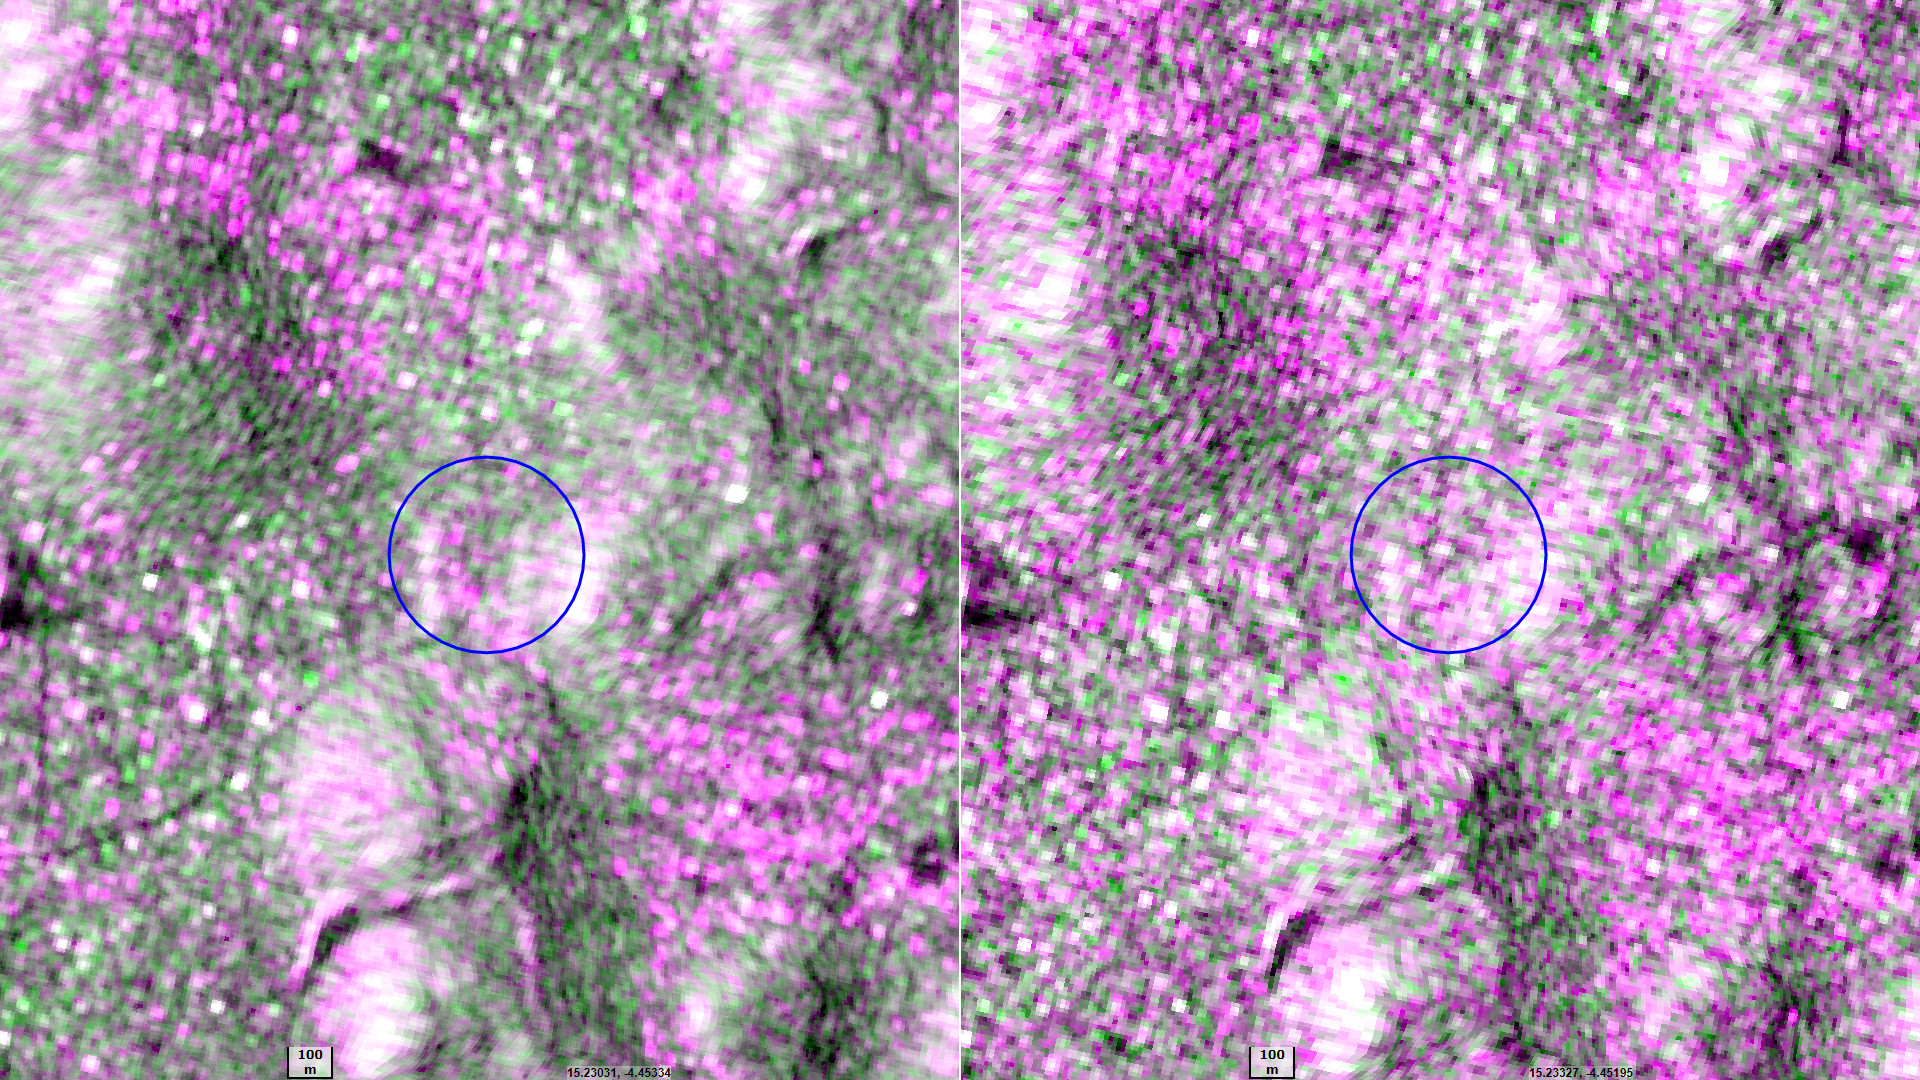
Fig.3 shows the Sentinel-1 radar image before (a) and after (b) the landslide. To decrease the speckle noise, left image is the mean of the three (3) acquisitions just before the landslide; i.e. on 12, 24 November and 6 December 2022 (Sentinel-1A has a 12 days revisiting time). Images have been denoised, orthorectified, calibrated and are rendered by using the classical RGB colour composition VV,VH,VV. The white patter appearing at the location of the landslide is clearly visible by alternating the two views (hyperlook “2D_animation”). This highlighting is certainly due to the "spoon" shape of the landslide focusing the backscatter along the direction of the incident beam.
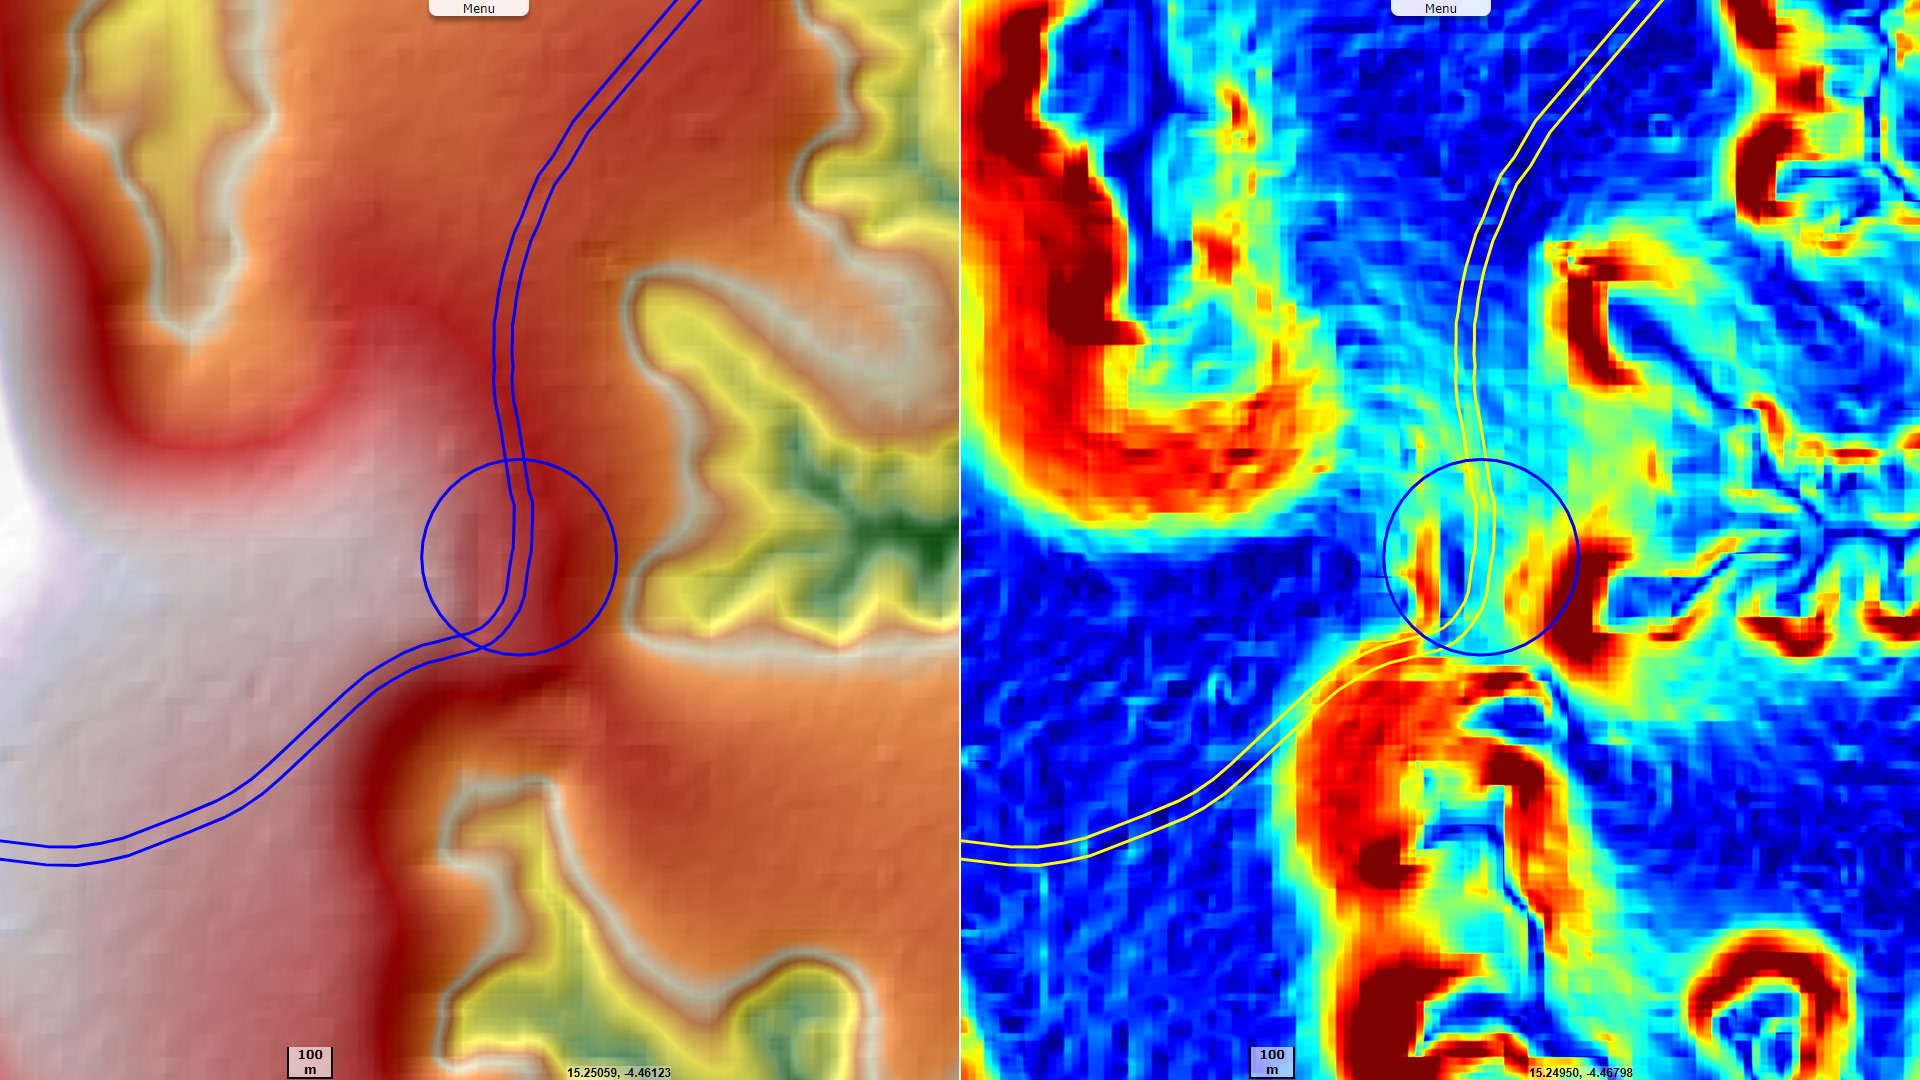
Fig.4 shows the latest version of the Copernicus Digital Elevation Model (DEM). This DEM was produced around 2015, i.e. before the landslide date. Shading (a) shows the earthworks having been performed to the east of the road. The ravines of the talwegs located on both sides of the RN1 render elevations ranging from 330 m to 570 m in this zone. These relief variations are illustrated by the slope map (b) whose values range from 0% to 50%. We observe that this road is bordered or even crosses areas of steep slopes.
Several organizations provide precipitation data on a global scale. In particular, the "Copernicus Climate Change Service" (C3S) provides "Total Precipitation" (TP) data in the ERA5 collection. Unfortunately, these data have a low spatial resolution (0.25°, or about 25 km at the equator). ERA5 Land data have a better resolution (0.1° or 10 km at the equator) but are only available 3 months after their date of application. To be able to analyse such a recent event at the best spatial resolution available, NASA's "Global Precipitation Measurement Mission" (GPM) data was used. These precipitation data aggregate the measurements made by several satellites, some of which come from other space agencies.
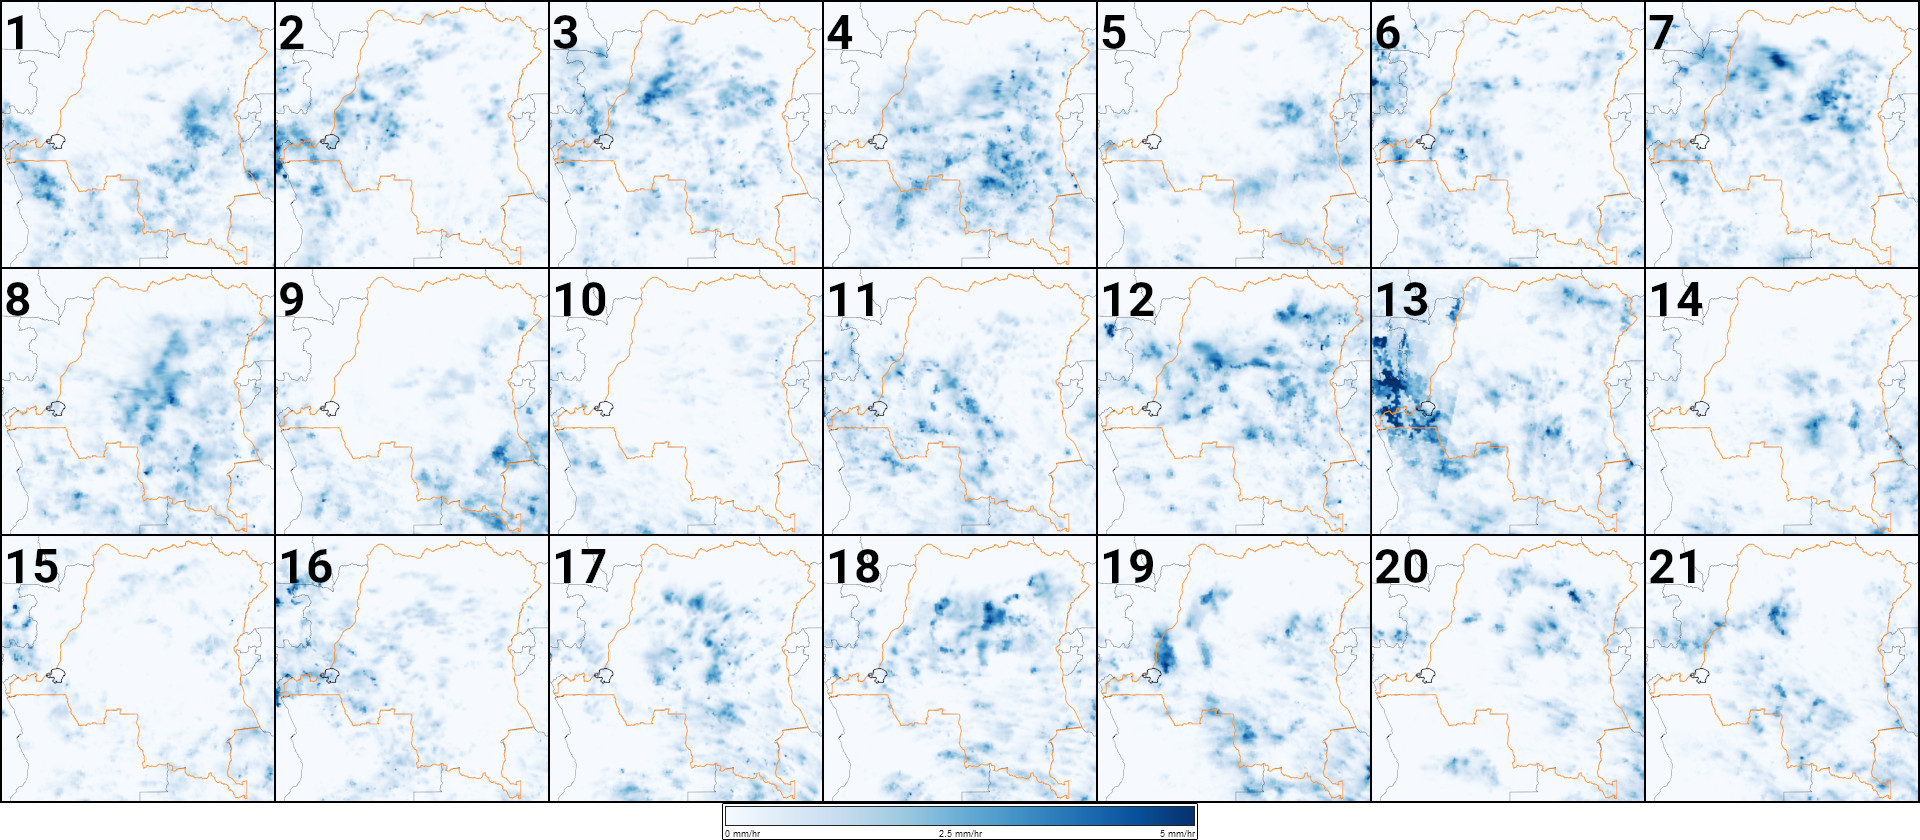
Fig.5 shows the first 21 days of the month of December 2022 by illustrating the average daily flow (expressed in mm/h) according to a blue scale in the interval [0 mm/h;5 mm/h]. The corresponding daily volume is in the interval [0 mm; 120 mm]. The figures show the distribution of precipitations over the whole of the DRC. The “December 13” figure shows a sharp increase in rainfall in the eastern part of the country and over Kinshasa Province in particular.
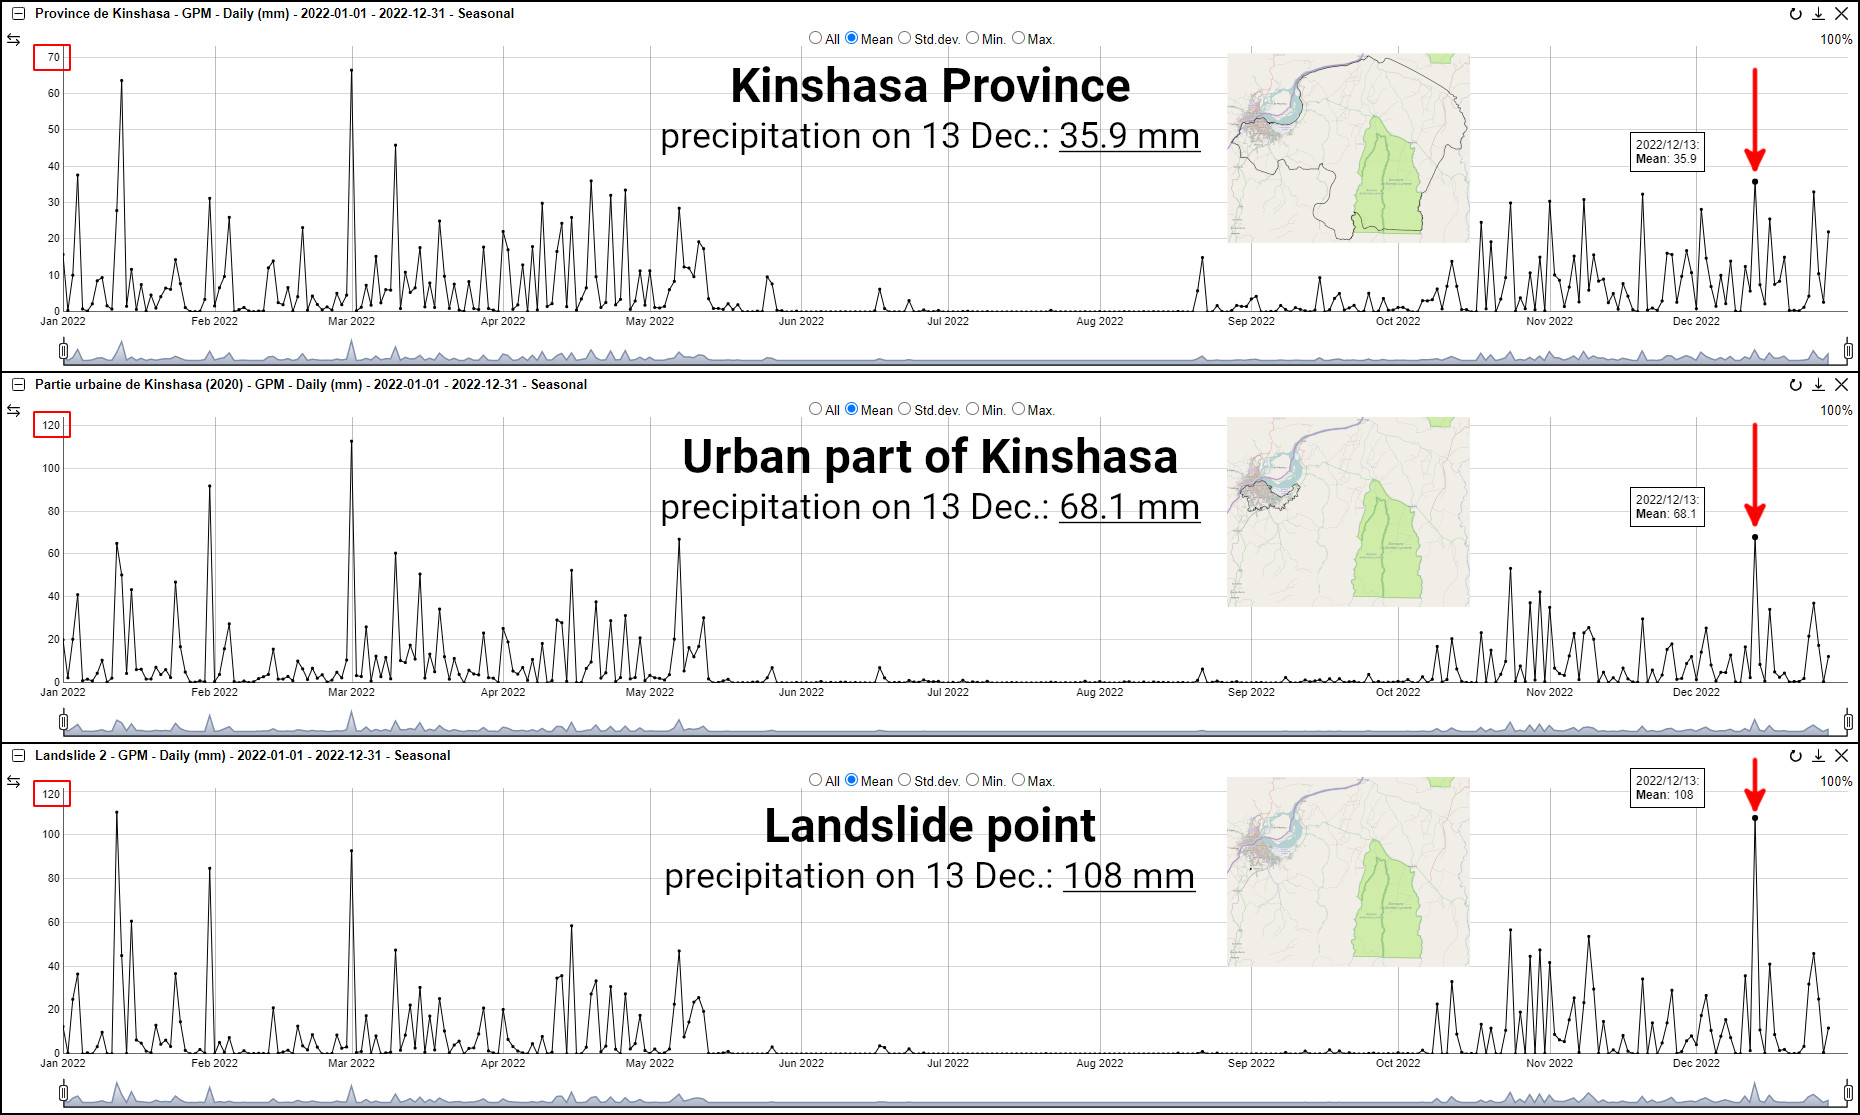
Fig.6 shows the spatial aggregation calculated day by day since January 1, 2022 and over 3 extents: Kinshasa Province, urban part of Kinshasa and at landslide point. On the date of the landslide, December 13, 2022, it can be seen that the rains were particularly concentrated on the landslide point. Similarly, the rains seem more abundant in the urban part of Kinshasa along the river to the west of the province. Note that the scales of the vertical axes are not the same
Contains modified Copernicus Sentinel data 2026, processed by VisioTerra.
| More on European Commission space: |  |
 |
 |
||||
| More on ESA: | |
|
|
S-1 website | S-2 website | S-3 website | |
| More on Copernicus program: | |
|
|
Scihub portal | Cophub portal | Inthub portal | Colhub portal |
| More on VisioTerra: | |
|
|
Sentinel Vision Portal | Envisat+ERS portal | Swarm+GOCE portal | CryoSat portal |
On the night of December 12 to 13, 2022, a large-magnitude landslide caused the collapse of part of the RN1 near the town of Matadi Mayo. This landslide is the consequence of the torrential rains and the instability of the soil traversed by gullies. The place of the incident is located on a pass (saddle point separating two talwegs).
The RN1 is a strategic axis crossing part of the DRC and connecting the capital Kinshasa to the cities of Kongo Central (formerly called Bas-Congo) to the coast. This interruption of road traffic could have dramatic consequences for the 17 million inhabitants of Kinshasa.
Fig.1 shows the Sentinel-1A scene acquired on January 18, 2022, i.e. 6 days after the event, in descending orbit (the scene was observed at 4:35 UTC or 5:35 local time). Sentinel-1 (S1) are radar images enabling to pass through the clouds, which is not the case of optical images. The image has been orthorectified using the Copernicus DEM at 30m, corrected for thermal noise, calibrated in G0 and presented in coloured composition -Red: VV polarization, -Green: VH polarization and -Blue: normalized index of differences between VH and VV. The scene on the left is a drone view after the landslide provided by John VANDERMEERSCH and Baudouin MICHEL of ERAIFT.