Tsunami in Sunda strait between Java and Sumatra
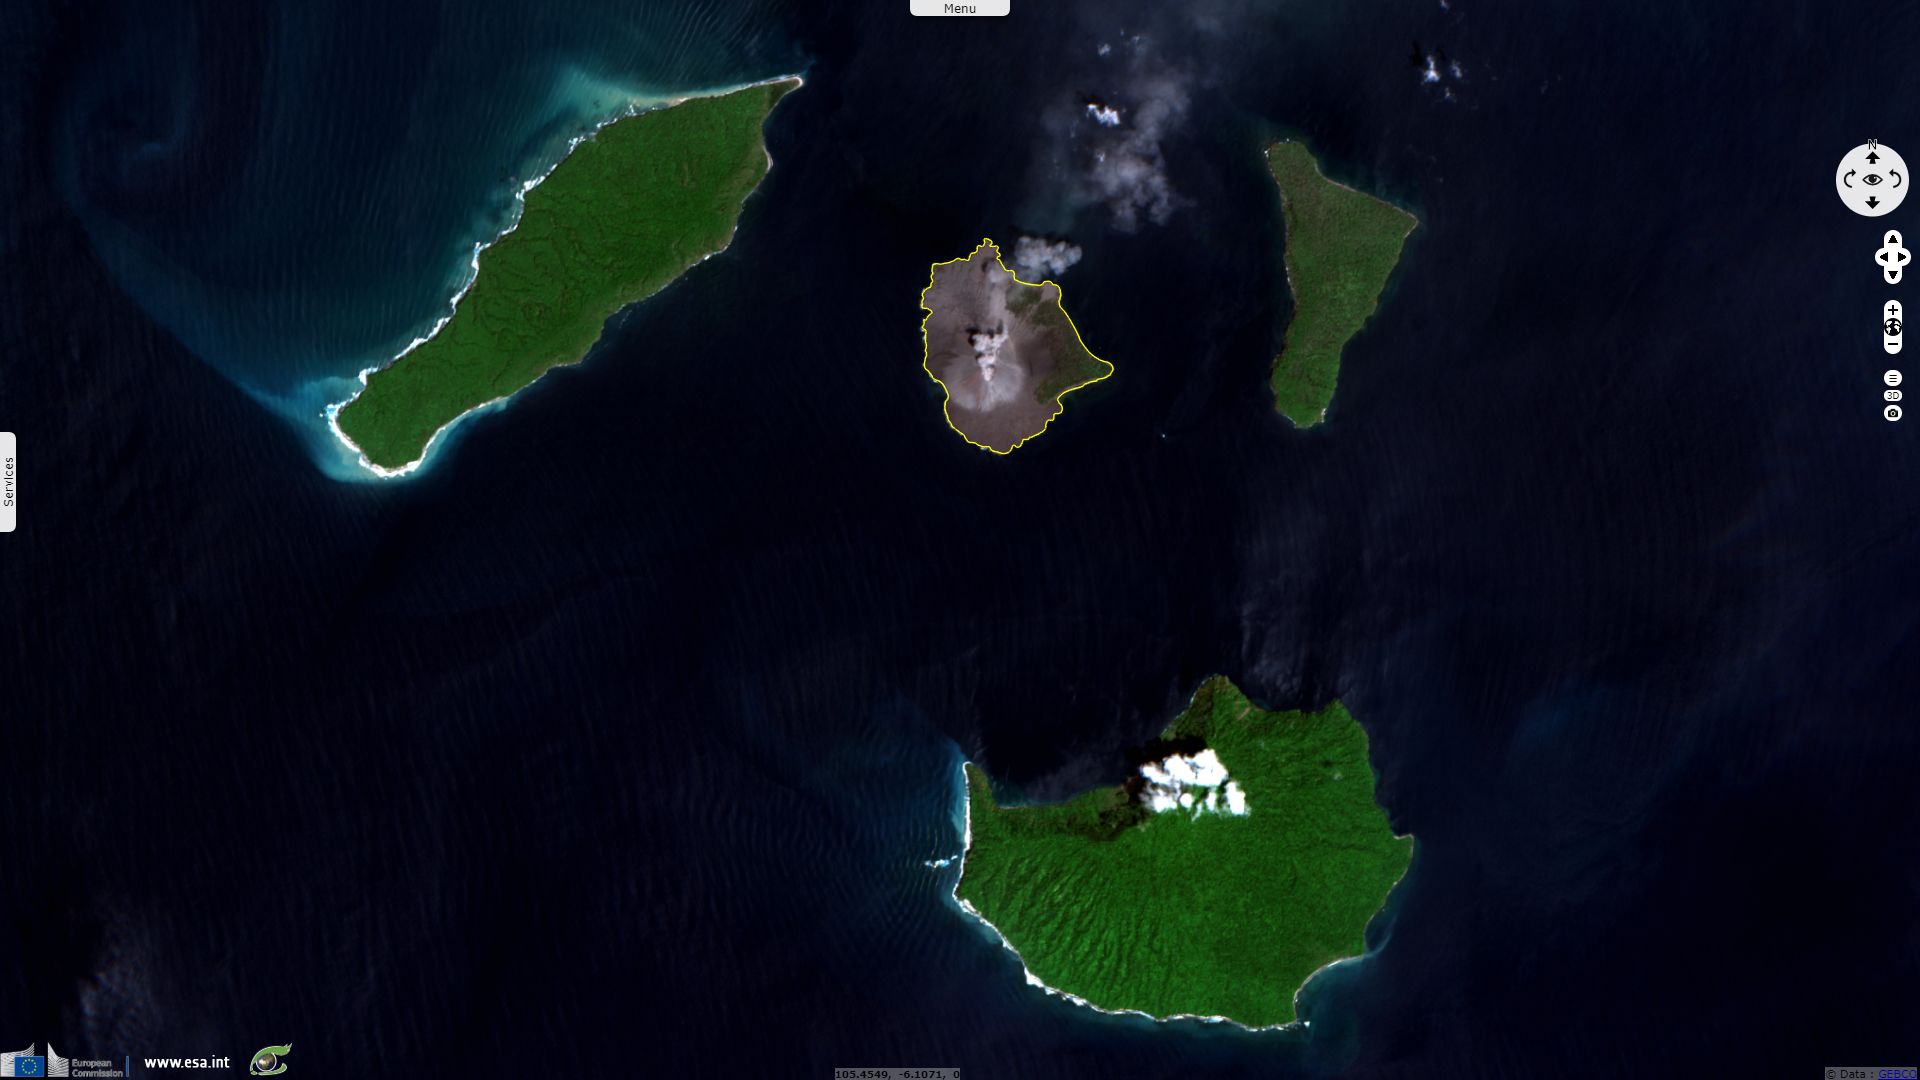
Sentinel-2 MSI acquired on 16 November 2018 at 03:00:01 UTC
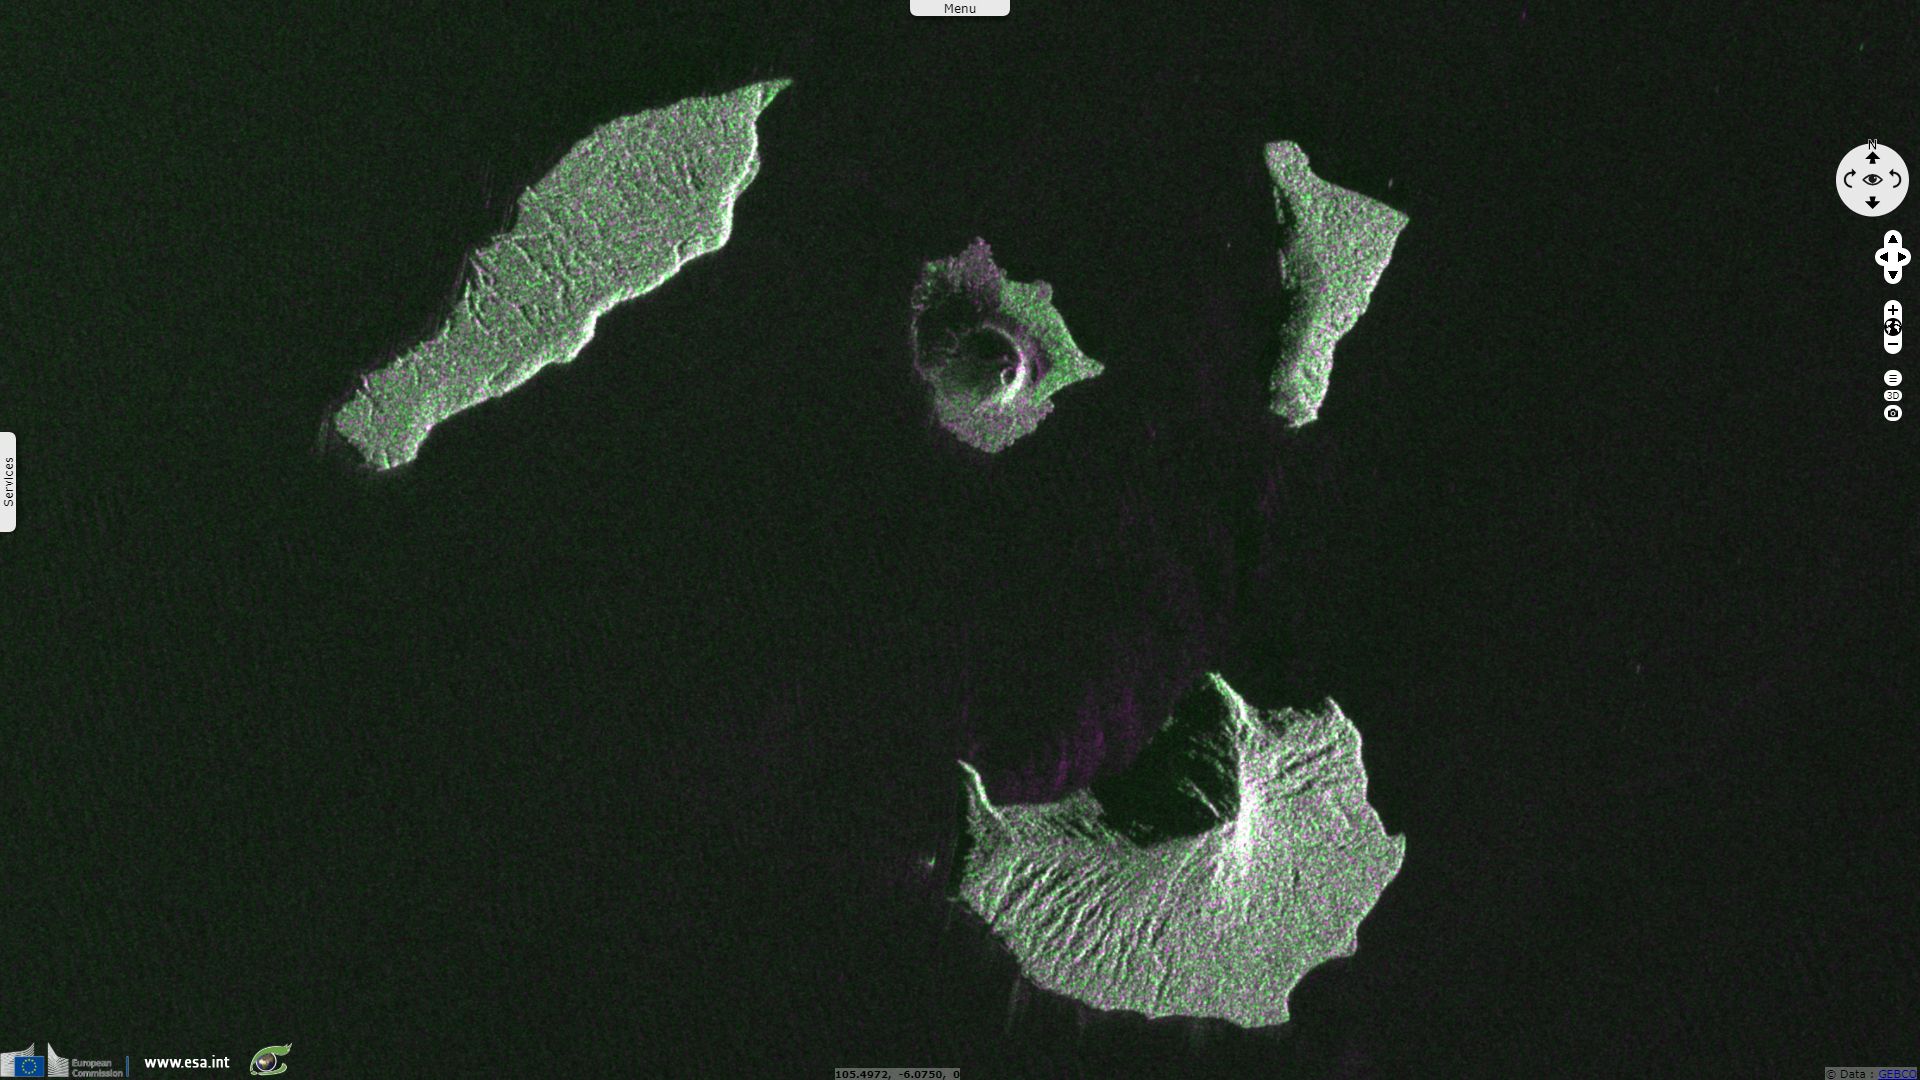
Sentinel-1 CSAR IW acquired on 16 November 2018 at 22:33:46 UTC
...
Sentinel-1 CSAR IW acquired on 22 December 2018 at 22:33:45 UTC
Sentinel-1 CSAR IW acquired on 25 December 2018 at 11:22:37 UTC
Sentinel-1 CSAR IW acquired on 16 November 2018 at 22:33:46 UTC
...
Sentinel-1 CSAR IW acquired on 22 December 2018 at 22:33:45 UTC
Sentinel-1 CSAR IW acquired on 25 December 2018 at 11:22:37 UTC
Keyword(s): Geohazard, coastal, emergency, natural disaster, landslide, flood, volcano, geology, Indonesia, Pacific Ring of fire
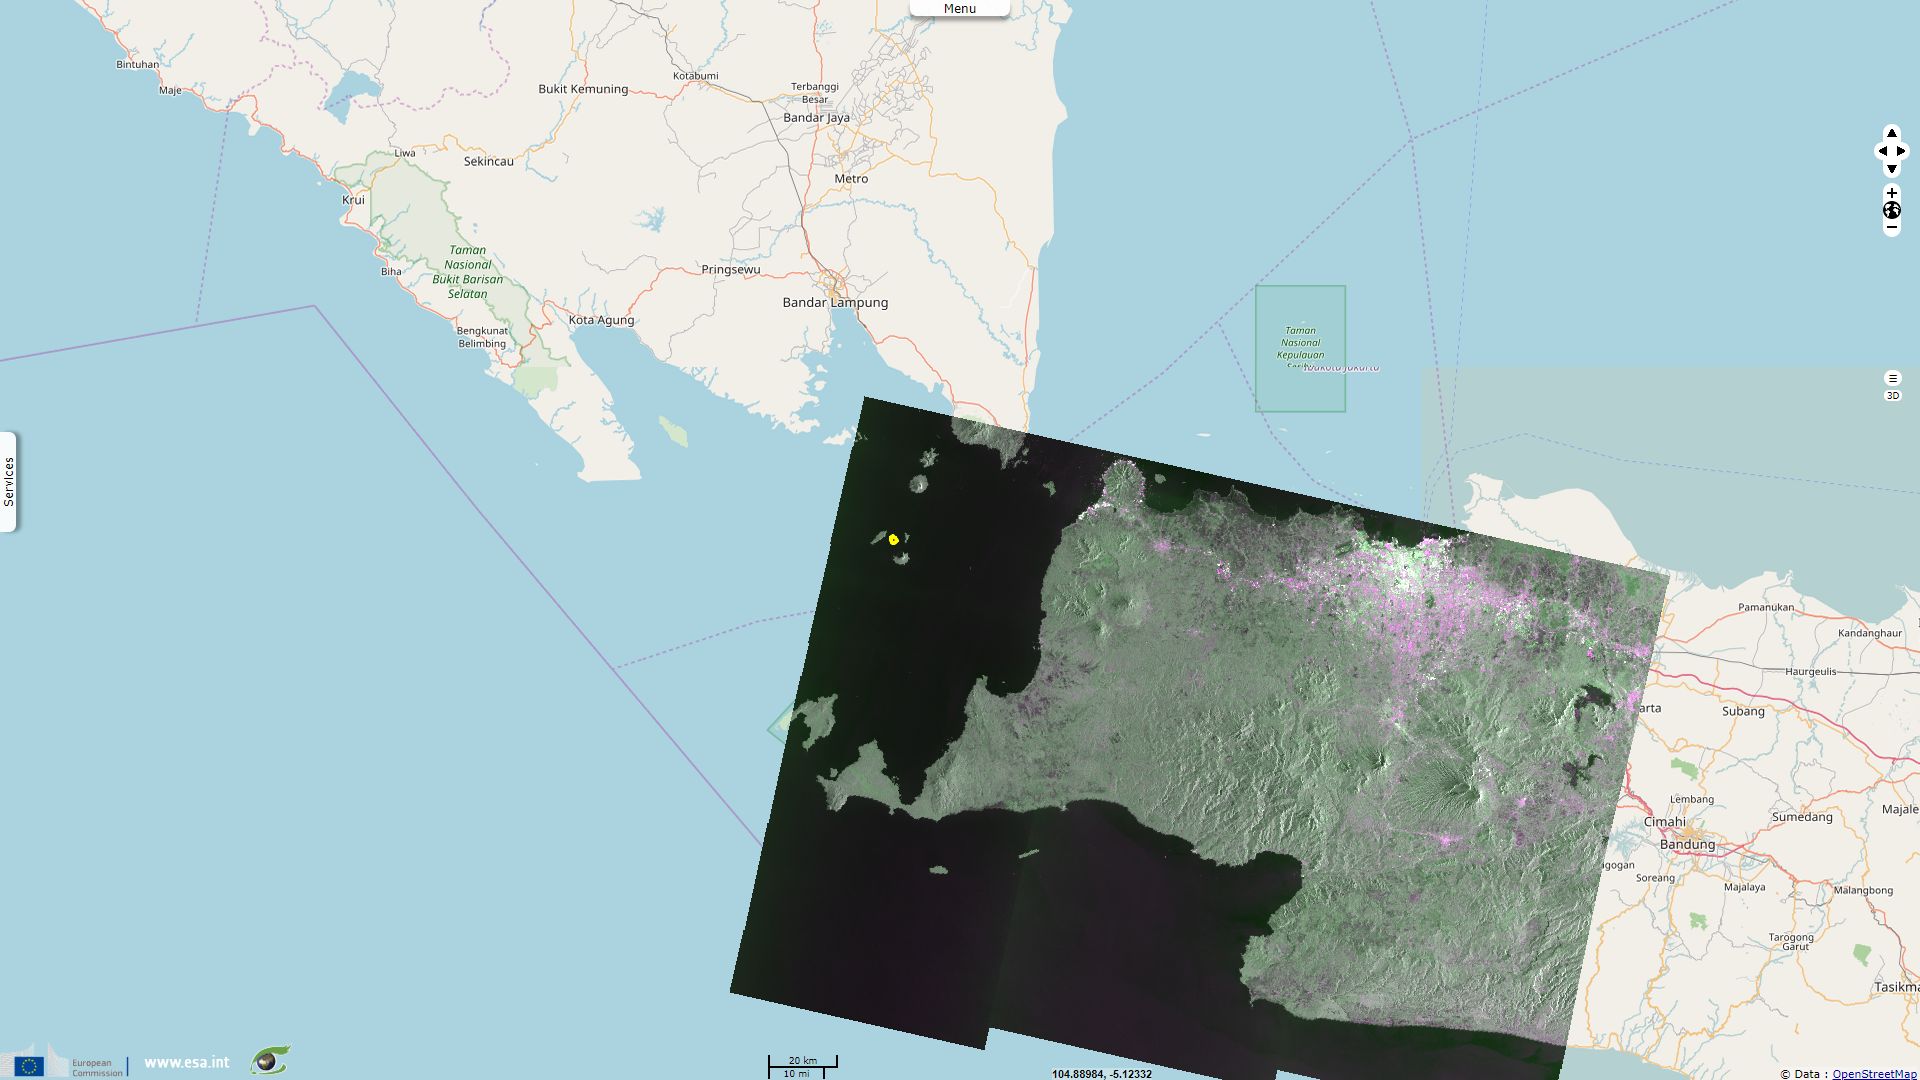
A tsunami swept over the coasts of the Java and Sumatra islands (Indonesia) on both sides of the Sunda Strait on Saturday, December 22, 2018 at approximately 9:30 pm (14:30 UTC) causing severe casualties. This tsunami has been caused by a landslide of a low part of the volcanic cone and the collapse of the Krakatau (also called Krakatoa) volcano.
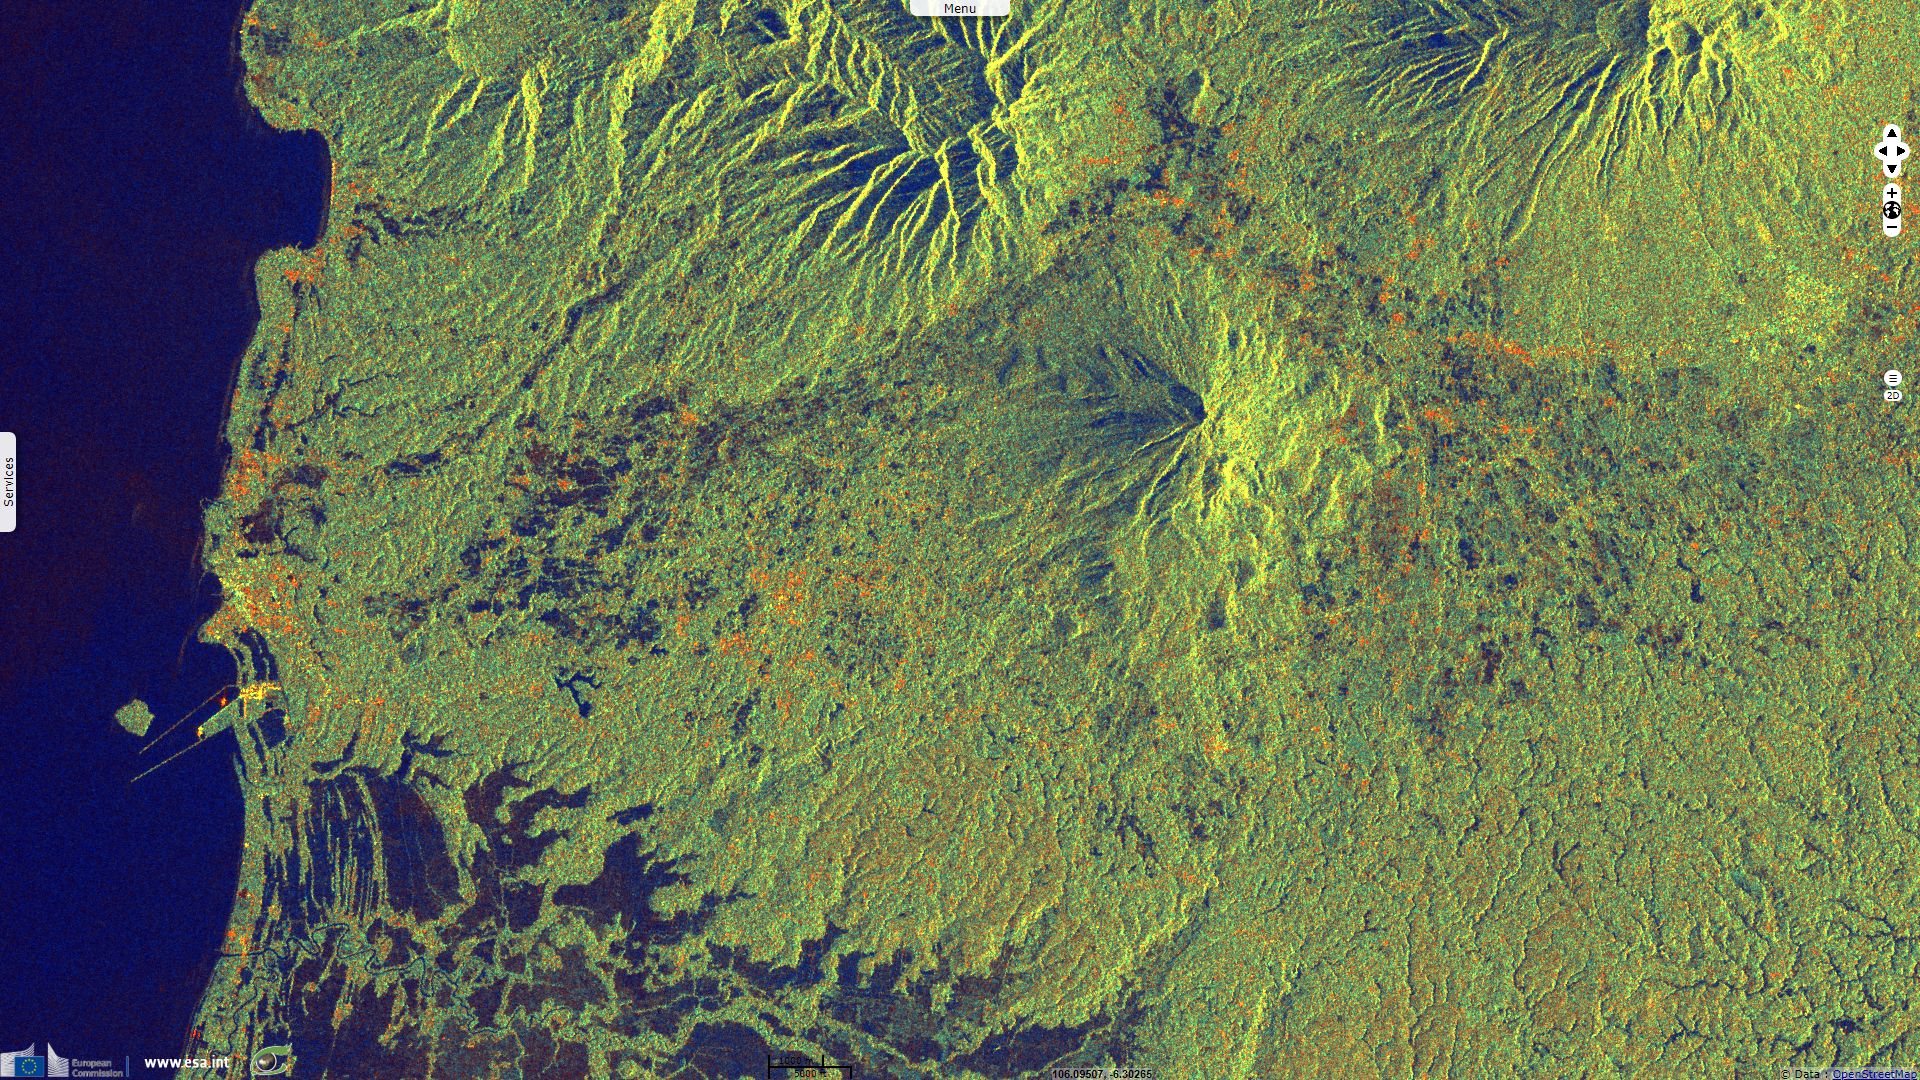
Satellite imagery can extensively be used for the follow-up of volcanic eruptions, especially Sentinel-1 radar images for which clouds and plumes are almost transparent and are very sensitive to the morphology, to roughness variations of the land or sea surface. The revisiting time is short, depending on the -use of two satellites S1A and S1B (same orbit with 6 days dephasing), -descending and ascending orbits acquisitions, and -large swath of 240 km in default IW mode.
The C-SAR instrument onboard Sentinel-1 is an active radar; i.e. it emits its own microwave-frequency light at morning (descending orbit) and at evening (ascending orbit). Unlike sunlight, this directional microwave illumination is not absorbed by clouds, it reveals relief particularly well and illuminates brighter the exposed faces of the volcanic cone.
Sentinel-2 acquires images using MSI, its passive instrument in the optical domain. When it is not obstructed by clouds, it is therefore the backscattered light of the Sun that is measured in 13 spectral bands ranging from visible to near and medium infrared.
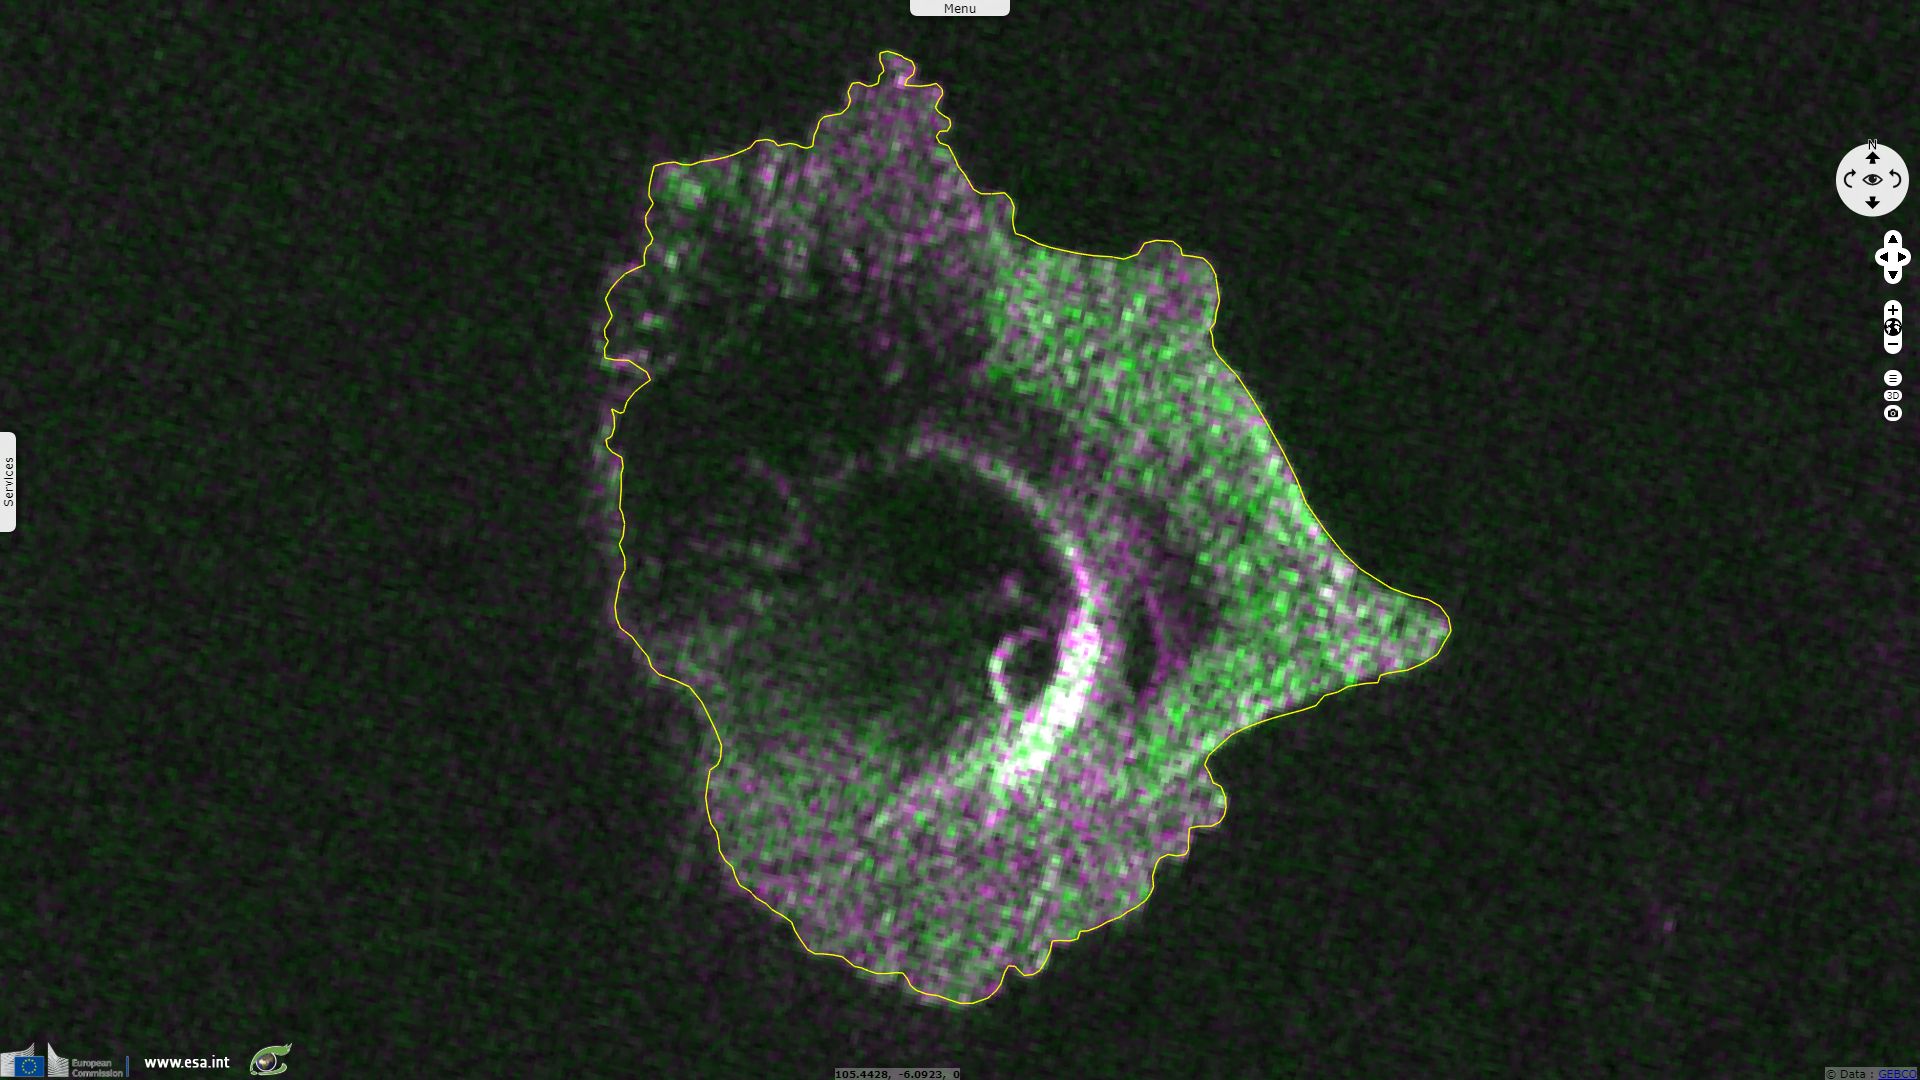
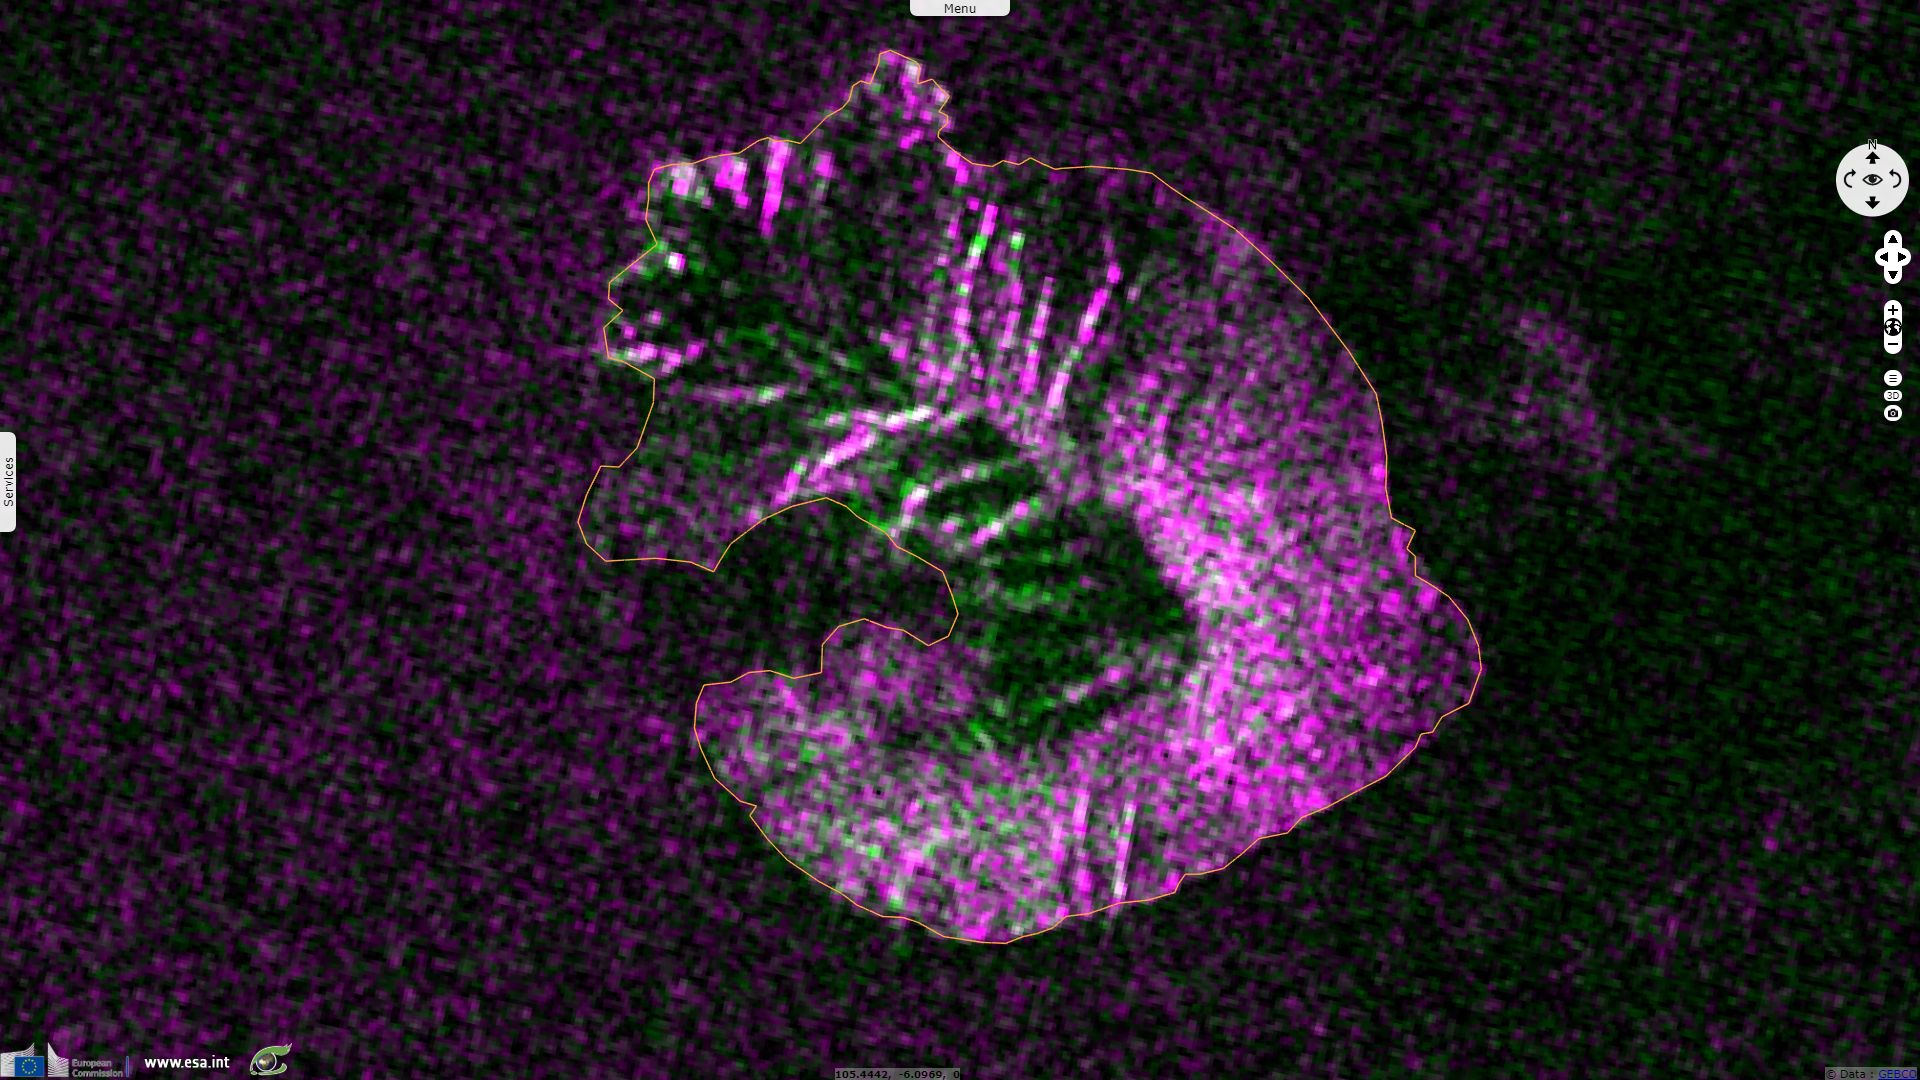
The relief revealed by the radar imagery makes it possible to precisely delimit the contours of the crater: main and adventice craters (fig.6) and very enlarged crater after the eruption (fig.7). The colour composite VV,VH,VV shows that the dominant polarization is VH in the vegetated part in the east of the island. The dominant magenta shows the predominance of VV, a sign of a low depolarization over a rough surface of rocks.

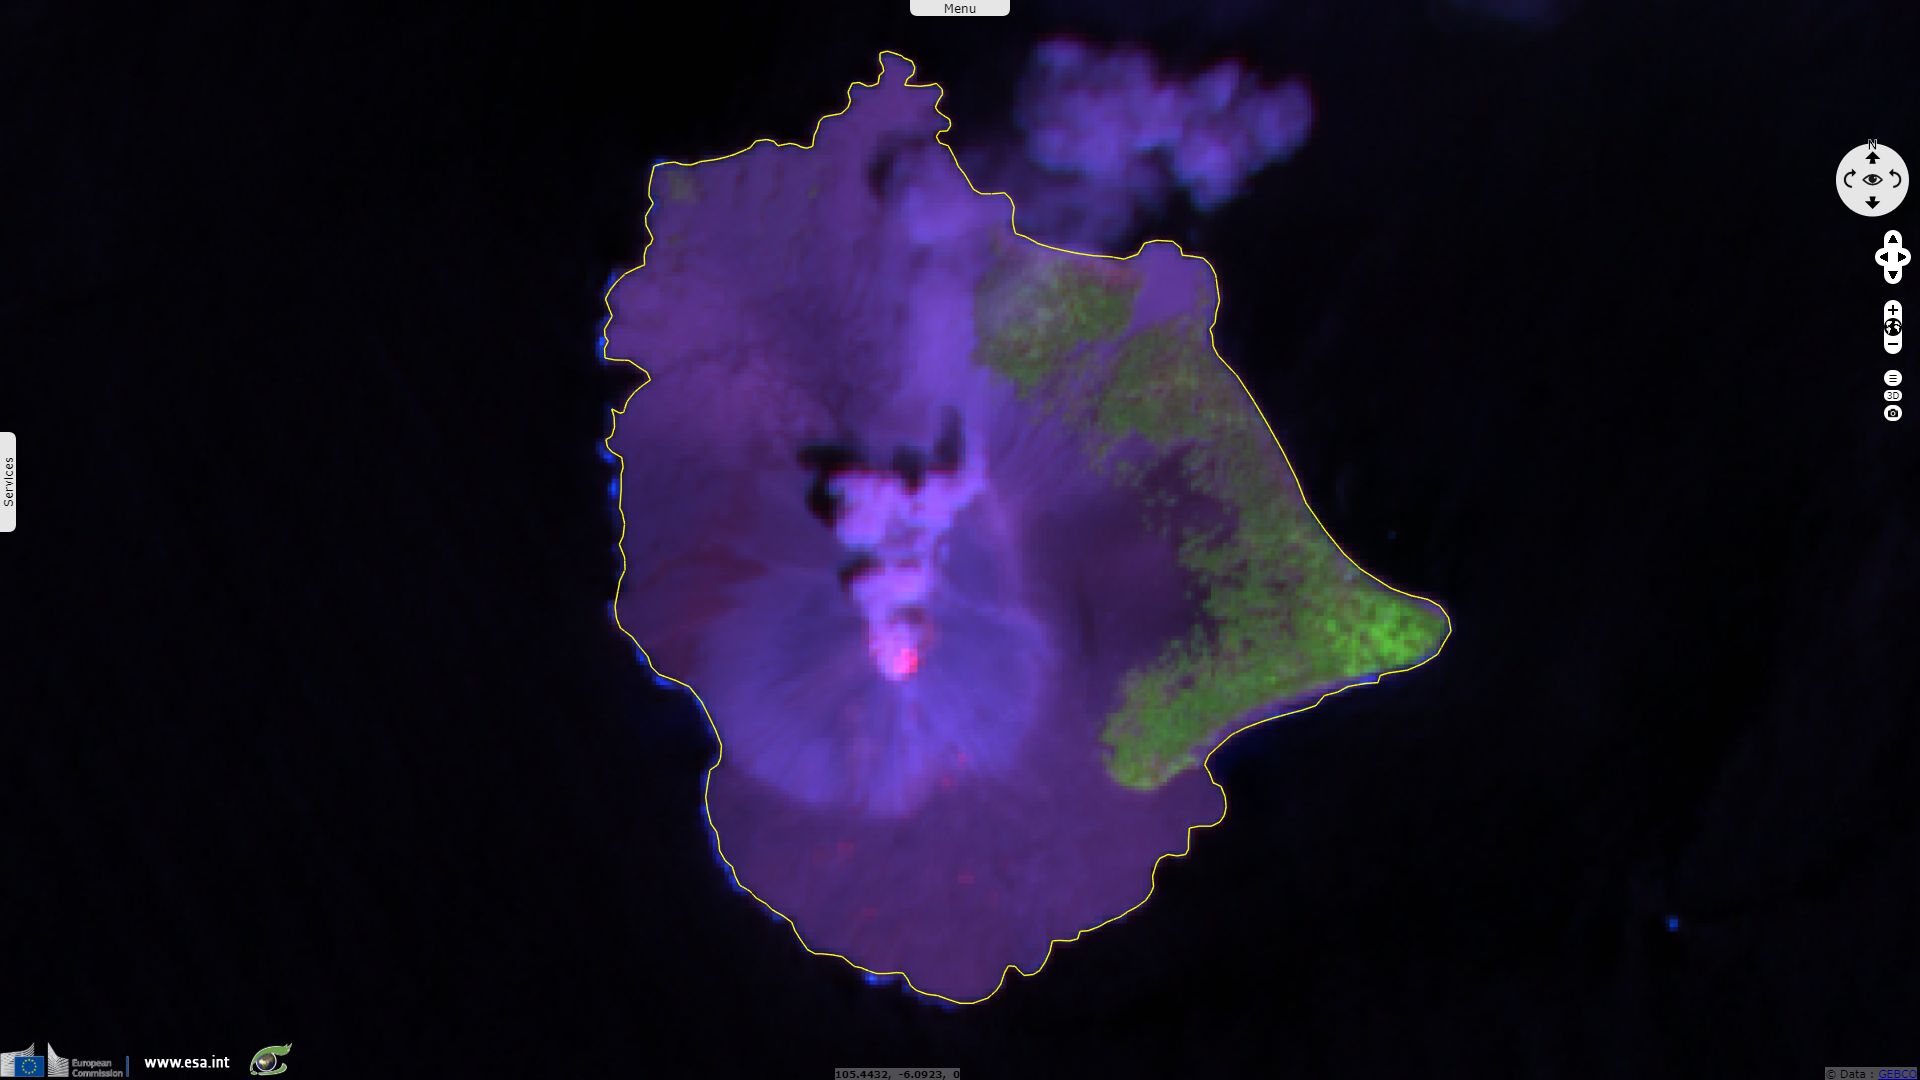
The colour composition 12,8,4 used in fig.8 involves the SWIR (ShortWave InfraRed), NIR (Near InfraRed) and the red. The SWIR component (B12) reveals hot-spots in the crater and some isolated points south of the cone of the volcano.
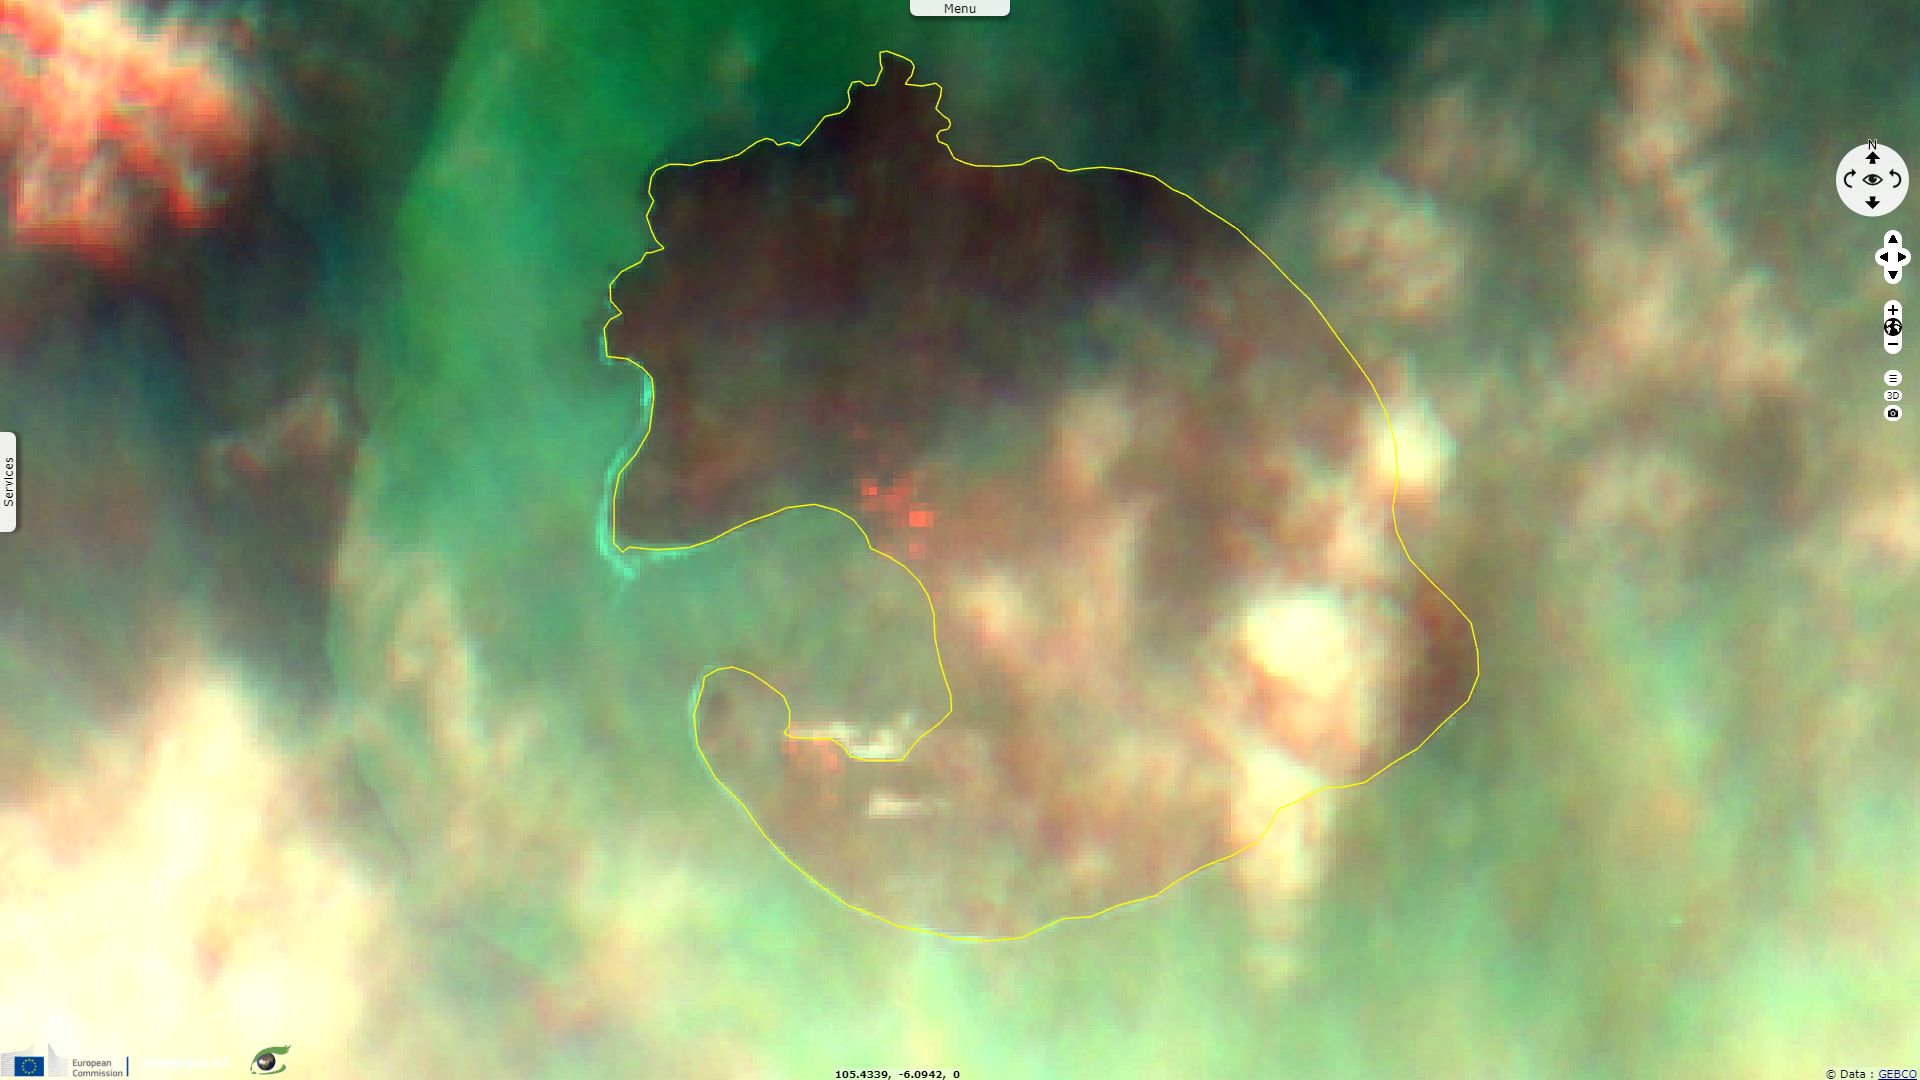
The colour composition 12,3,2 used in fig.9 reduces the obstruction of the clouds and smoke. Once again, the SWIR band (B12) is used to locate hot-spots around the crater.
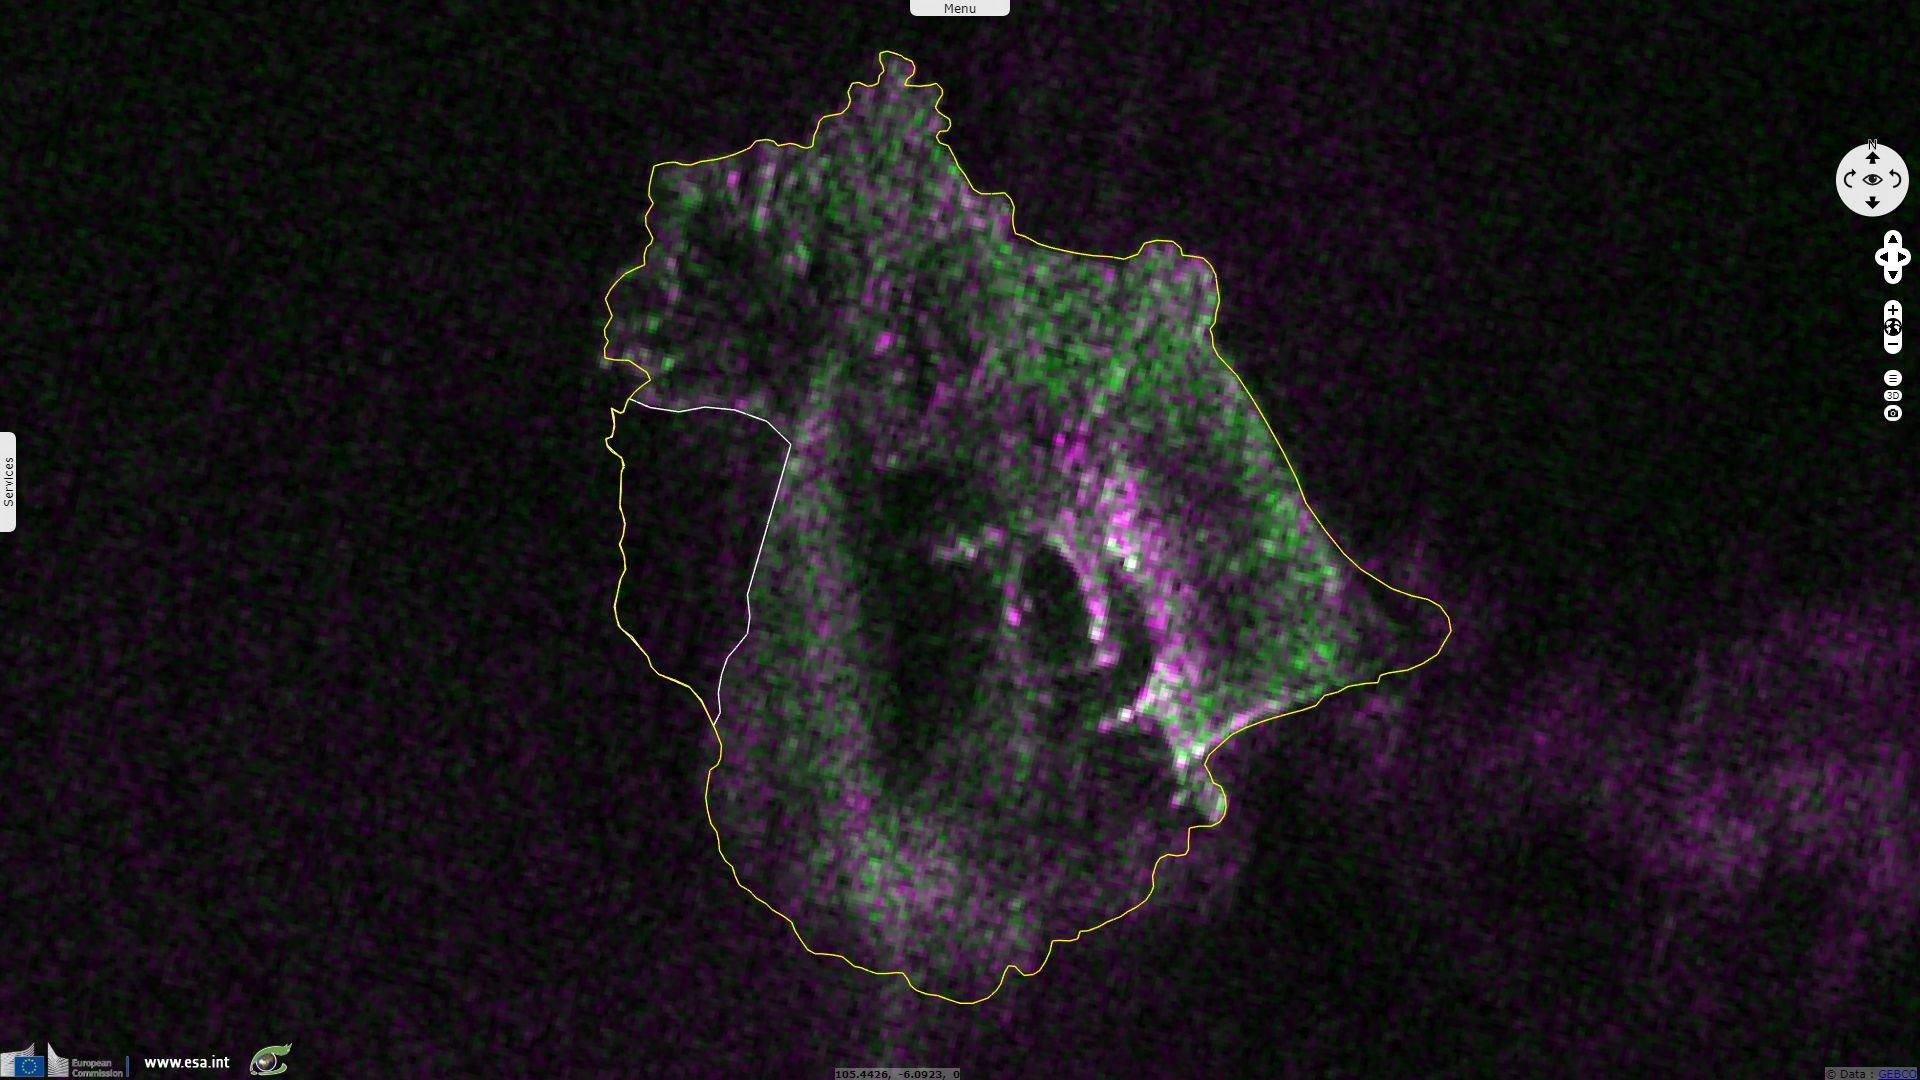
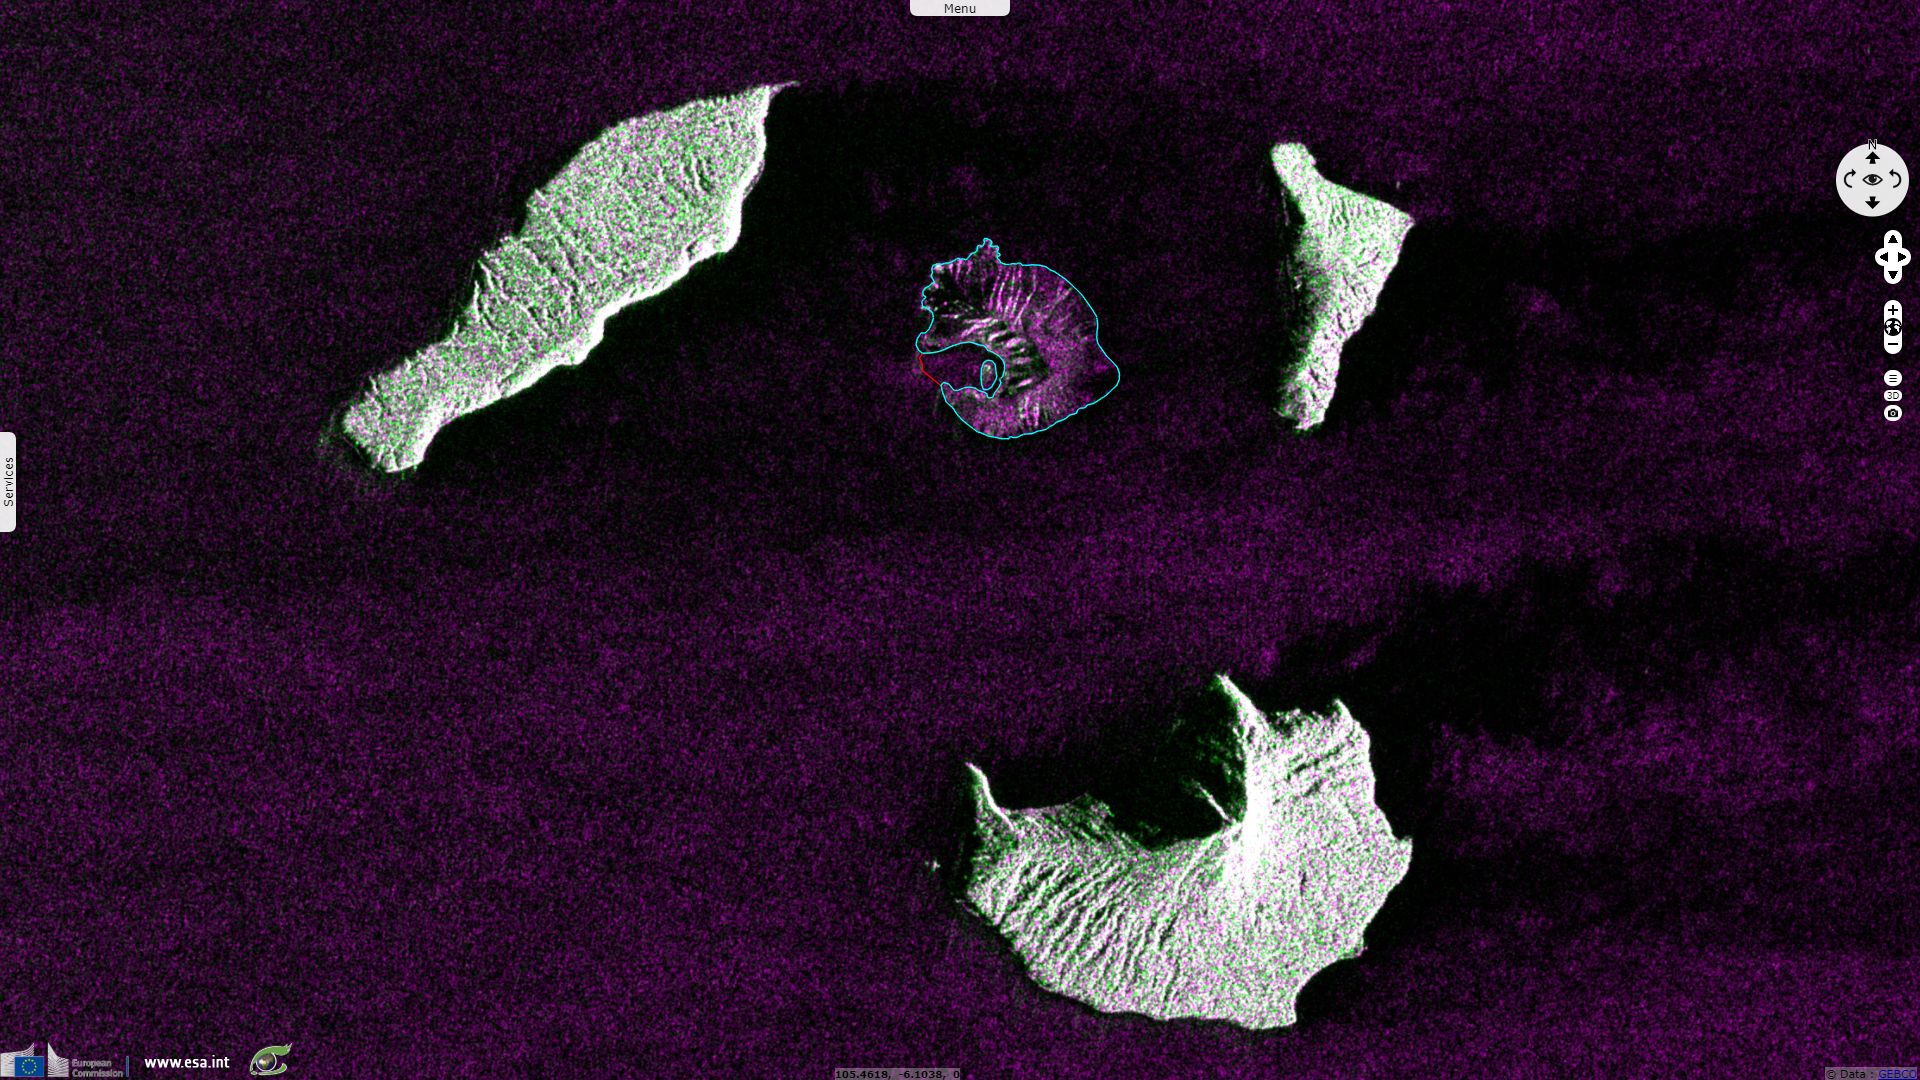
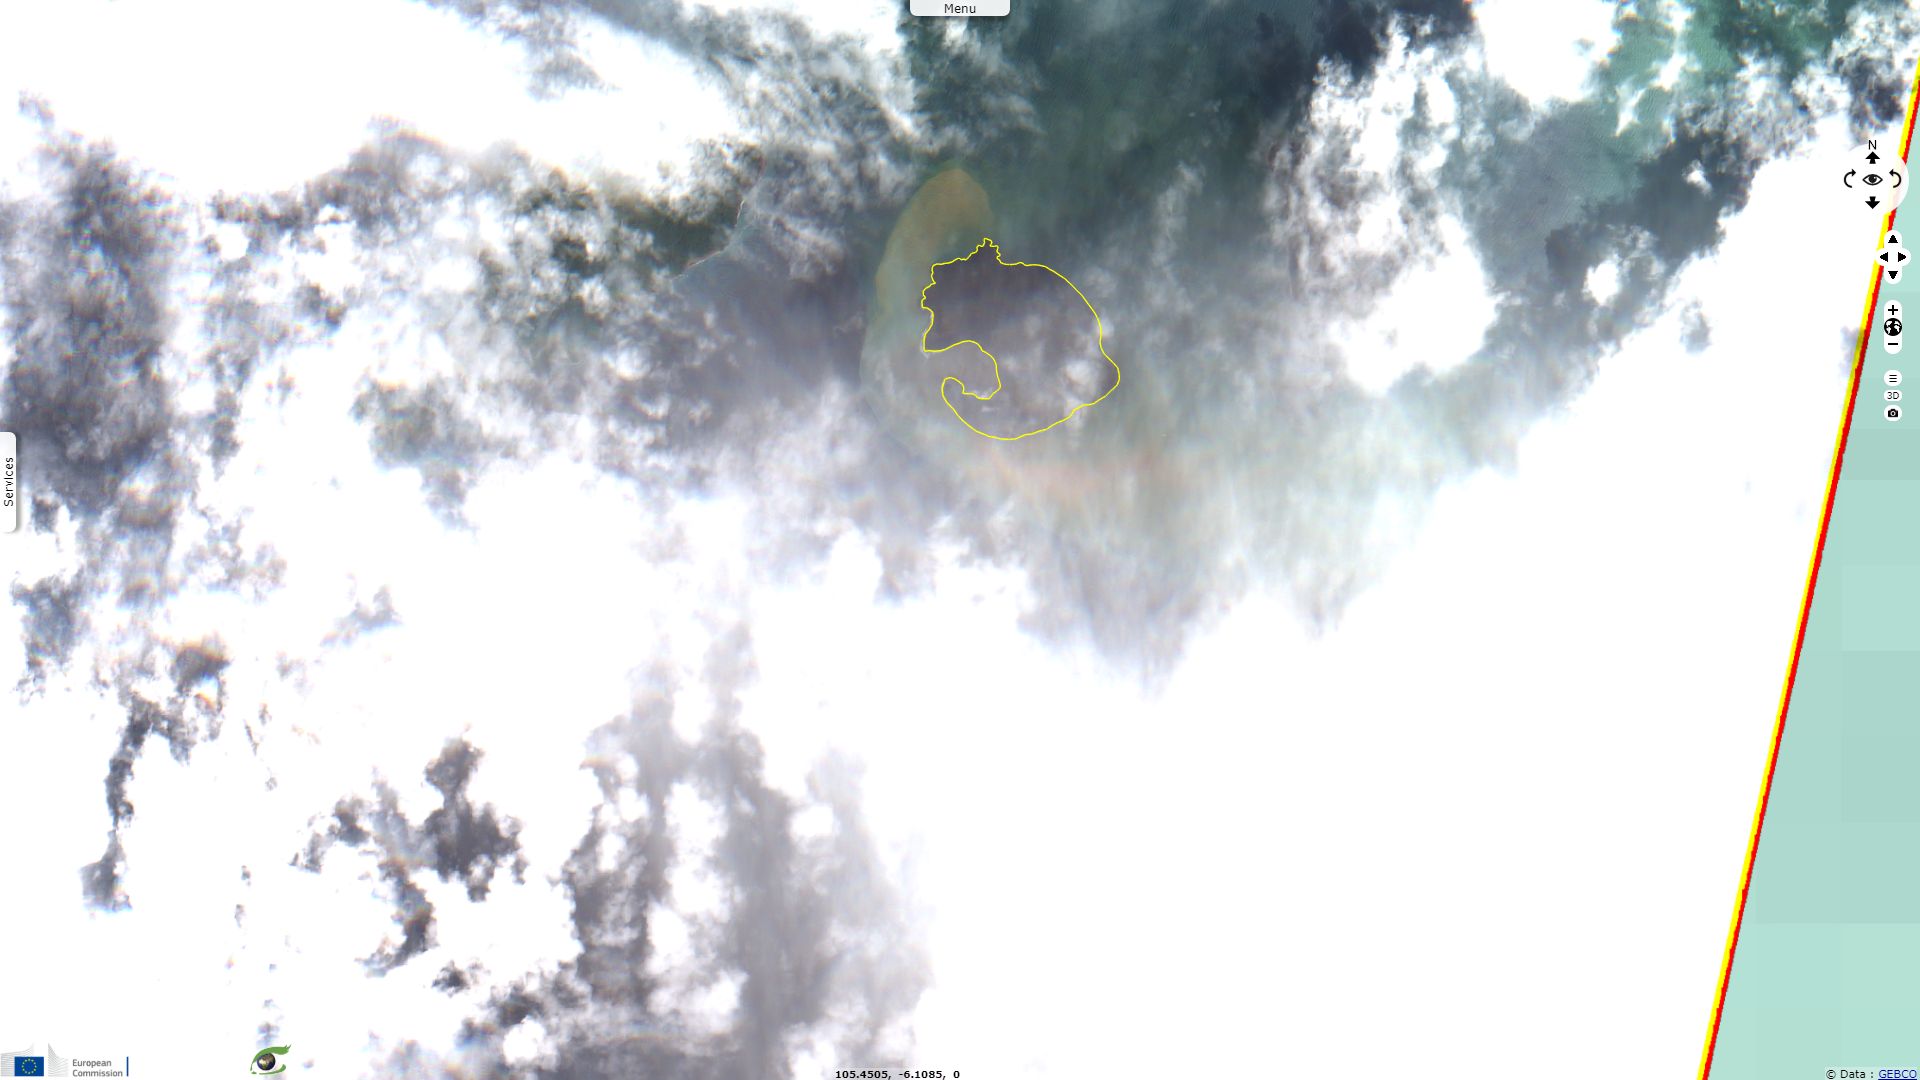
Fig.10 has been acquired 8 hours after the tsunami. In the west part of the island, one can clearly see the detachment of a large strip of the coast (white polygon). This area is most likely the emerged part of the landslide that caused the tsunami.
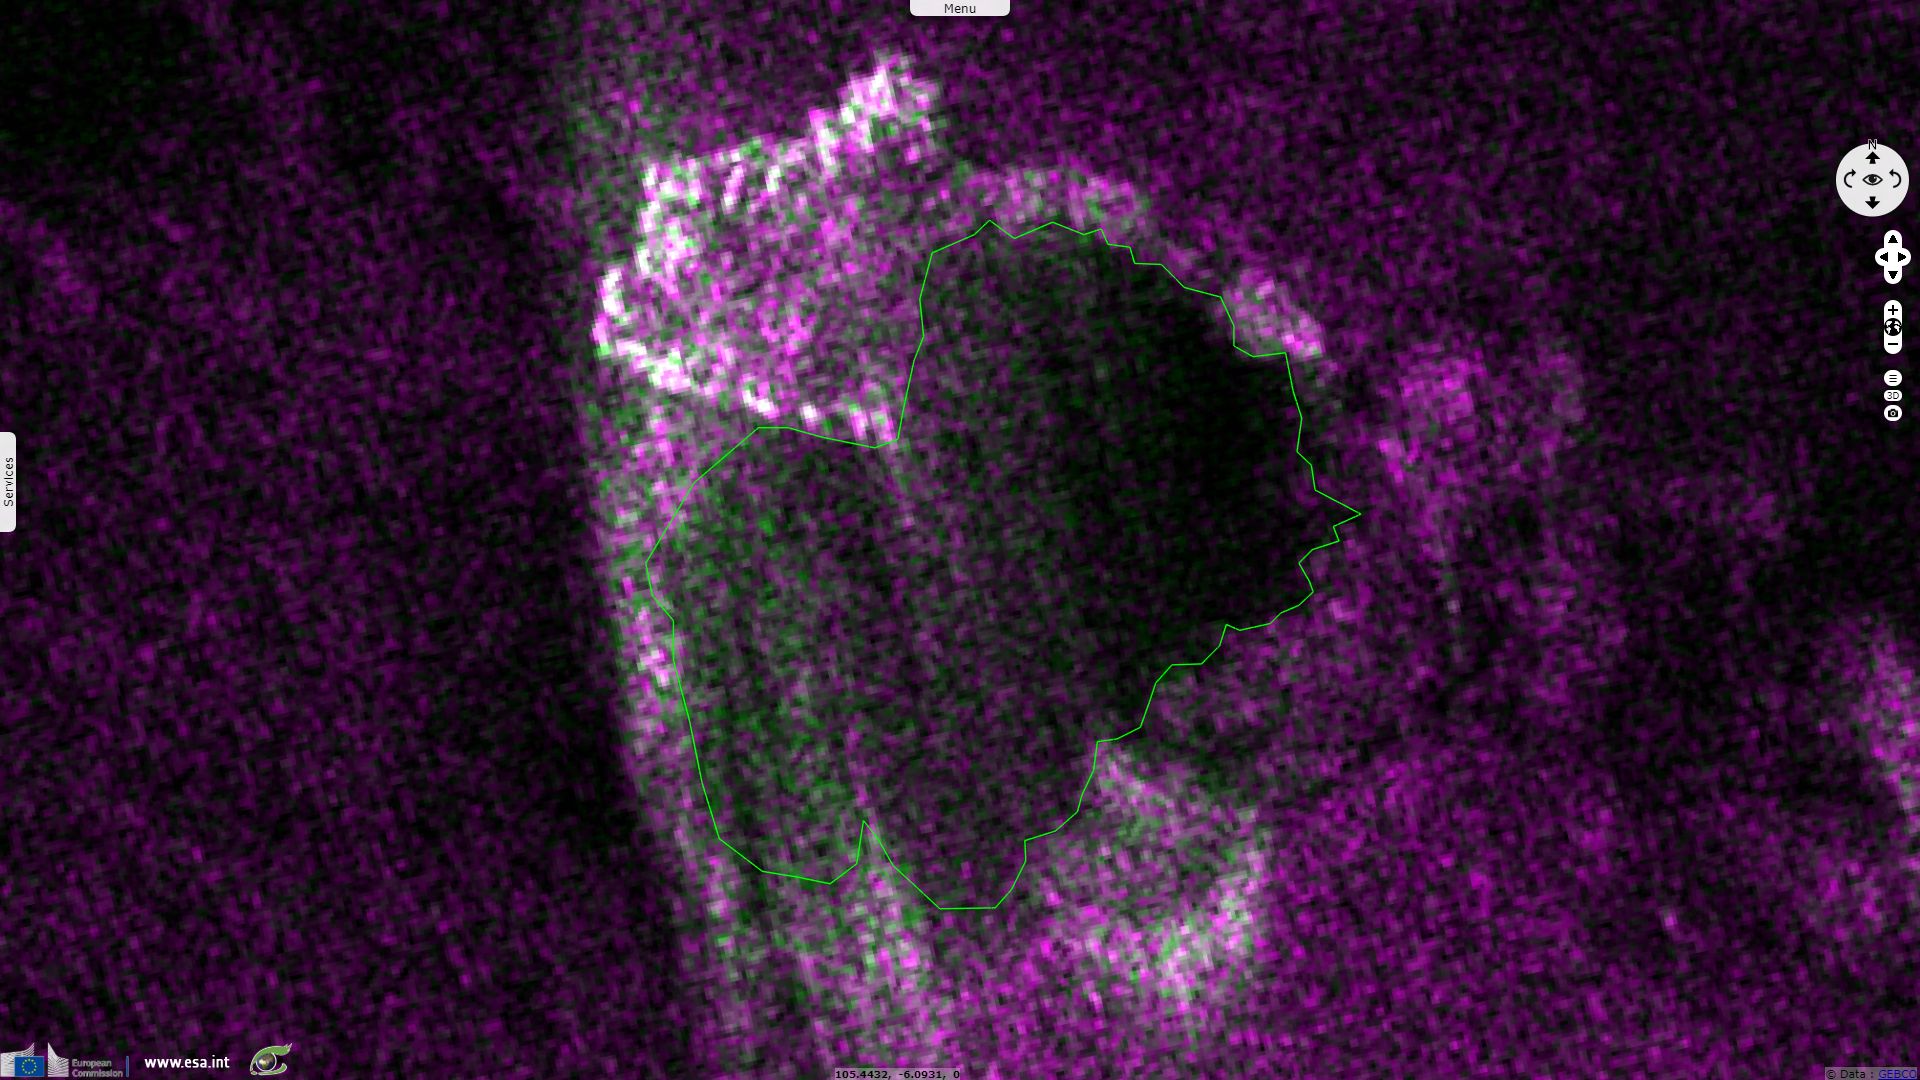
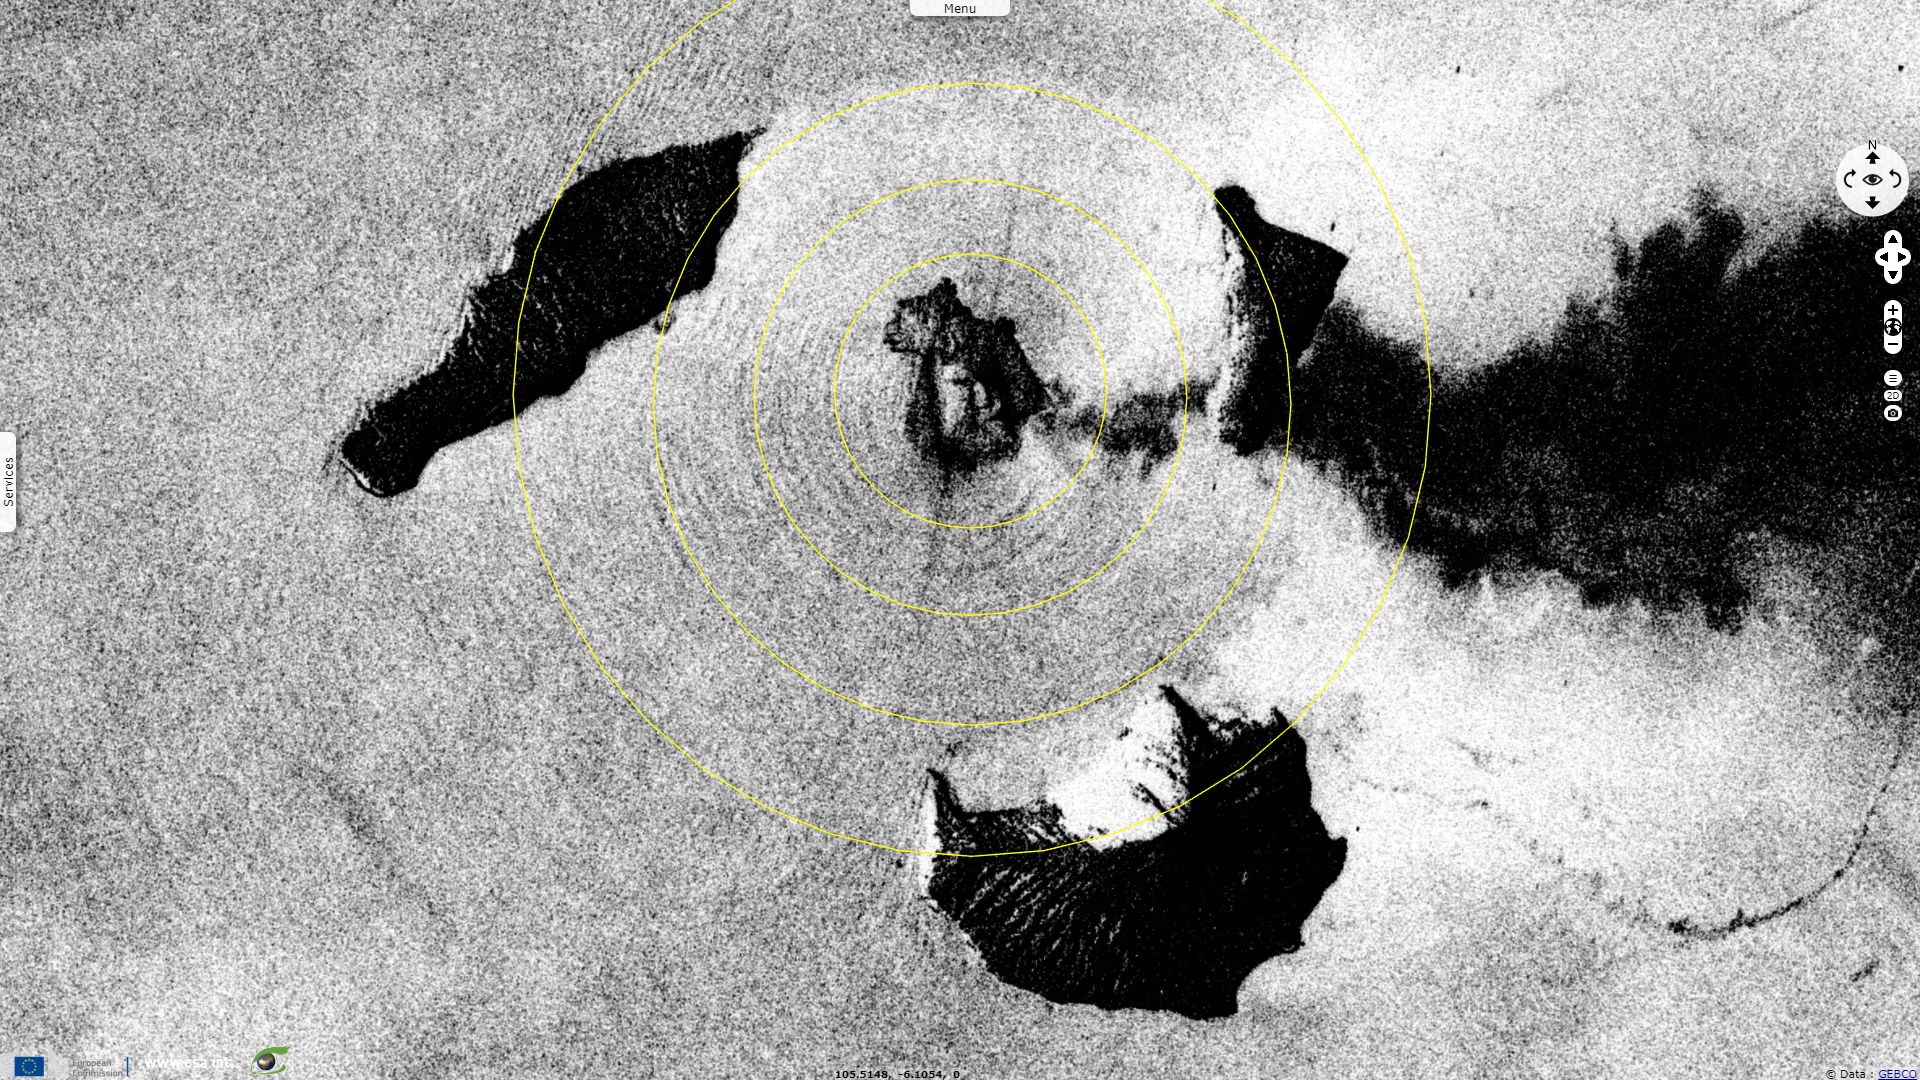
Fig.11 is blurred. A high density plum, dark mass above the crater suggests that the signal has encountered large targets, probably rocks much larger than the 5.5 cm wavelength of the C-band. This material had to be violently projected vertically to produce a Doppler phenomenon whose effect is rendered by the lighter segment perpendicular to the pulse direction. Experts in radar signal processing could certainly estimate the ejection speed from this Doppler effect.
As illustrated in fig.12 and confirmed in fig.13, a larger crater is now present on the west side, while the accumulation of volcanic dust expanded to accrete the coast in its eastern part.
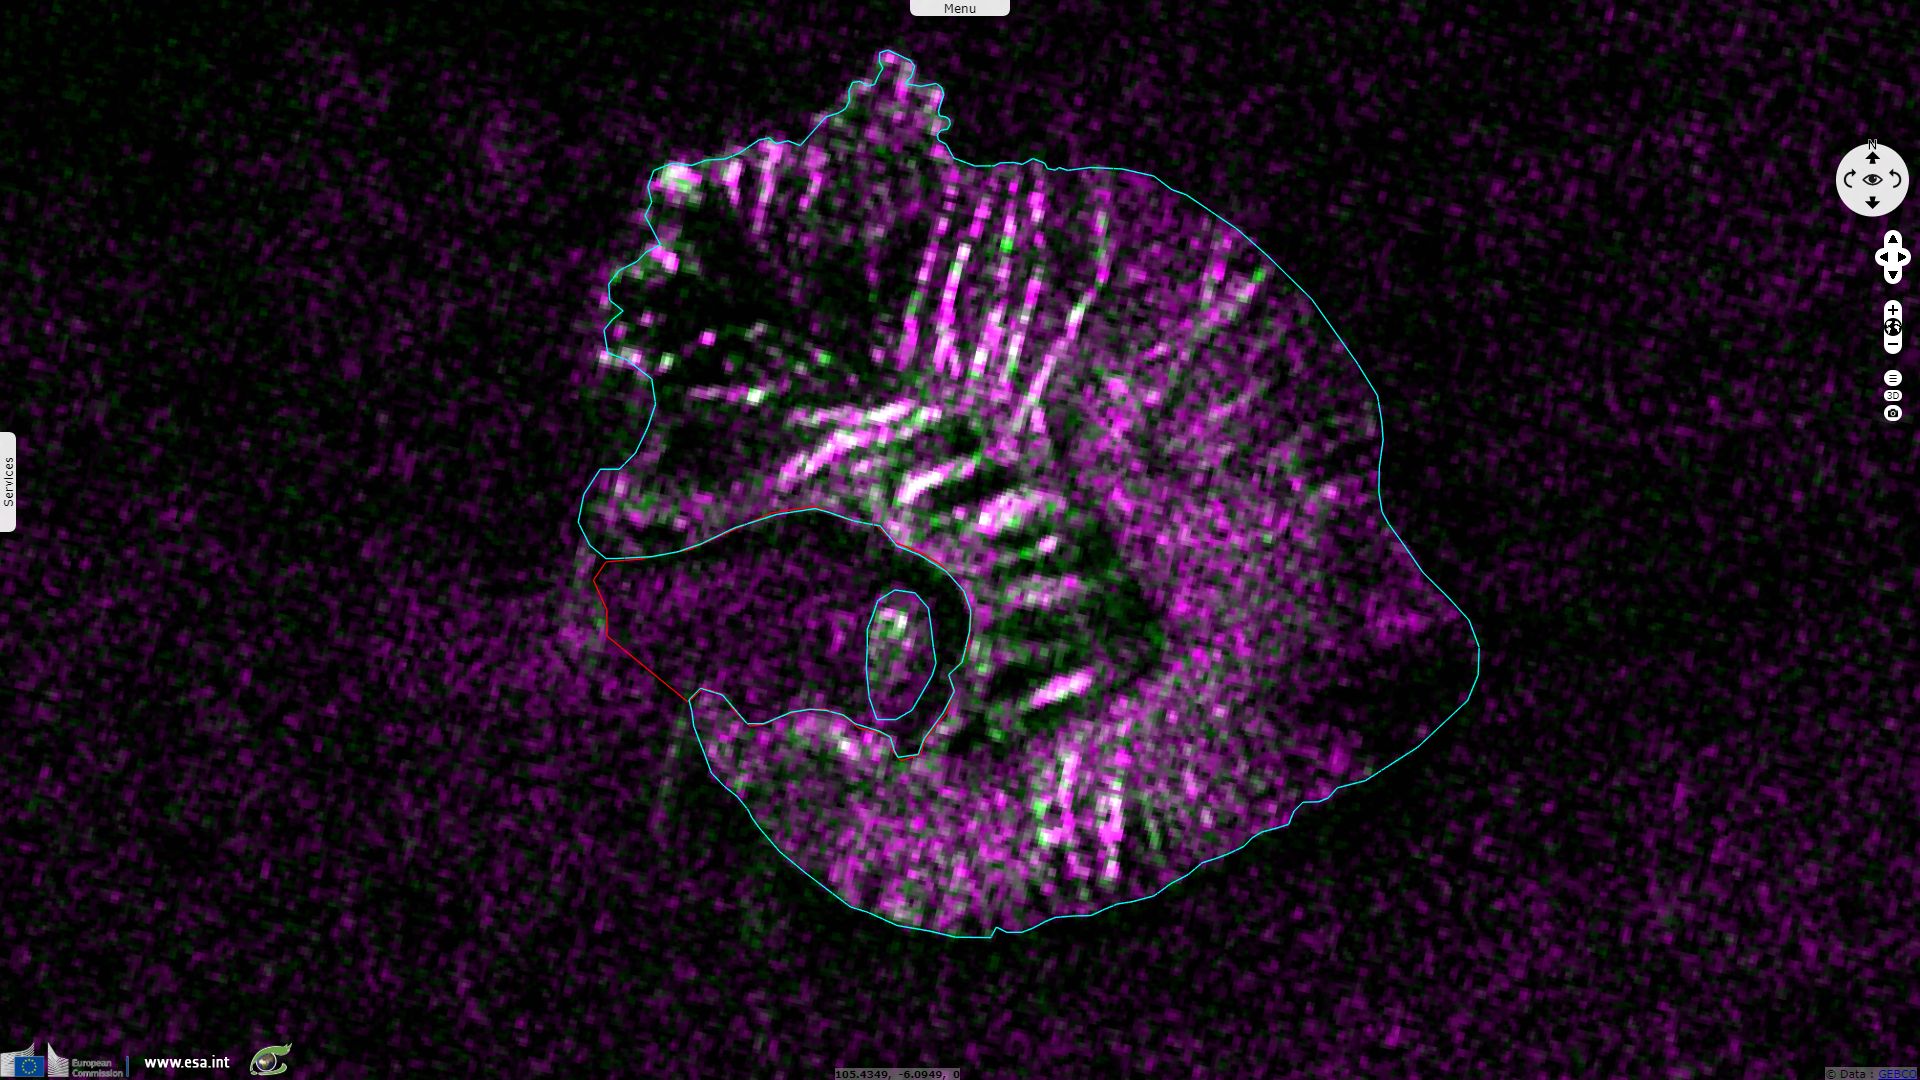
Fig.13 also shows the emergence of a peak in the flooded part of the new crater.
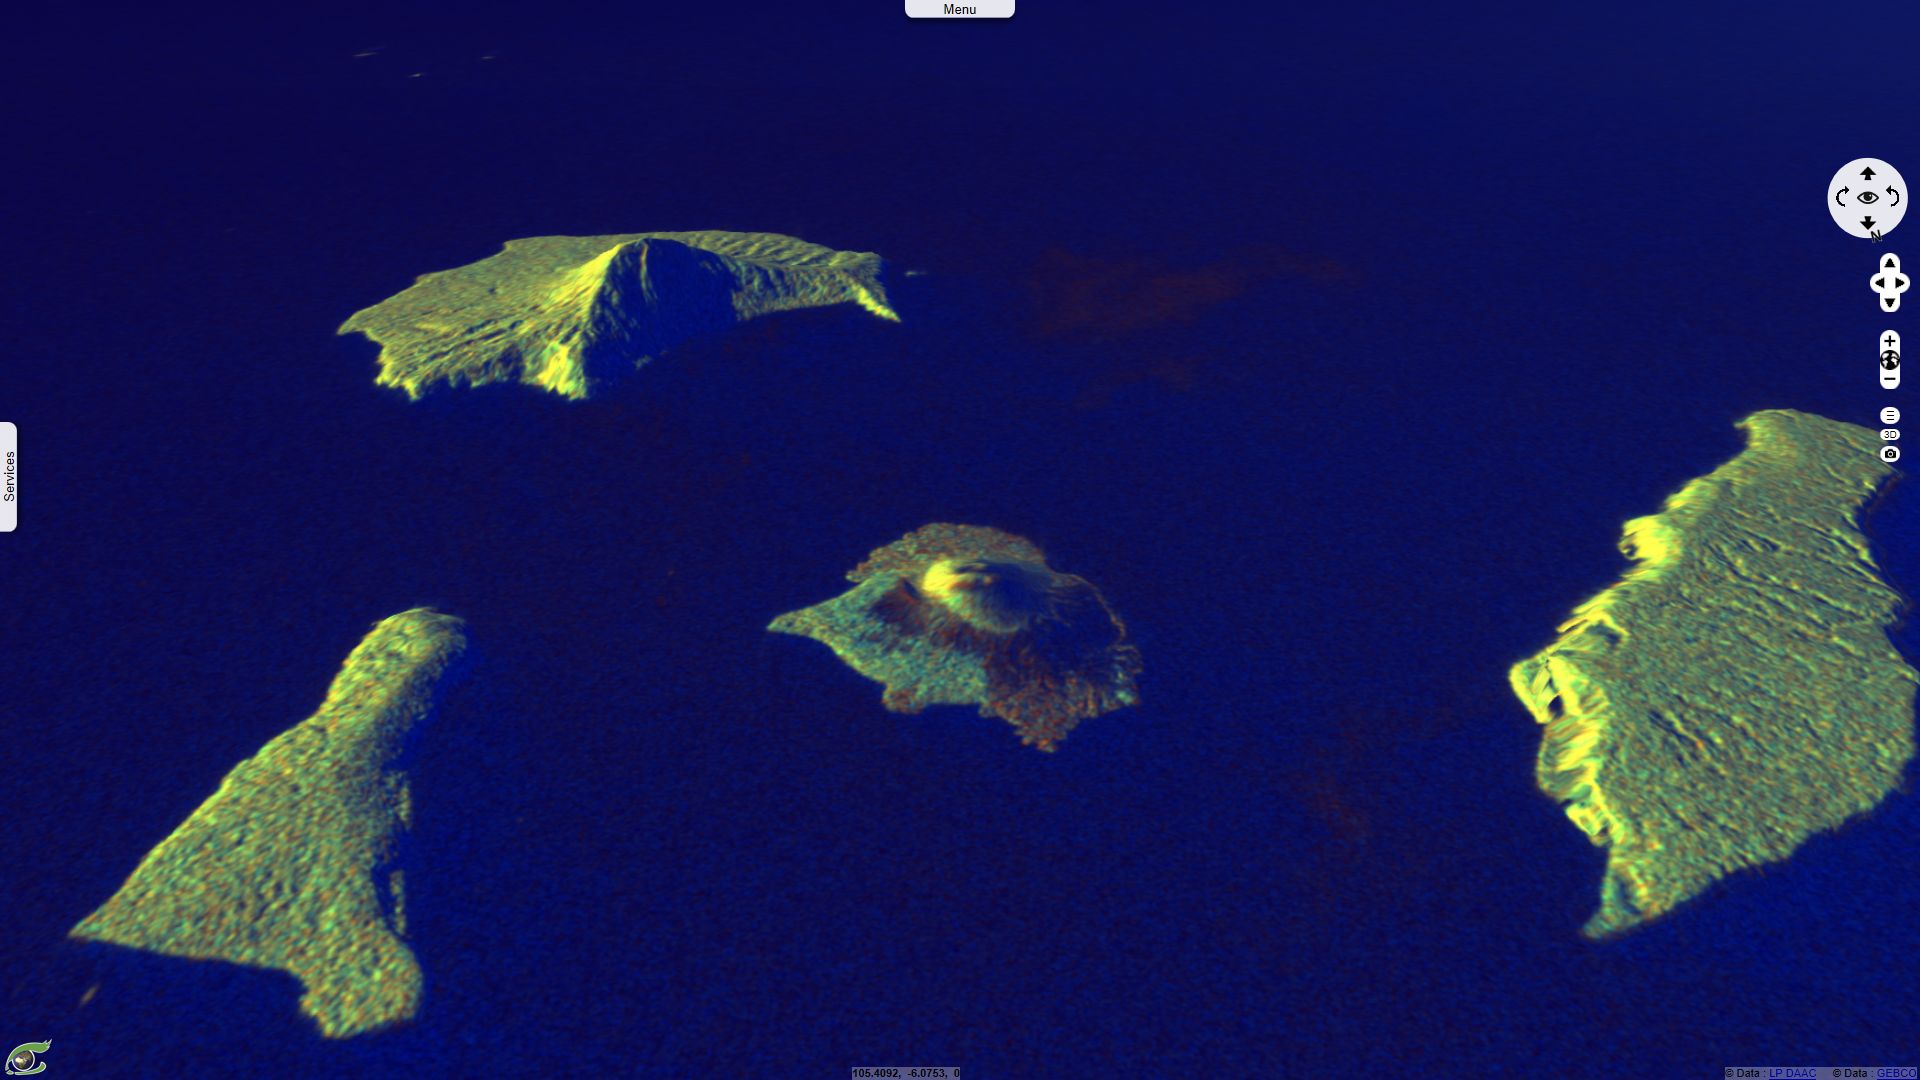
This view is an average of the previous 4 Sentinel-1A scenes with a 12-days (revisit) cycle in descending orbit. The colours exploit the two polarizations VV and VH of the C-SAR instrument.
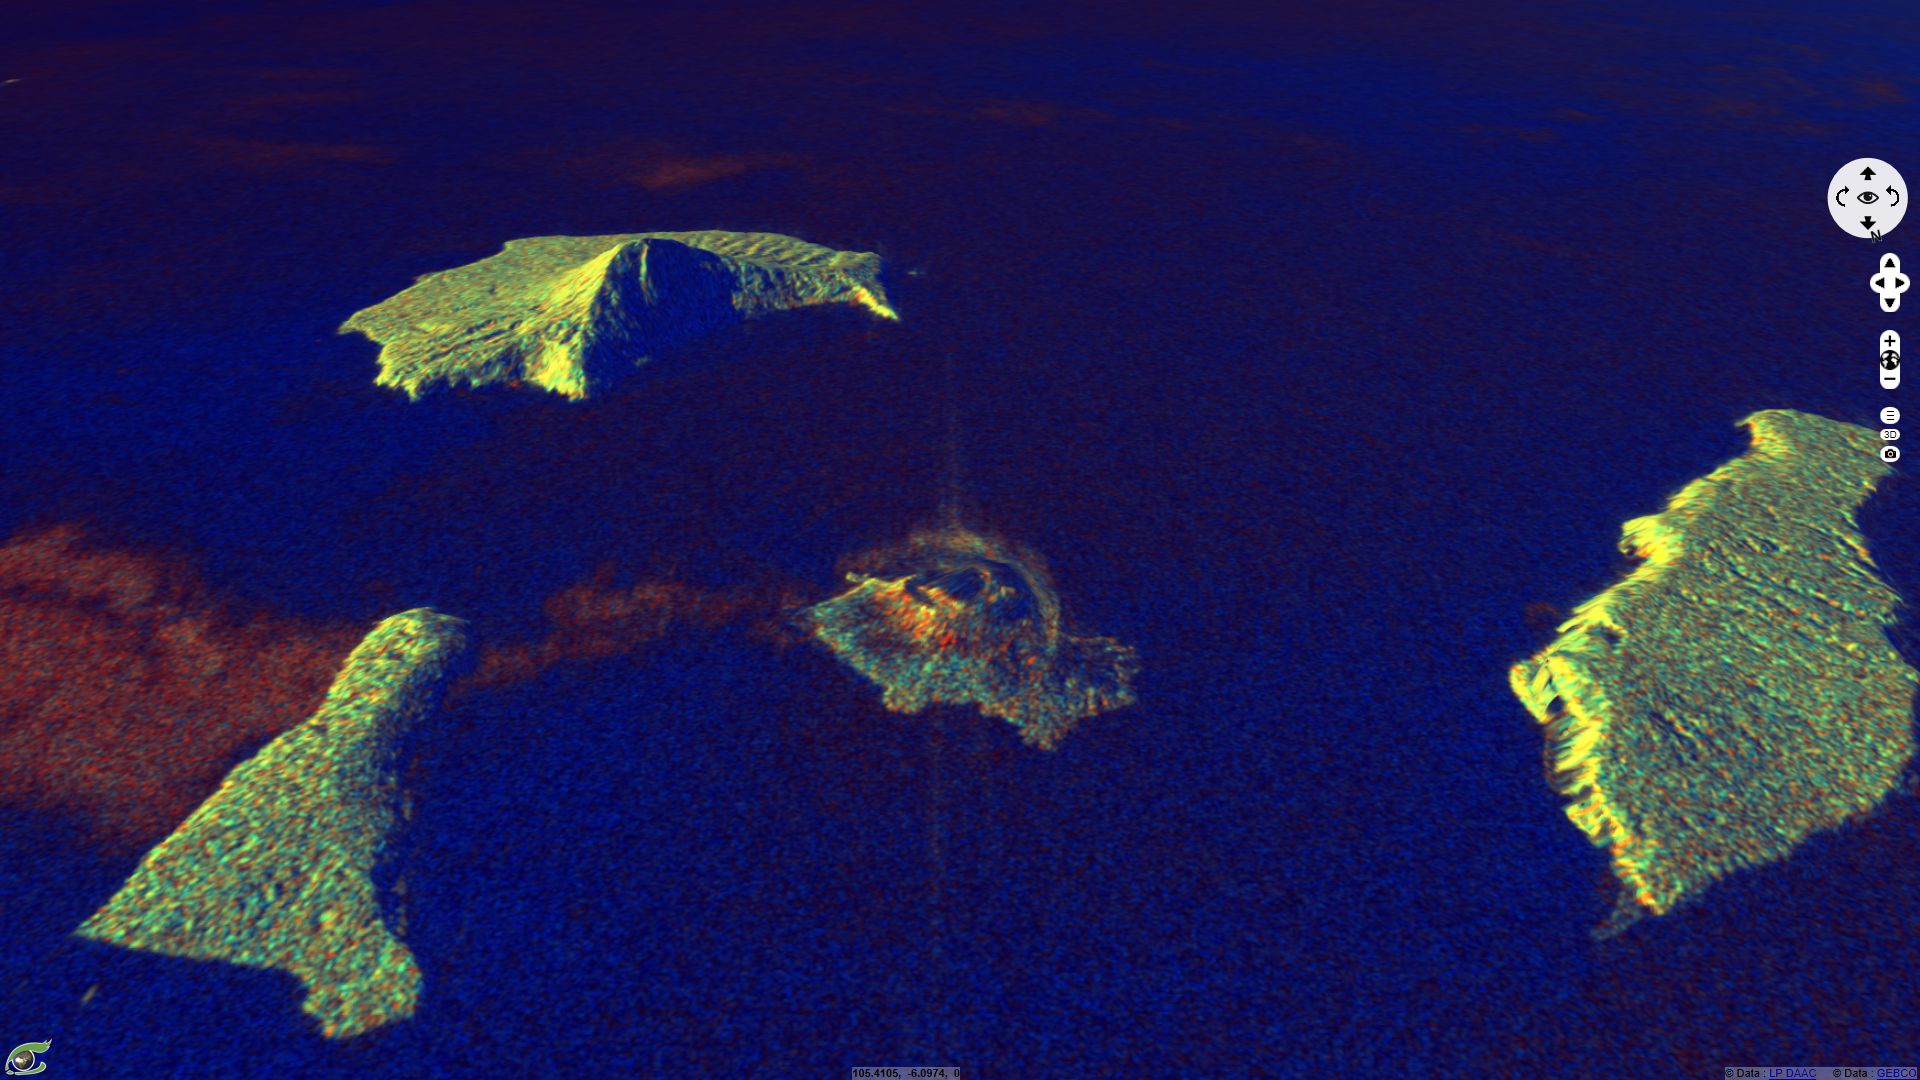
The 3D view of radar scene Sentinel-1 (fig.15) shows the collapsed area that may have caused the tsunami. The whole island did not move down for the coastline before and after is the same everywhere except in the collapsed area.
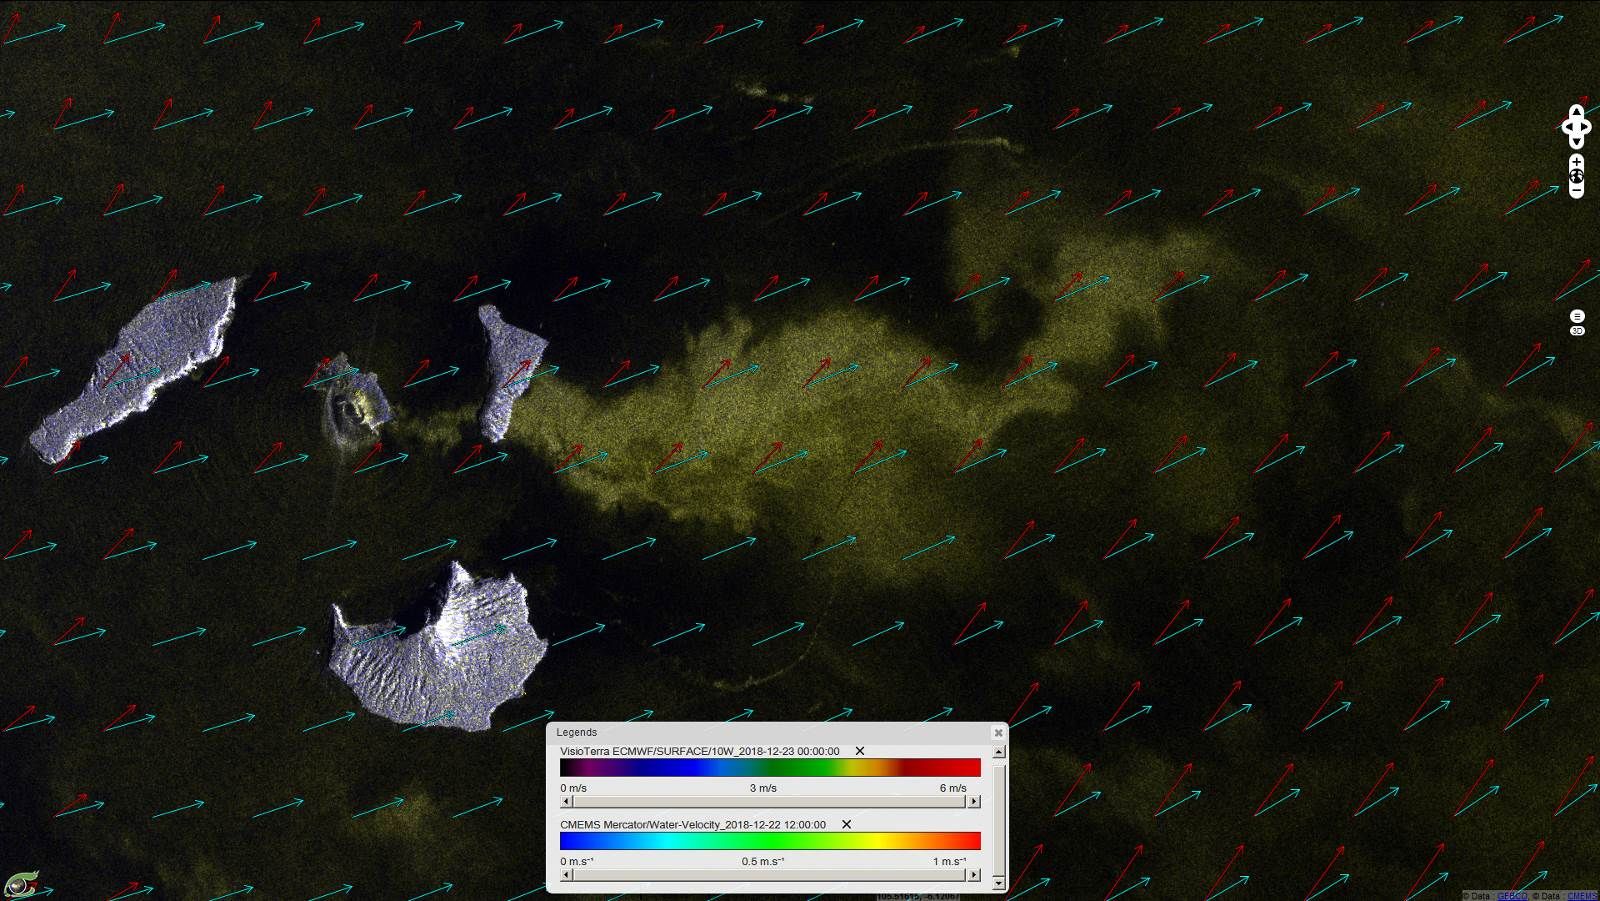
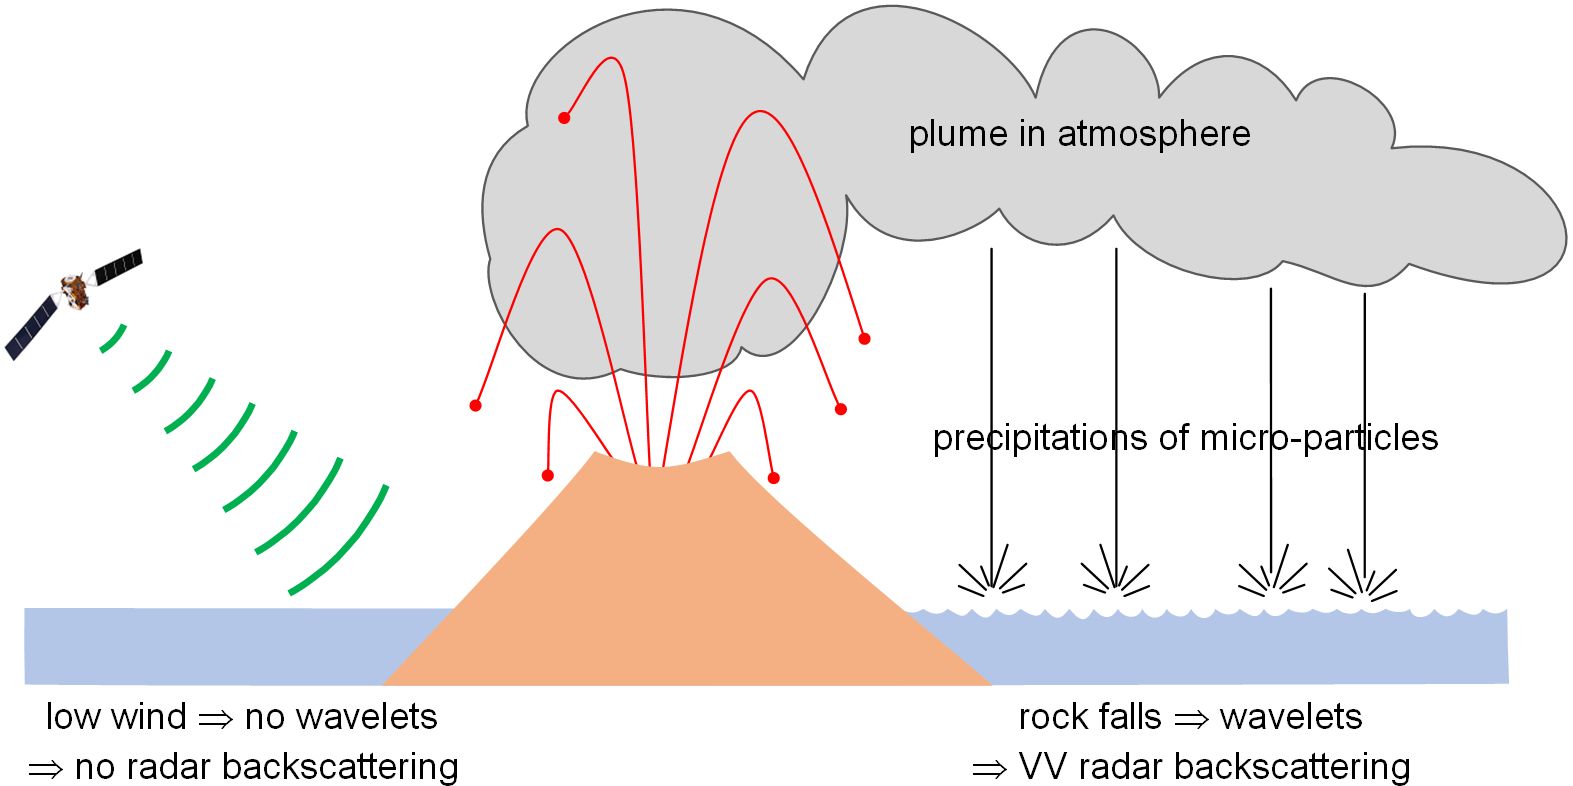
According to Professor Jean Chorowicz, the plume observed on December 22, 2018 in the radar image (fig.16) is not the atmospheric plume itself for it does not show-up over the Panjang island and clouds of water or micro-particles are almost transparent to radar. The sea surface is rough under the panache because the rock fragments that were vertically projected up, fell-down according to their size, the bigger (lava bombs, big fragments) over the volcanic cone they construct, others (lapillis, large cinder particles) farther east in the sea were they are responsible for rough sea surface and consequently higher radar backscatter (see explanations in fig.7). Farther east, micro-particles do not fall anymore and the panache is not visible in the radar image
Roughness of the sea detected by the radar signal.
According to its effects on the sea surface, this plume is eastwardly carried by the winds as confirmed by the ECMWF Surface Wind Model values set at midnight that same day. The model of ocean surface currents produced by the Copernicus Marine Service (CMEMS) is directed to the northeast and contributes to the drift of the roughed sea surface.
The image acquired on 22 December 2018 (8 hours after the tsunami) also shows concentric waves on the sea surface. According to Professor Jacques-Marie Bardintzeff and Professor Jean Chorowicz these waves may be a reply of the tsunami but they are concentric to the crater, not to the collapsed area. This should signify that they were generated by seismic activity under the volcano. Distal waves were clearly deviated by coast capes.
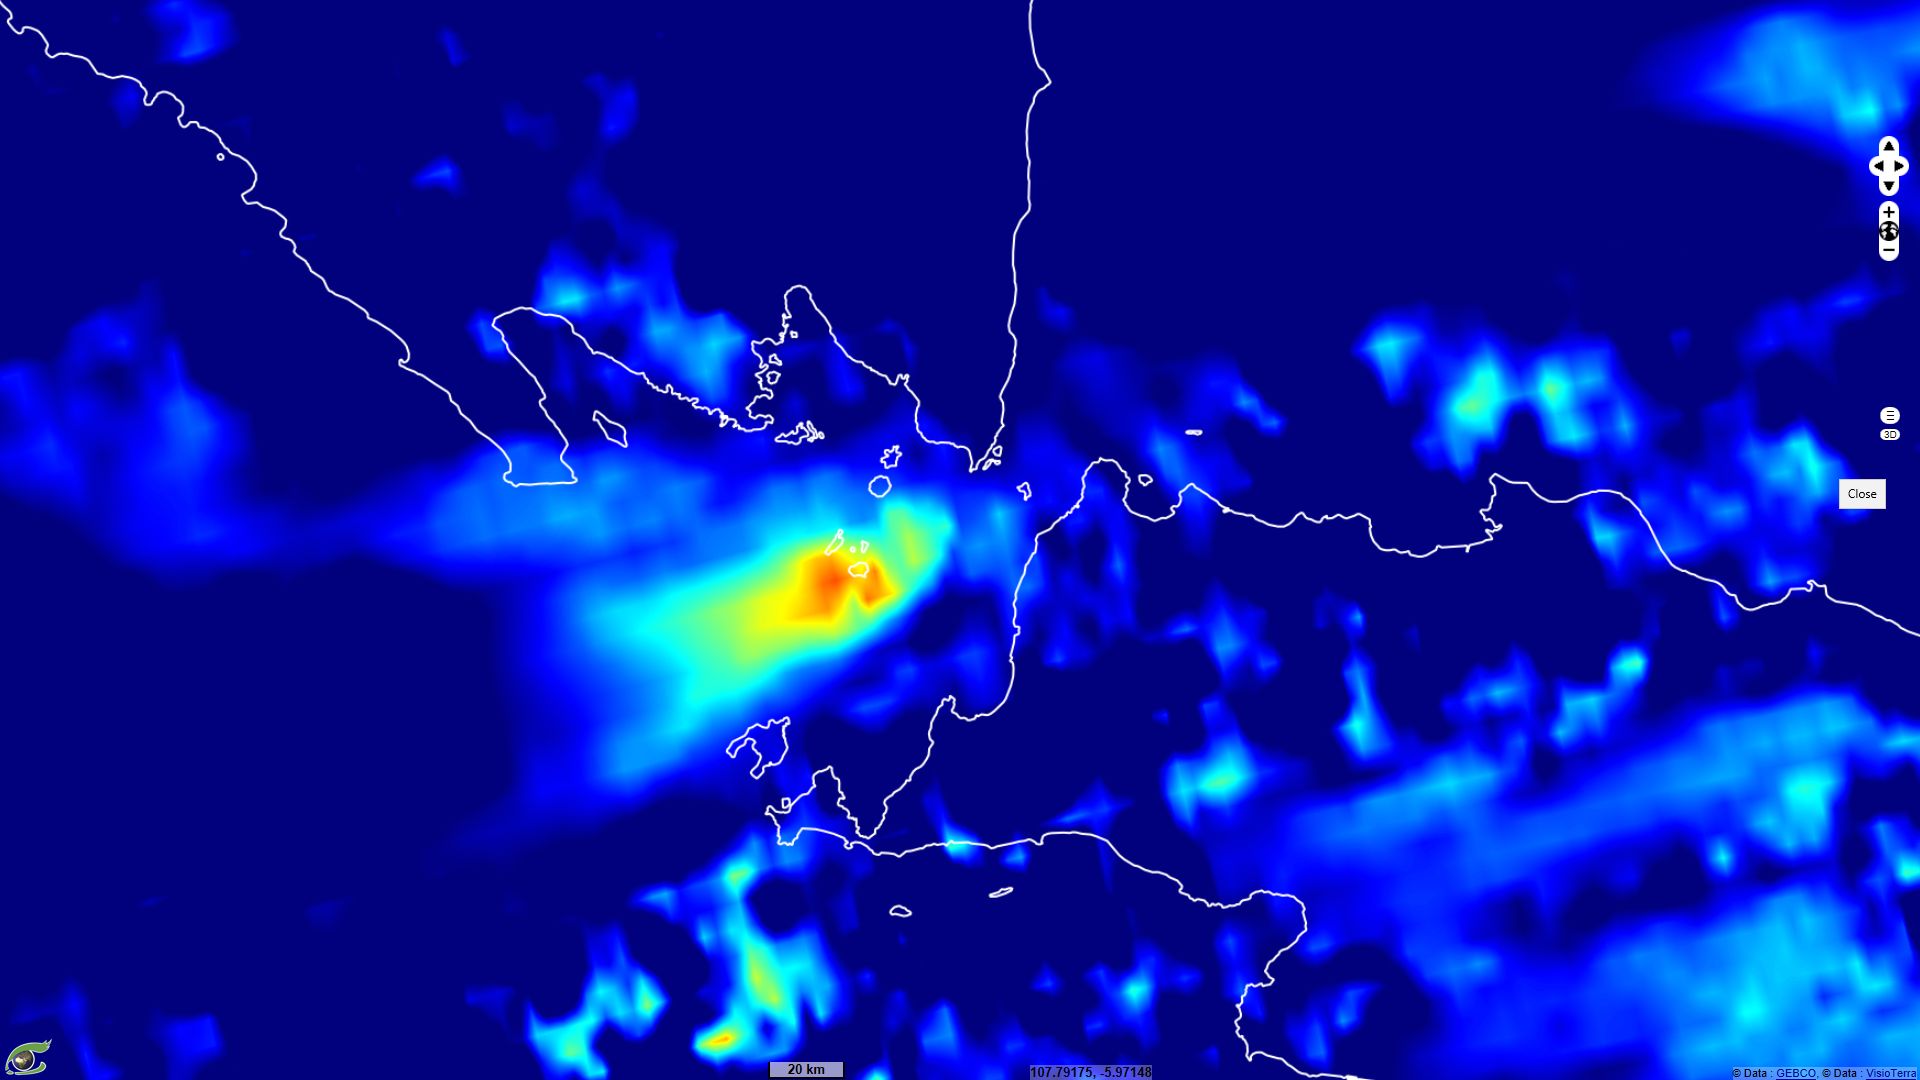
This smoke plume may also be observed from Sentinel-5P satellite and its on-board TROPOMI (TROPOspheric Monitoring Instrument) that is a low spatial resolution absorption spectrometer operating in the UV, visible, NIR and SWIR domains.
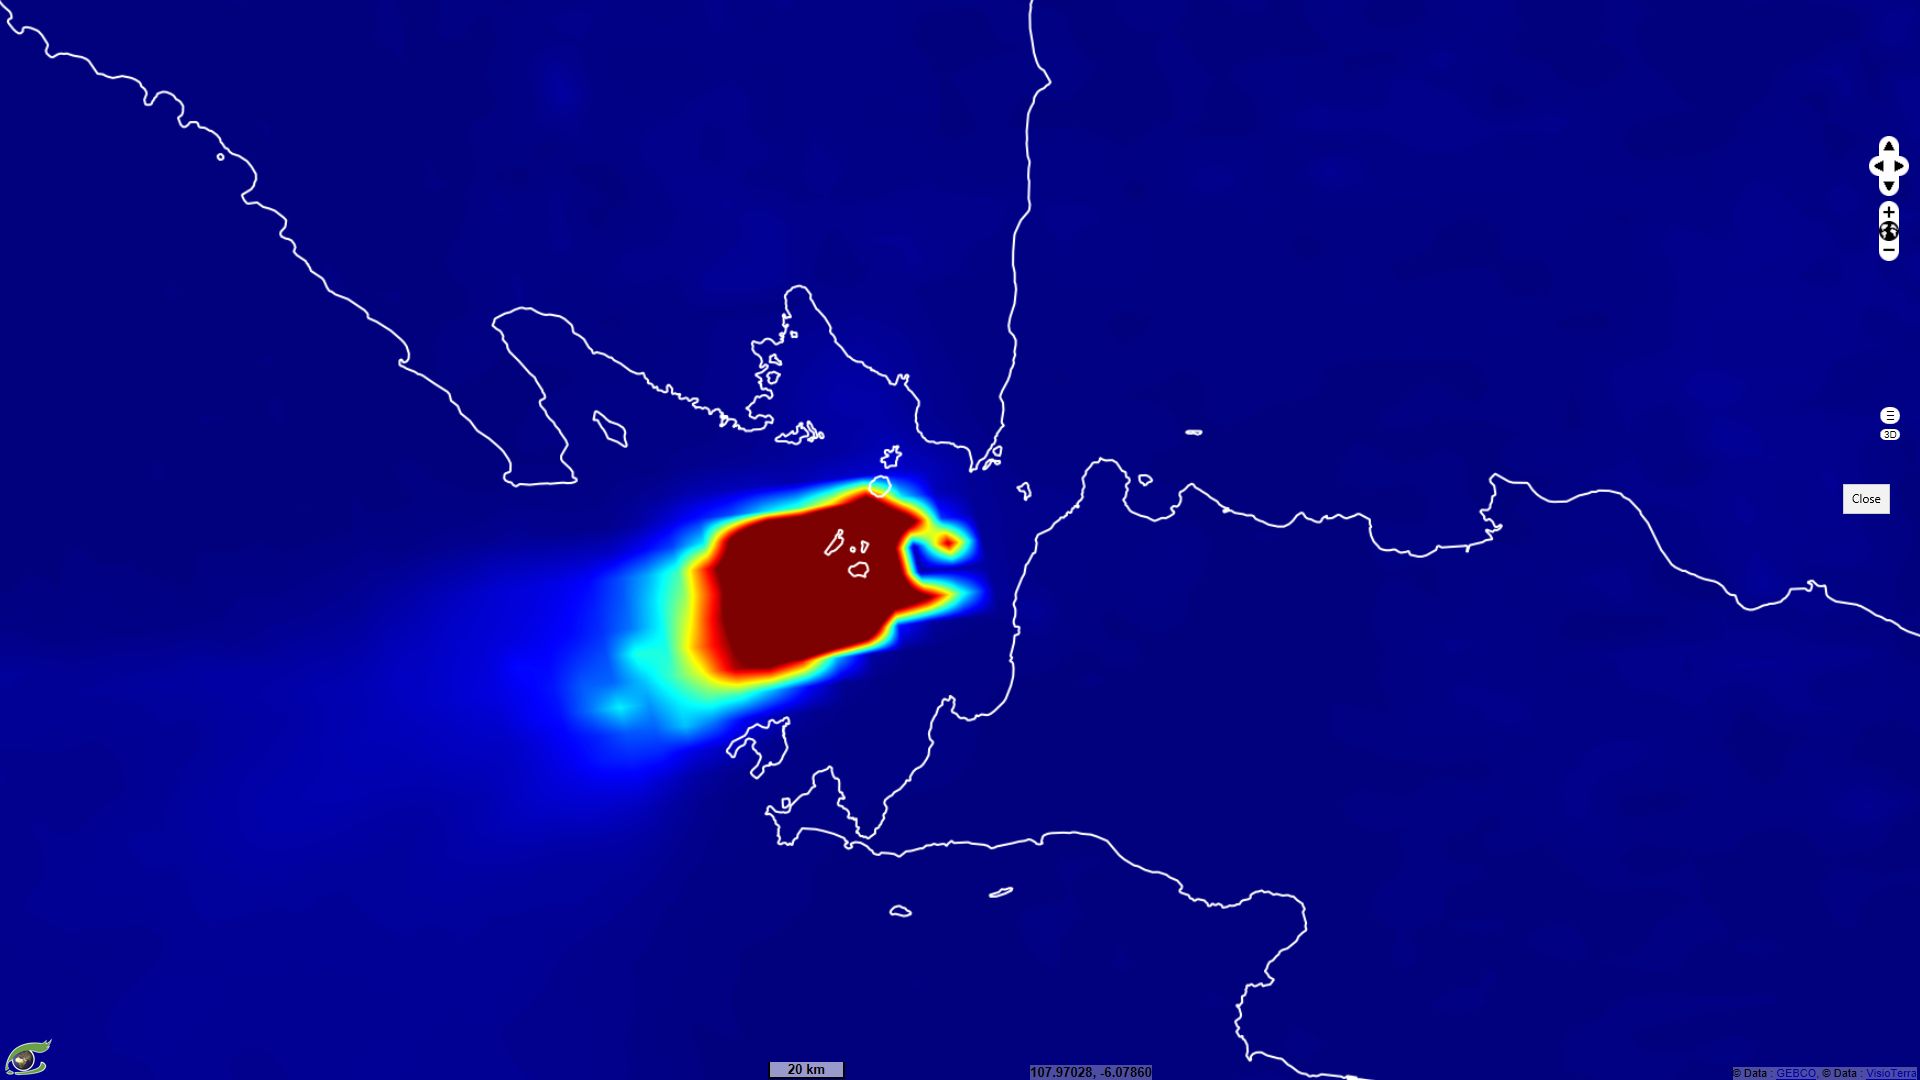
Fig.18 et Fig.19 show the level 2A “Sulphur Dioxide (SO2) total column”. The SO2 emissions reach the maximum in the hours after the tsunami followed by the first eruption (23.12.2018 07:03 UTC). These emissions fade and then a second plume occurs on 26.12.2018 consisting of three clusters. These clusters probably correspond to puffs intermittently released into the atmosphere.
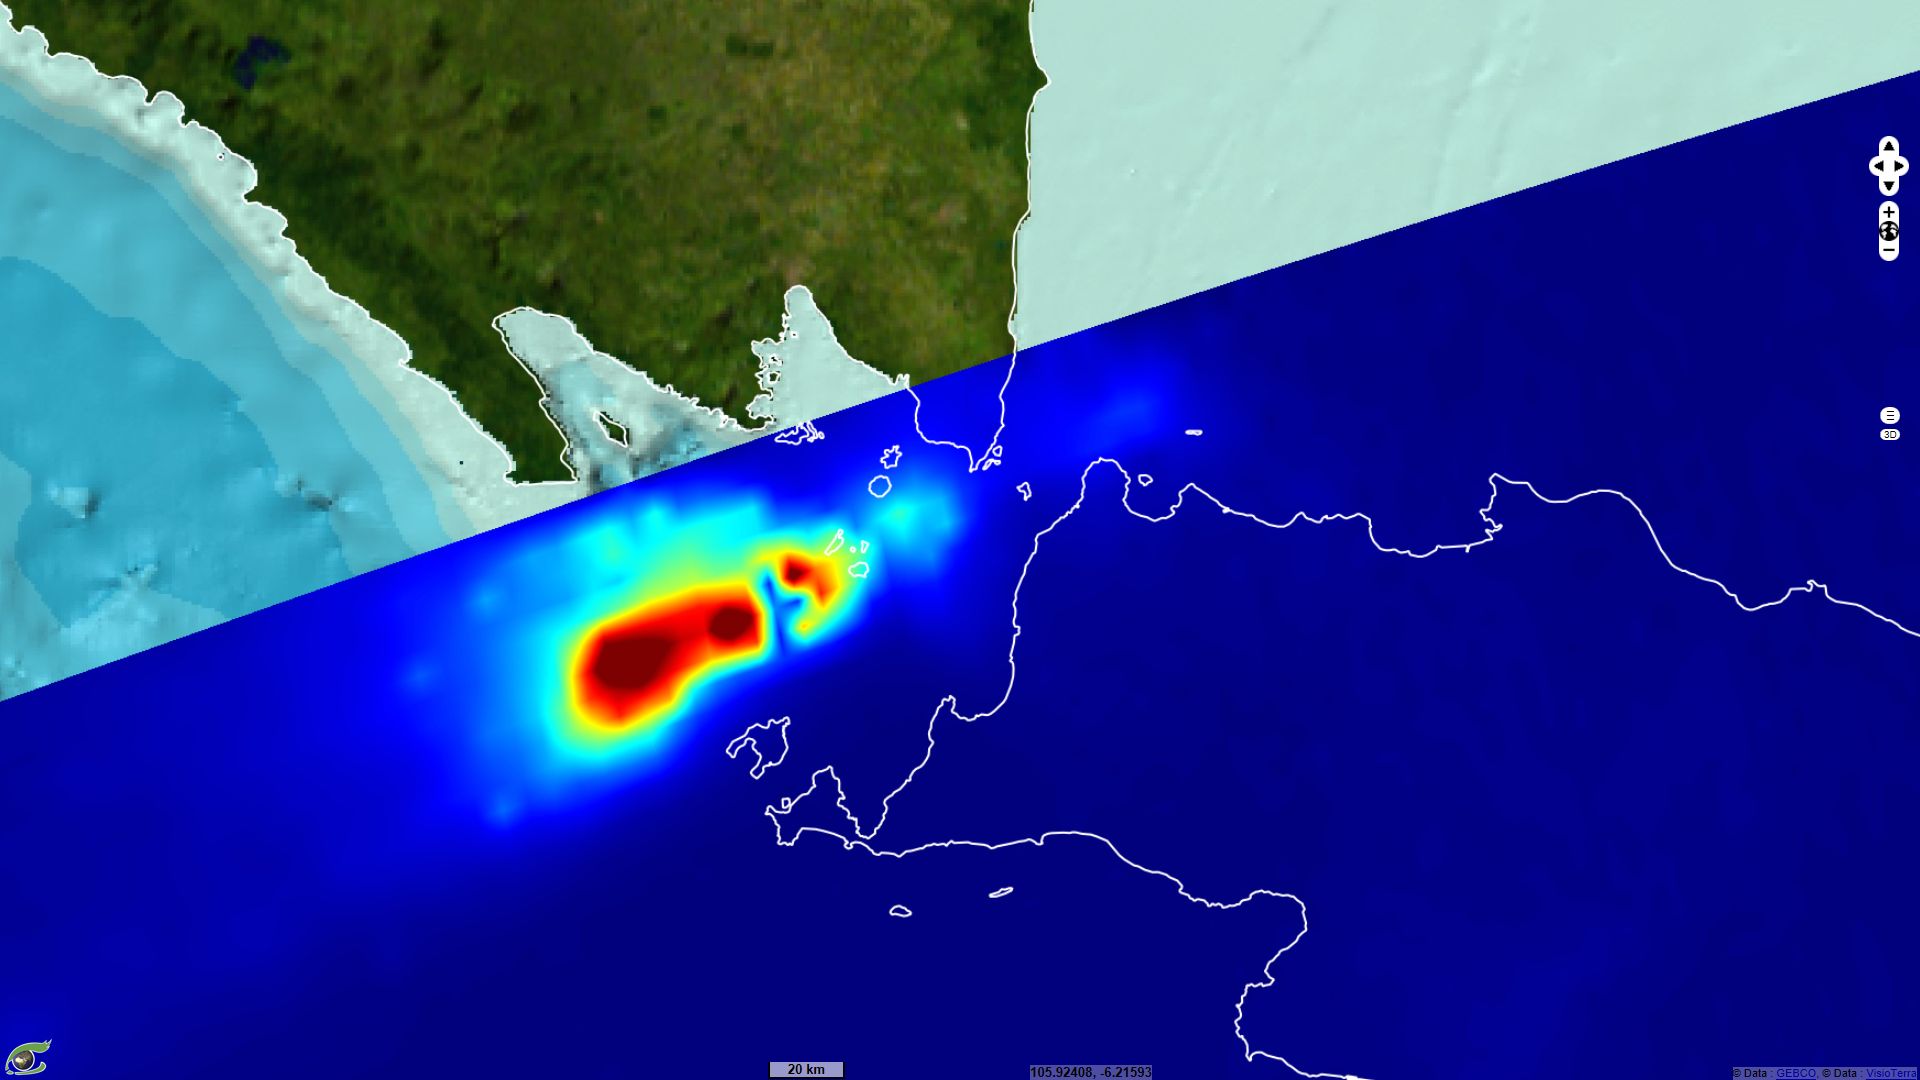
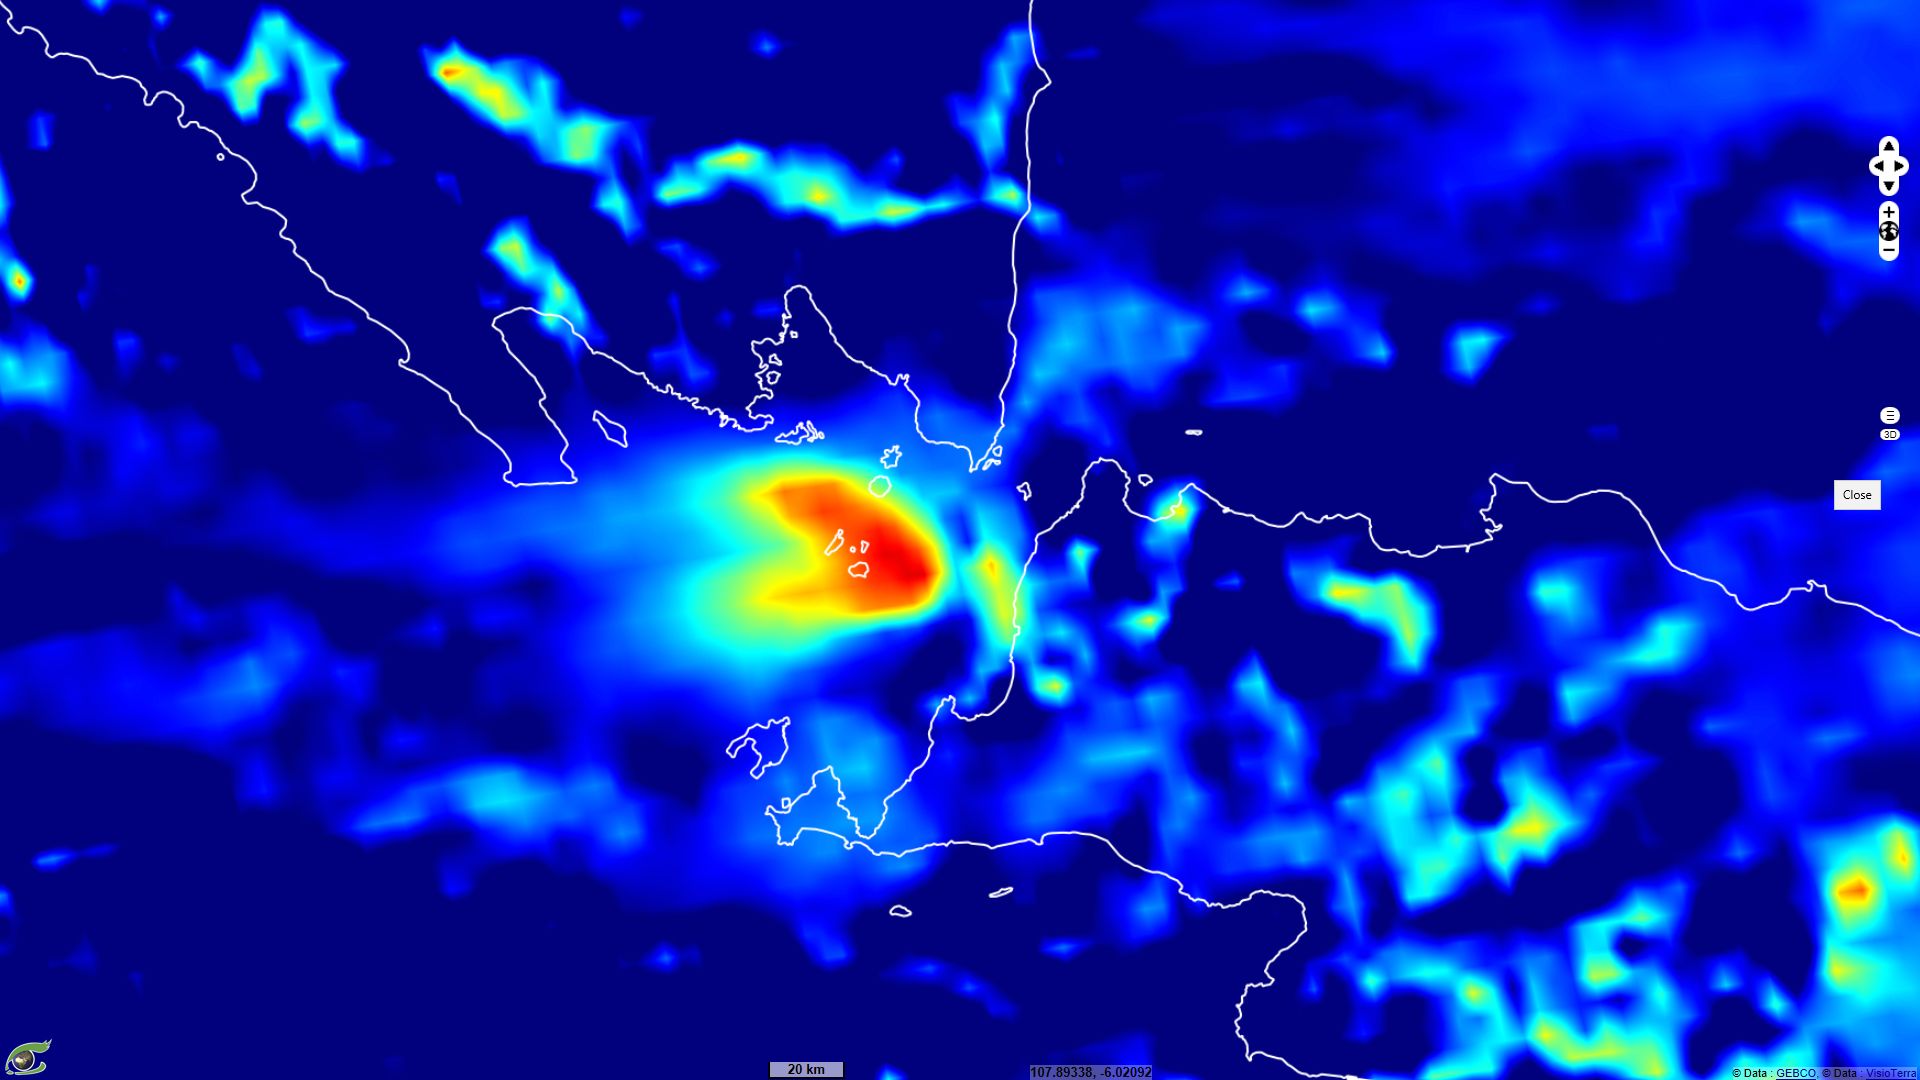
Fig.20 and Fig.21 shows the “UV Aerosol Index” observed one day before and up to 5 days after the tsunami. The aerosol emissions do not know these two phases. The observation of the concentration of aerosols is continuous until December 24 and then decreases until disappearing on December 27, 1818. The 27.12.2018, only a small plume of SO2 persists; it will disappear completely the following days (see the animation).
Satellite imagery is particularly useful for managing humanitarian crises. Several organizations have set up portals to share spatial data (non exhaustive list):
- CMEMS - European Commission through its JRC agency has activated a “Emergency Management Service” (see EMSR335).
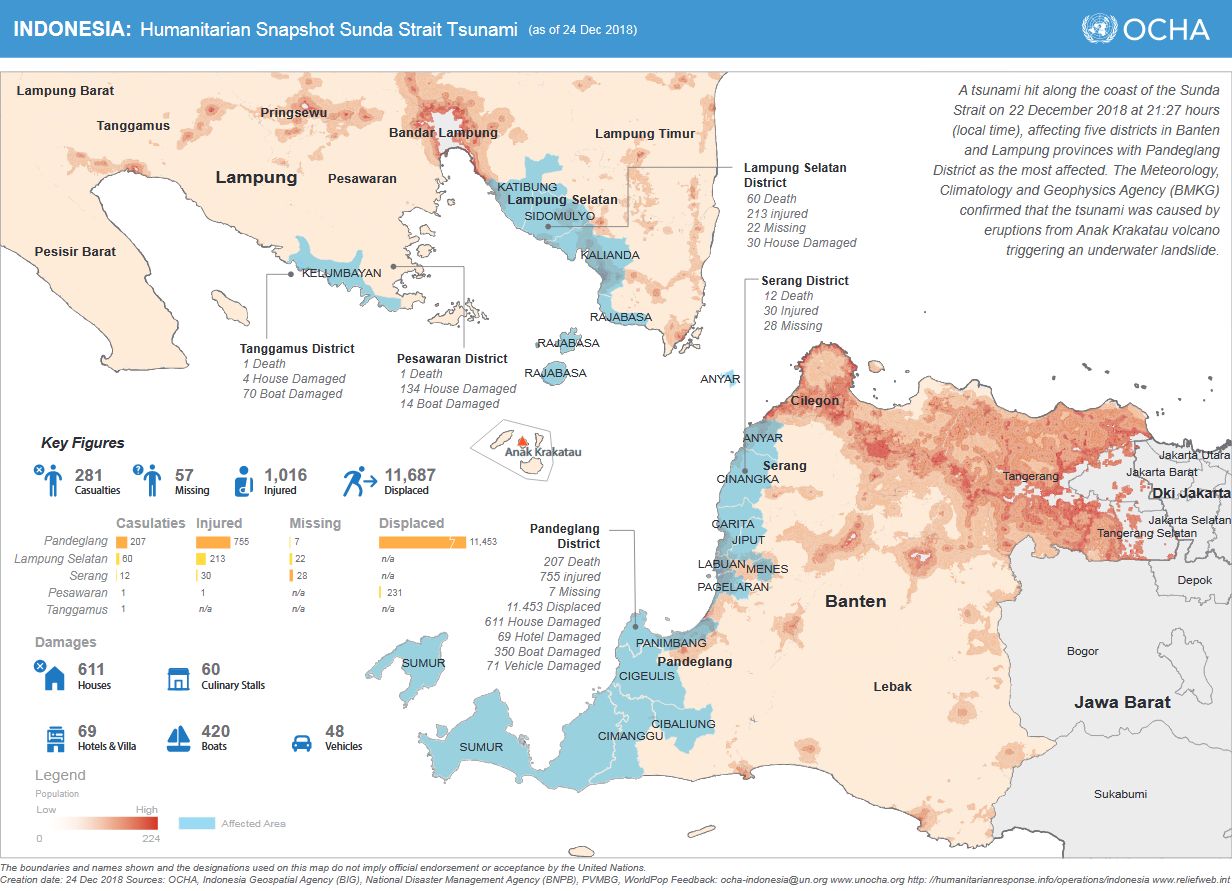
- United Nations - On 24 December 2018, a “UN News” makes a point of the humanitarian situation (see below).
- Disaster Charter - activated on 23 December, a page has been opened with the “activation ID #594”
Map produced by OCHA (Office for the Coordination of Humanitarian Affairs) on 24 December 2018.
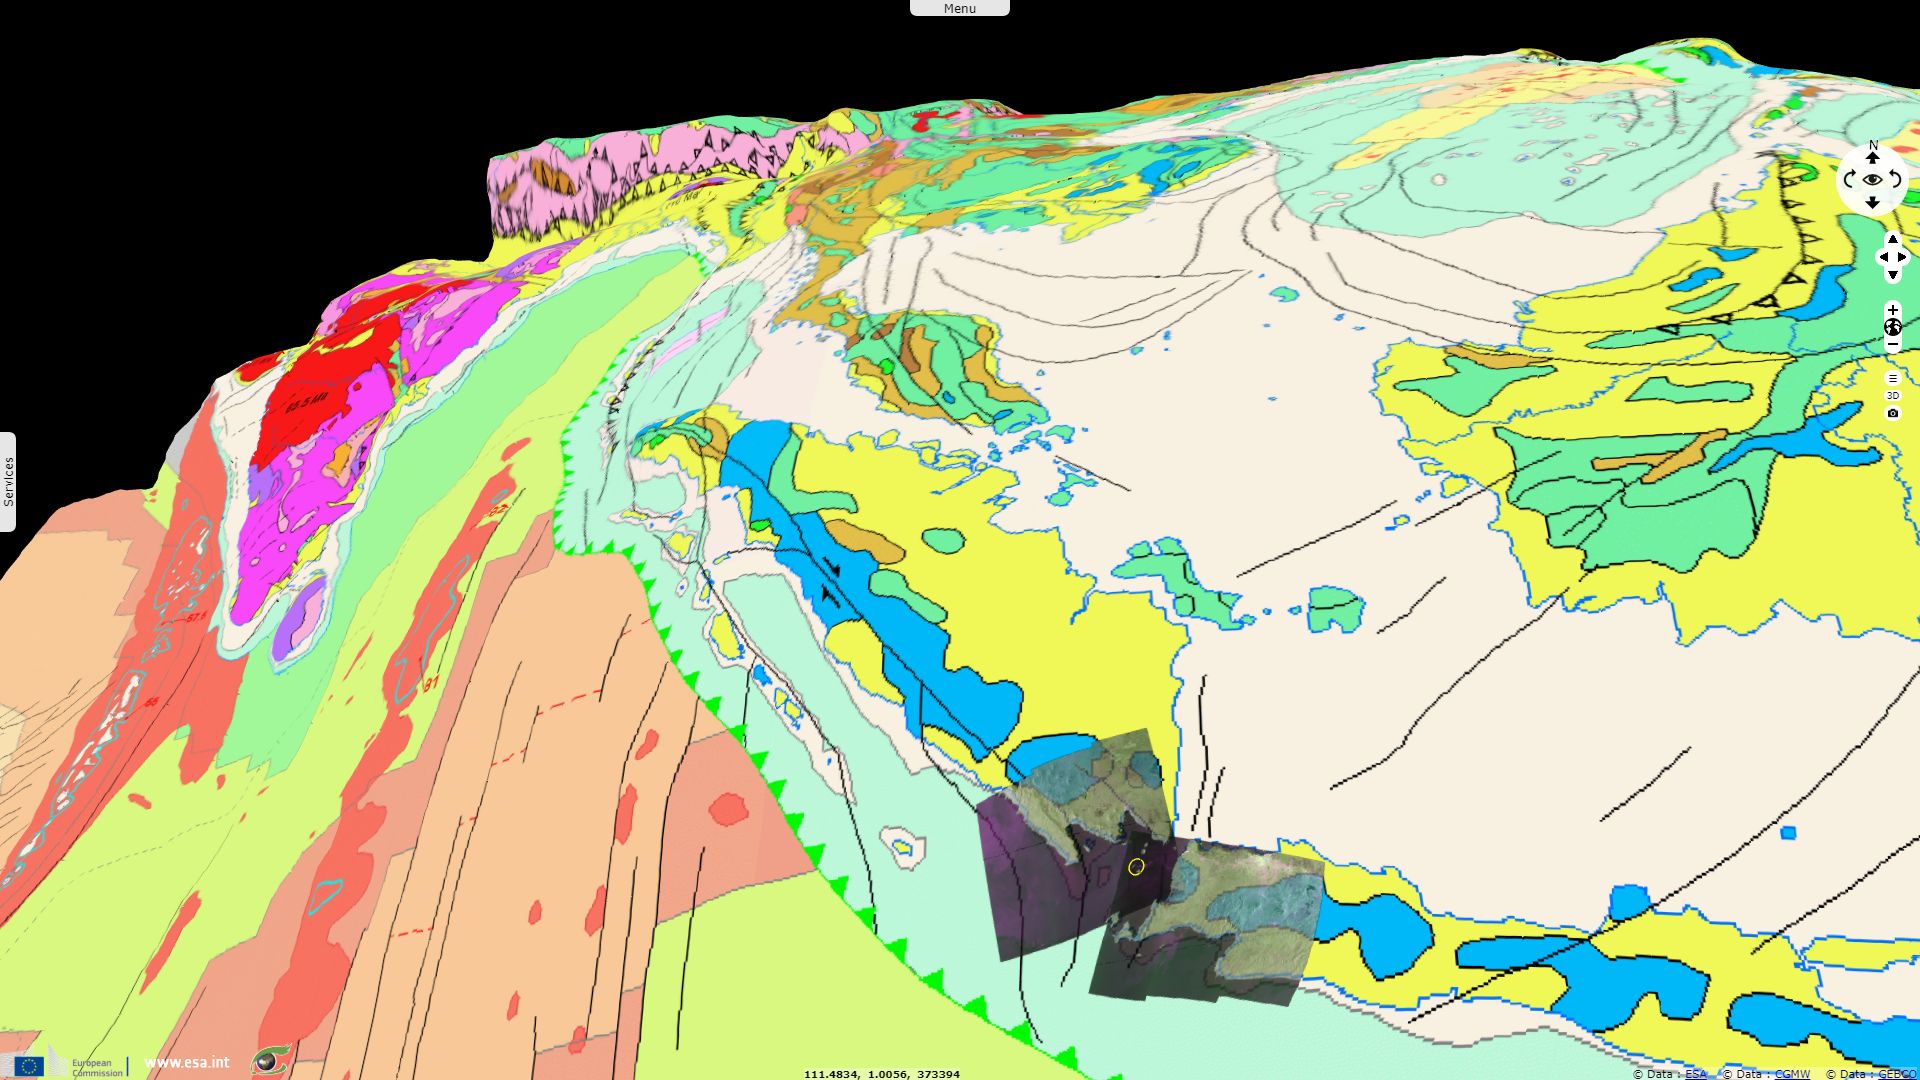
The VtWeb-based Sentinel Vision Portal allows to superimpose in 2D or 3D not only satellite products but also other kind of data such as some of the geological maps made freely available by the “Commission for the Geological Map of the World" (CGMW) in convention with UNESCO.
The oceanic lithosphere of the Indo-Australia plate subducts at high speed (~7 cm/year) in the NNE direction under the active margin of the Sunda block (Eurasia plate). Subsequent partial in-depth melting in the subducting slab produces magmas that are responsible for a volcanic belt (alignment of orange patches in fig.23) including the Krakatau. Large NE-striking faults in the upper plate between Java-Sumatra and Borneo may ease by places the access of the magma to the surface.
The views expressed herein can in no way be taken to reflect the official opinion of the European Space Agency or the European Union.
Contains modified Copernicus Sentinel data 2026, processed by VisioTerra.
Contains modified Copernicus Sentinel data 2026, processed by VisioTerra.
| More on European Commission space: |  |
 |
 |
||||
| More on ESA: | |
|
|
S-1 website | S-2 website | S-3 website | |
| More on Copernicus program: | |
|
|
Scihub portal | Cophub portal | Inthub portal | Colhub portal |
| More on VisioTerra: | |
|
|
Sentinel Vision Portal | Envisat+ERS portal | Swarm+GOCE portal | CryoSat portal |