Vegetation monitoring using Sentinel images
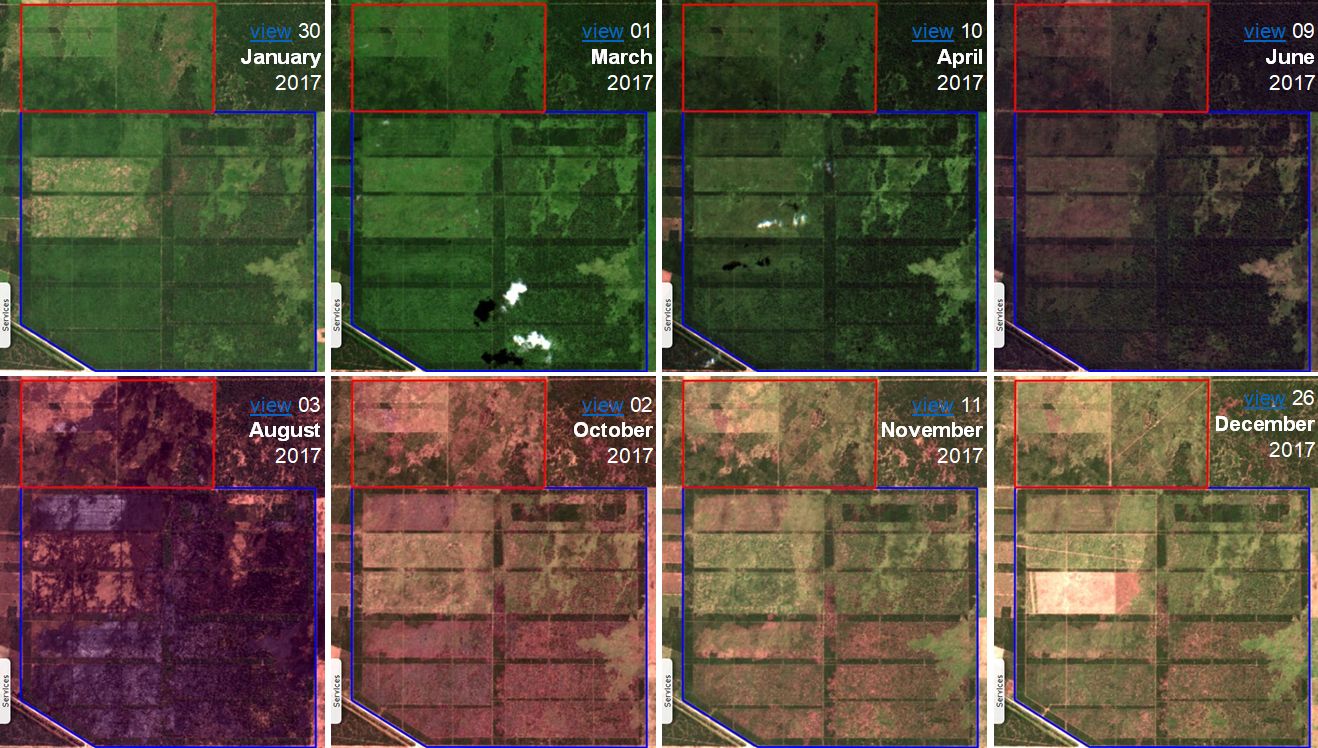
Sentinel-2 MSI acquired on 30 January 2017 at 14:10:41 UTC
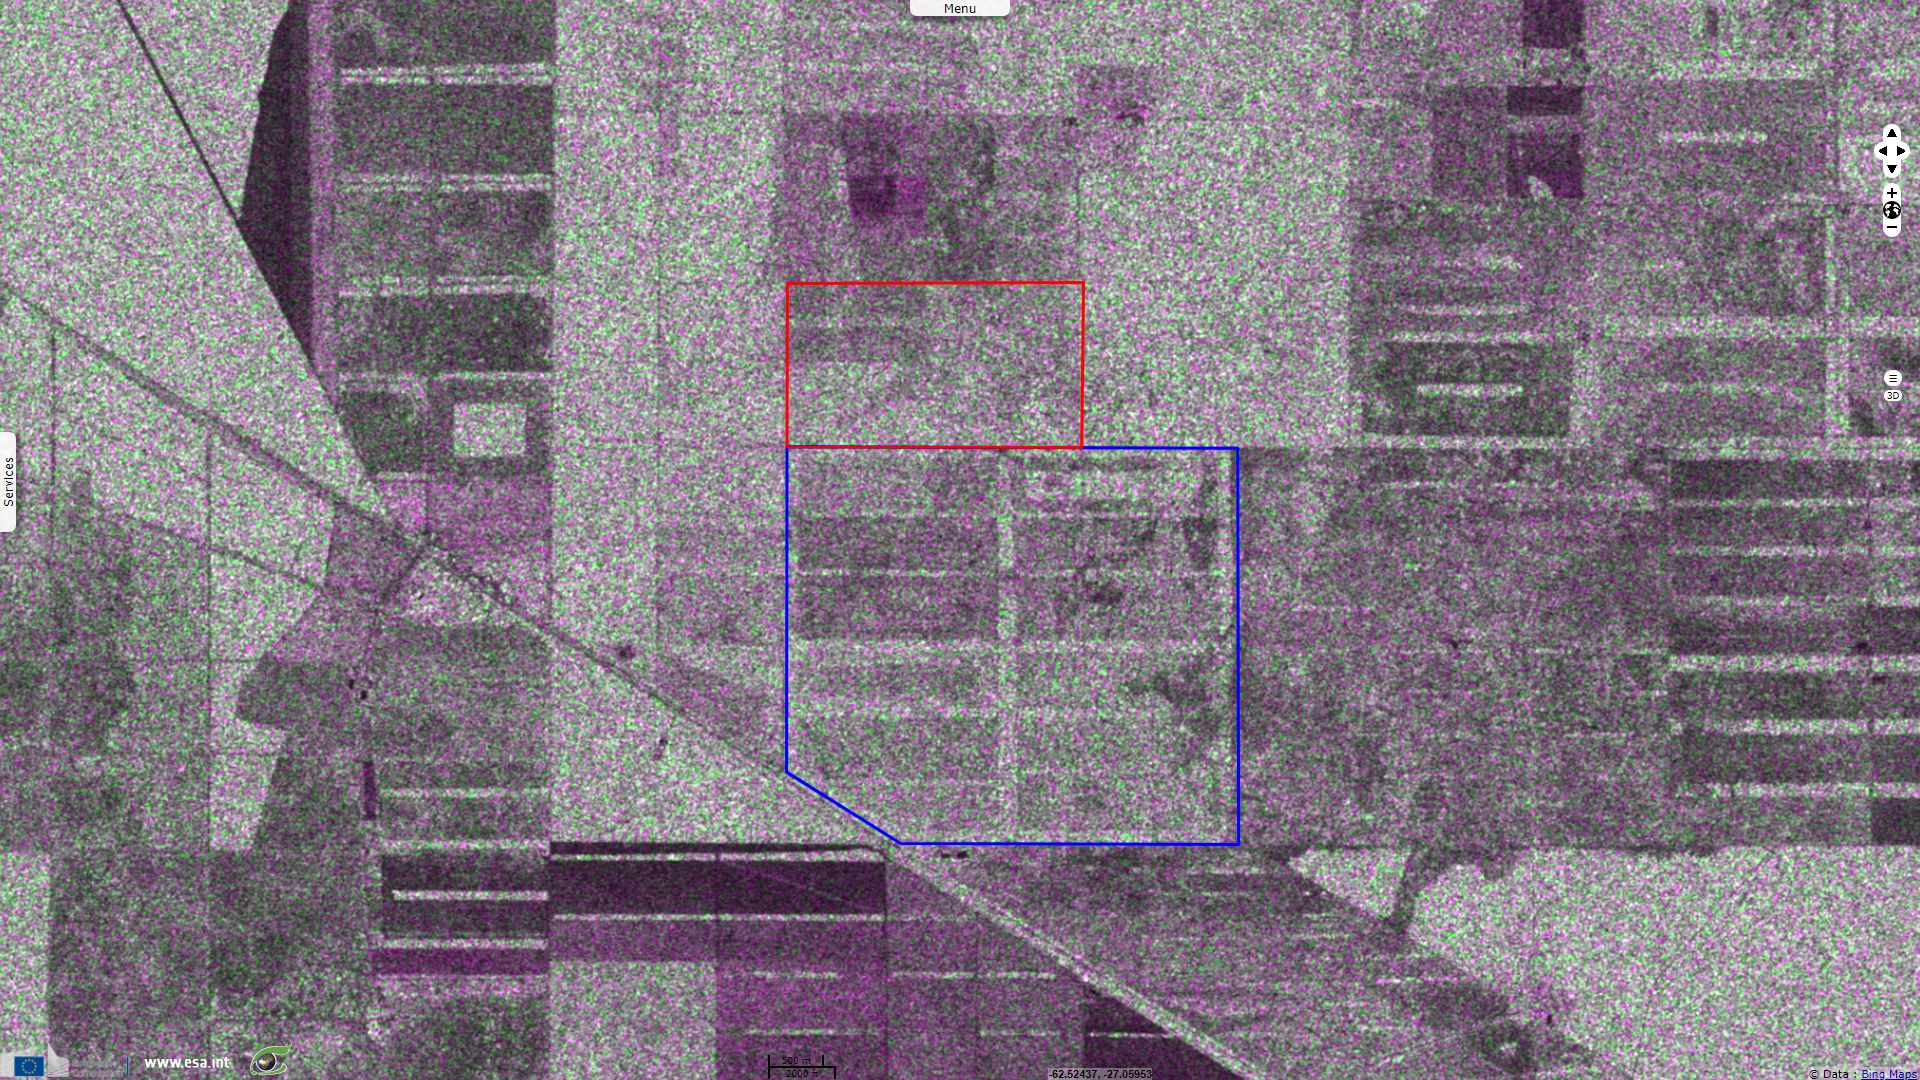
Sentinel-1 CSAR IW acquired on 31 January 2017 at 09:28:35 UTC
...
Sentinel-1 CSAR IW acquired on 30 December 2017 at 22:47:40 UTC
Sentinel-1 CSAR IW acquired on 31 January 2017 at 09:28:35 UTC
...
Sentinel-1 CSAR IW acquired on 30 December 2017 at 22:47:40 UTC
Keyword(s): Land, vegetation monitoring, agriculture, cropland, farming, biomass, chlorophyll, photosynthesis, dryness, wetness, water, irrigation, fertilizer, inputs, Argentina
Absorption spectrum of chloroplast chlorophyll a and b and carotenoids along with the action spectrum of photosynthesis of a chloroplast - source: John Whitmarsh and Govindjee in "Concepts in Photobiology: Photosynthesis and Photomorphogenesis".
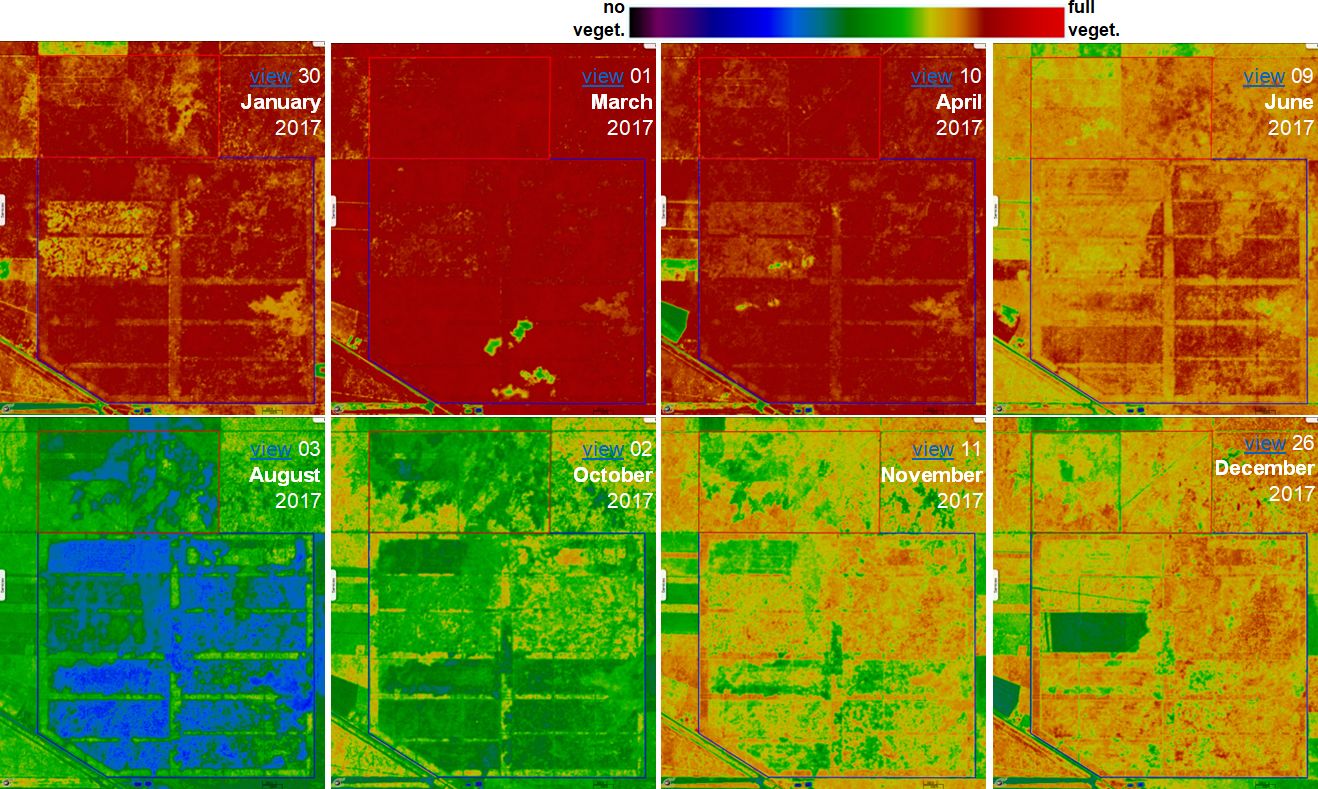
Rouse, Haas and Deering applied what would become the Normalized Difference Vegetation Index (NDVI) in "Monitoring vegetation systems in the Great Plains with ERTS" as soon as 1973. They wrote:
"Radiance values recorded in ERTS-1 spectral bands 5 and 7 were used to compute a Band Ratio Parameter which is shown to be correlated with aboveground green biomass and vegetation moisture content.
For the purposes of this project, the parameter obtained by taking the difference between the radiance values in bands 5 and 7 has been found to be of particular significances. Although other combinations have been found which correlate with vegetation condition, this project has established that bands 5 and 7 do provide a single quantity indicative of the aboveground green biomass, and consequently the present analysis activity has been restricted to this parameter.
The specific parameter employed is the Band Ratio Parameter (BRP) defined as the difference in the ERTS radiance value measured in bands 5 and 7, divided by their sum. The normalization procedure is used to eliminate seasonal sun angle differences and to minimize the effect of atmospheric attenuation."
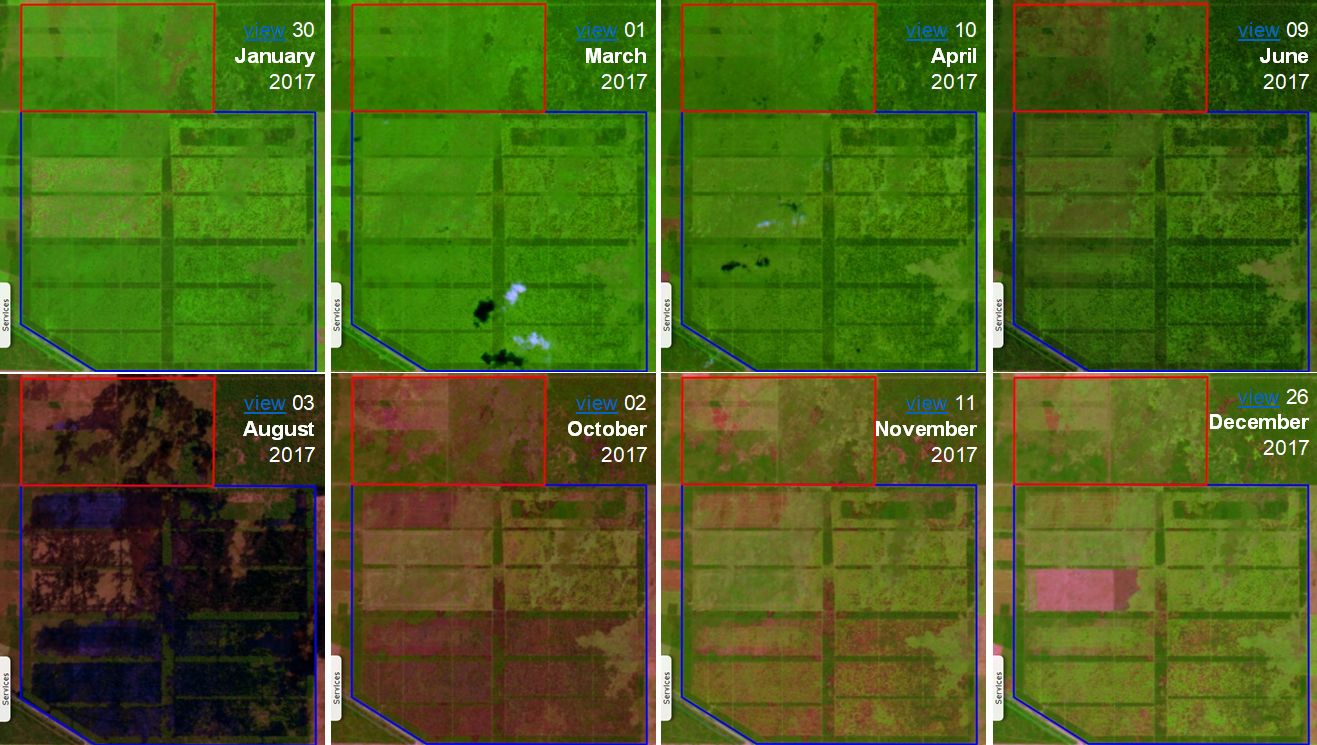
Bo-cai Gao proposed another index designed to quantify parameters in vegetation, the Normalized Difference Water Index (NDWI), in 1996. He explained his choice in "A normalized difference water index for remote sensing of vegetation liquid water from space":
"The red channel is located in the strong chlorophyll absorption region, while the near-IR channel is located in the high reflectance plateau of vegetation canopies. The two channels sense very different depths through vegetation canopies.
In this article, another index, namely, the normalized difference water index (NDWI), is proposed for remote sensing of vegetation liquid water from space. NDWI is defined as (ϱ(0.86 μm) − ϱ(1.24 μm))/(ϱ(0.86 μm) + ϱ(1.24 μm)), where ϱ represents the radiance in reflectance units. Both the 0.86-μm and the 1.24-μm channels are located in the high reflectance plateau of vegetation canopies. They sense similar depths through vegetation canopies. Absorption by vegetation liquid water near 0.86 μm is negligible. Weak liquid absorption at 1.24 μm is present. Canopy scattering enhances the water absorption. As a result, NDWI is sensitive to changes in liquid water content of vegetation canopies.
Atmospheric aerosol scattering effects in the 0.86–1.24 μm region are weak. NDWI is less sensitive to atmospheric effects than NDVI. NDWI does not remove completely the background soil reflectance effects, similar to NDVI. Because the information about vegetation canopies contained in the 1.24-μm channel is very different from that contained in the red channel near 0.66 μm, NDWI should be considered as an independent vegetation index. It is complementary to, not a substitute for NDVI."
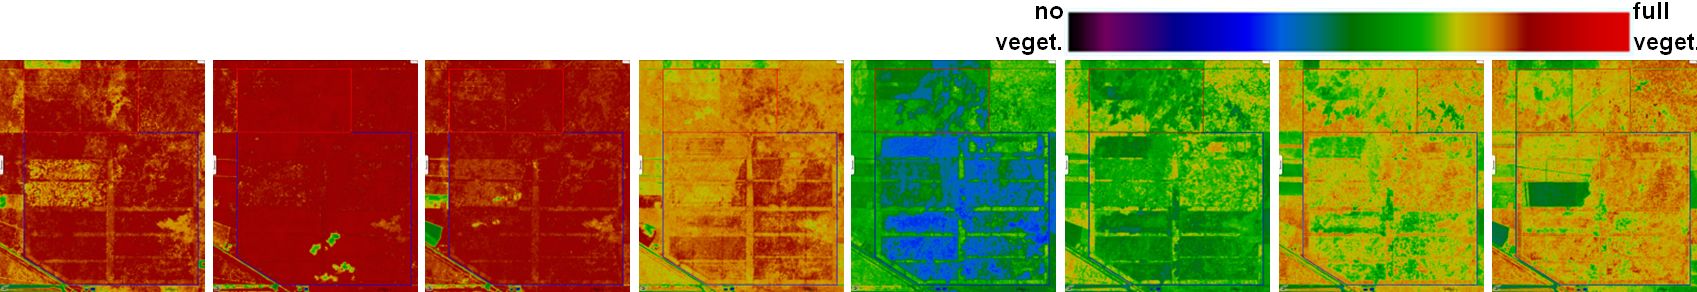
NDVI evolution during 2017
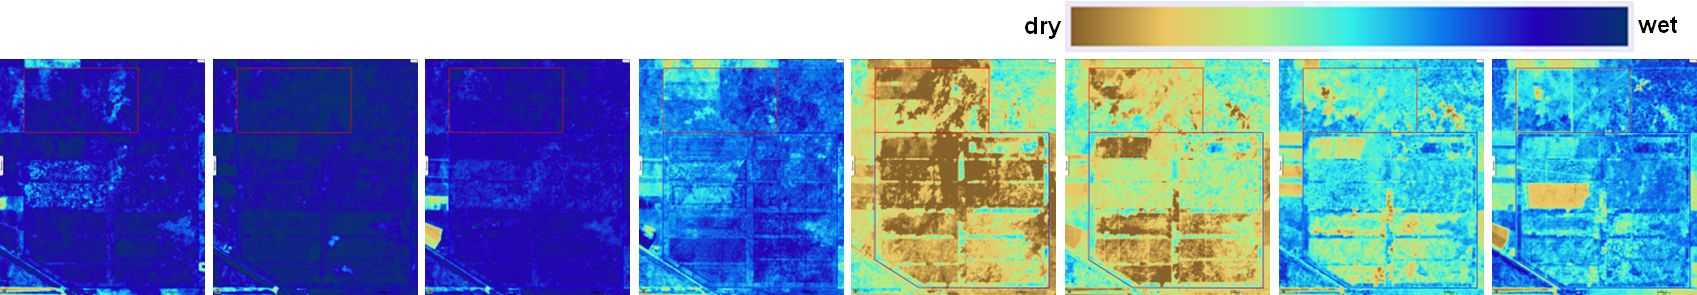
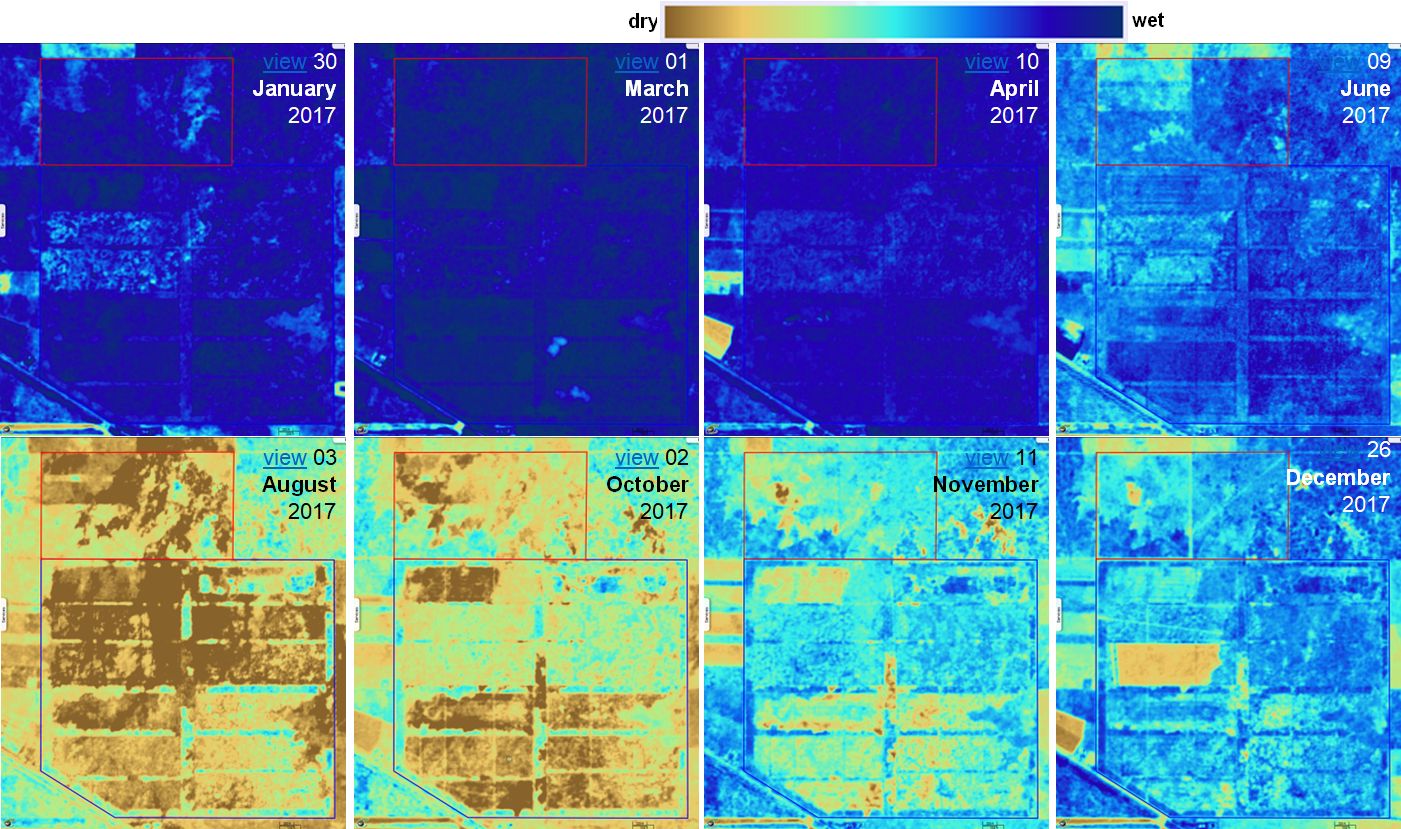
NDWI evolution during 2017
Using data based on crop spectra, remote sensing techniques can be applied to crop monitoring to give information about vegetation health. This allows farmers to reach optimal crop production while minimizing their inputs, water and fertilizers, which is both economical and ecological. The open access, decametric resolution and high repetitivity of Sentinel images has made these techniques economically practicable to a lot more actors.
Announced recently, the update of L2A products is likely to improve the accuracy of these methods, while their worldwide availability is another step toward giving more farmers the means to limit the pollution caused by fertilizers. Among other detrimental impacts, they are known to induce algal and plankton blooms that can cause water eutrophisation.
The views expressed herein can in no way be taken to reflect the official opinion of the European Space Agency or the European Union.
Contains modified Copernicus Sentinel data 2026, processed by VisioTerra.
Contains modified Copernicus Sentinel data 2026, processed by VisioTerra.
| More on European Commission space: |  |
 |
 |
||||
| More on ESA: | |
|
|
S-1 website | S-2 website | S-3 website | |
| More on Copernicus program: | |
|
|
Scihub portal | Cophub portal | Inthub portal | Colhub portal |
| More on VisioTerra: | |
|
|
Sentinel Vision Portal | Envisat+ERS portal | Swarm+GOCE portal | CryoSat portal |