Desertification and Drought Day, exemple in Darfur, Sudan
Sentinel-2 MSI acquired on 08 November 2019 at 08:40:59 UTC
Sentinel-2 MSI acquired on 03 December 2019 at 08:43:31 UTC
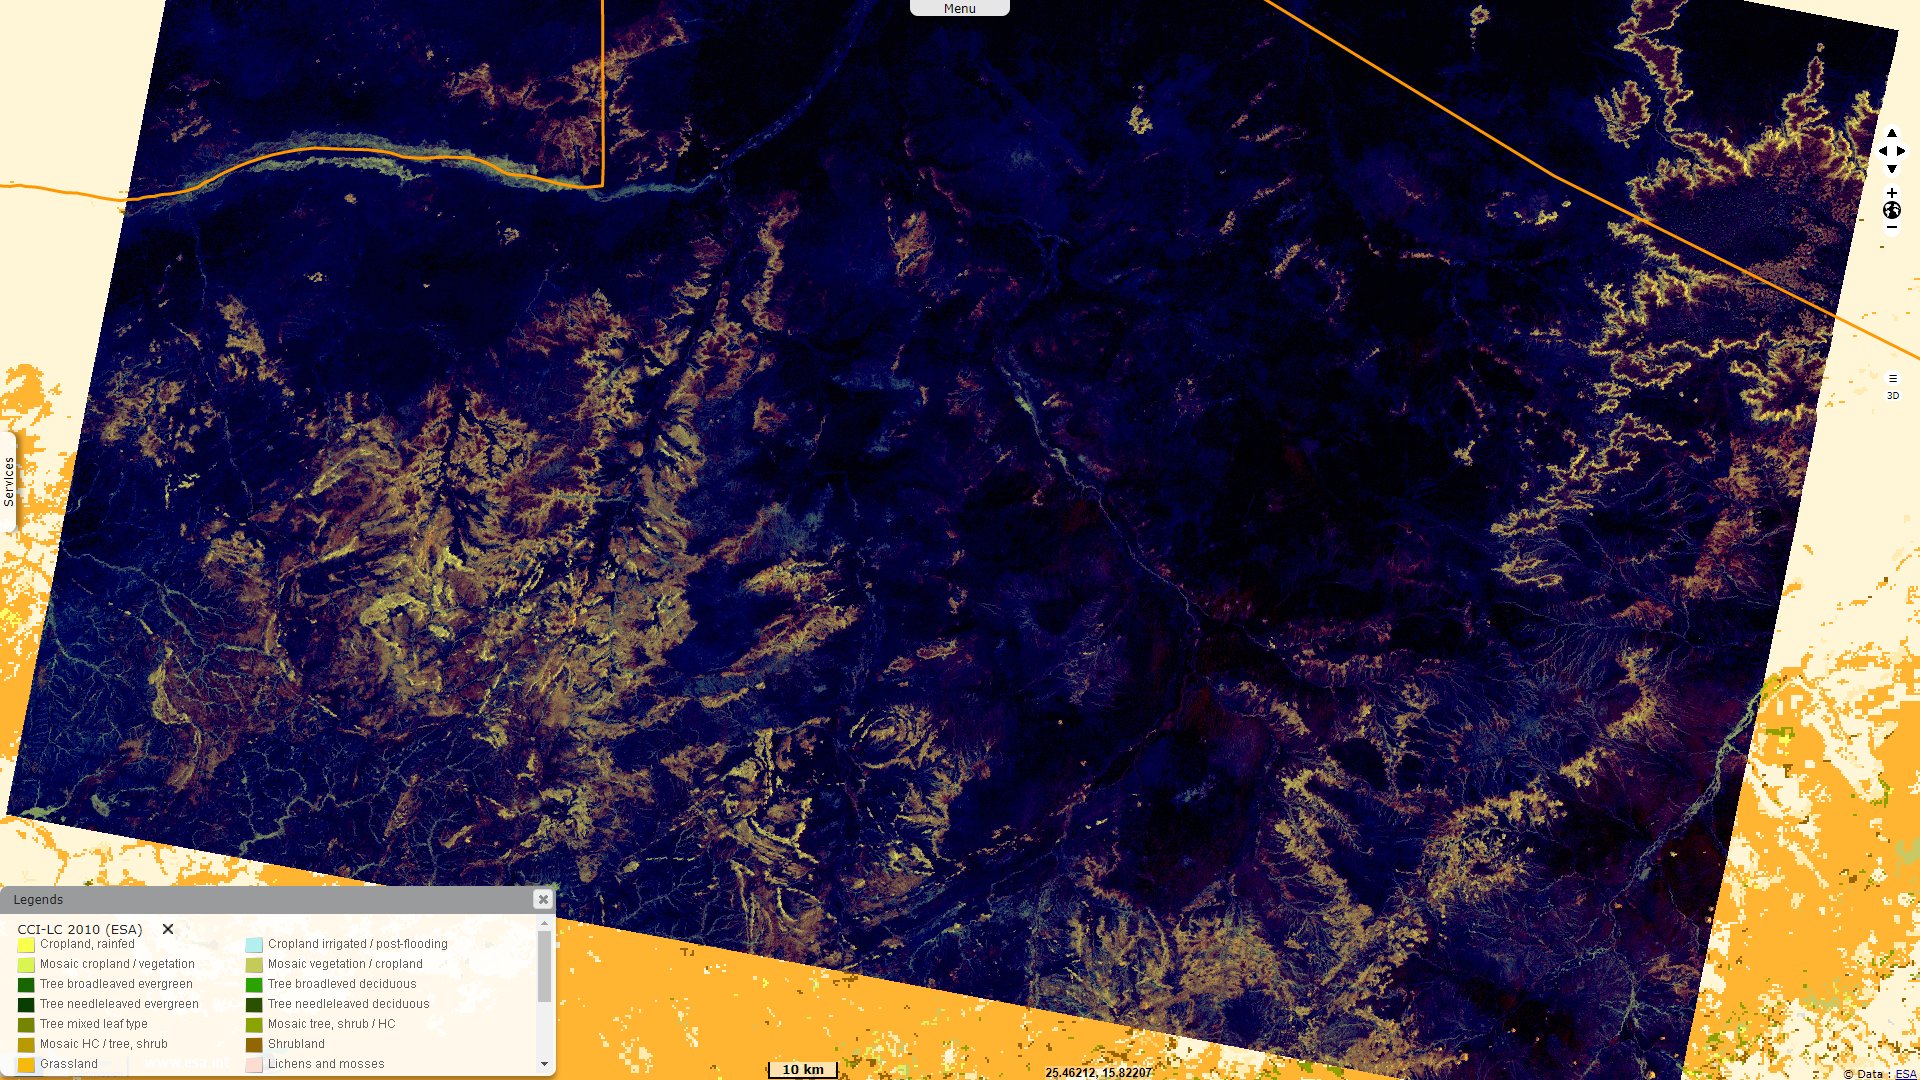
Sentinel-1 CSAR IW acquired on 22 May 2020 at 04:12:40 UTC
Sentinel-3 OLCI FR & SLSTR RBT acquired on 16 June 2020 at 08:07:29 UTC
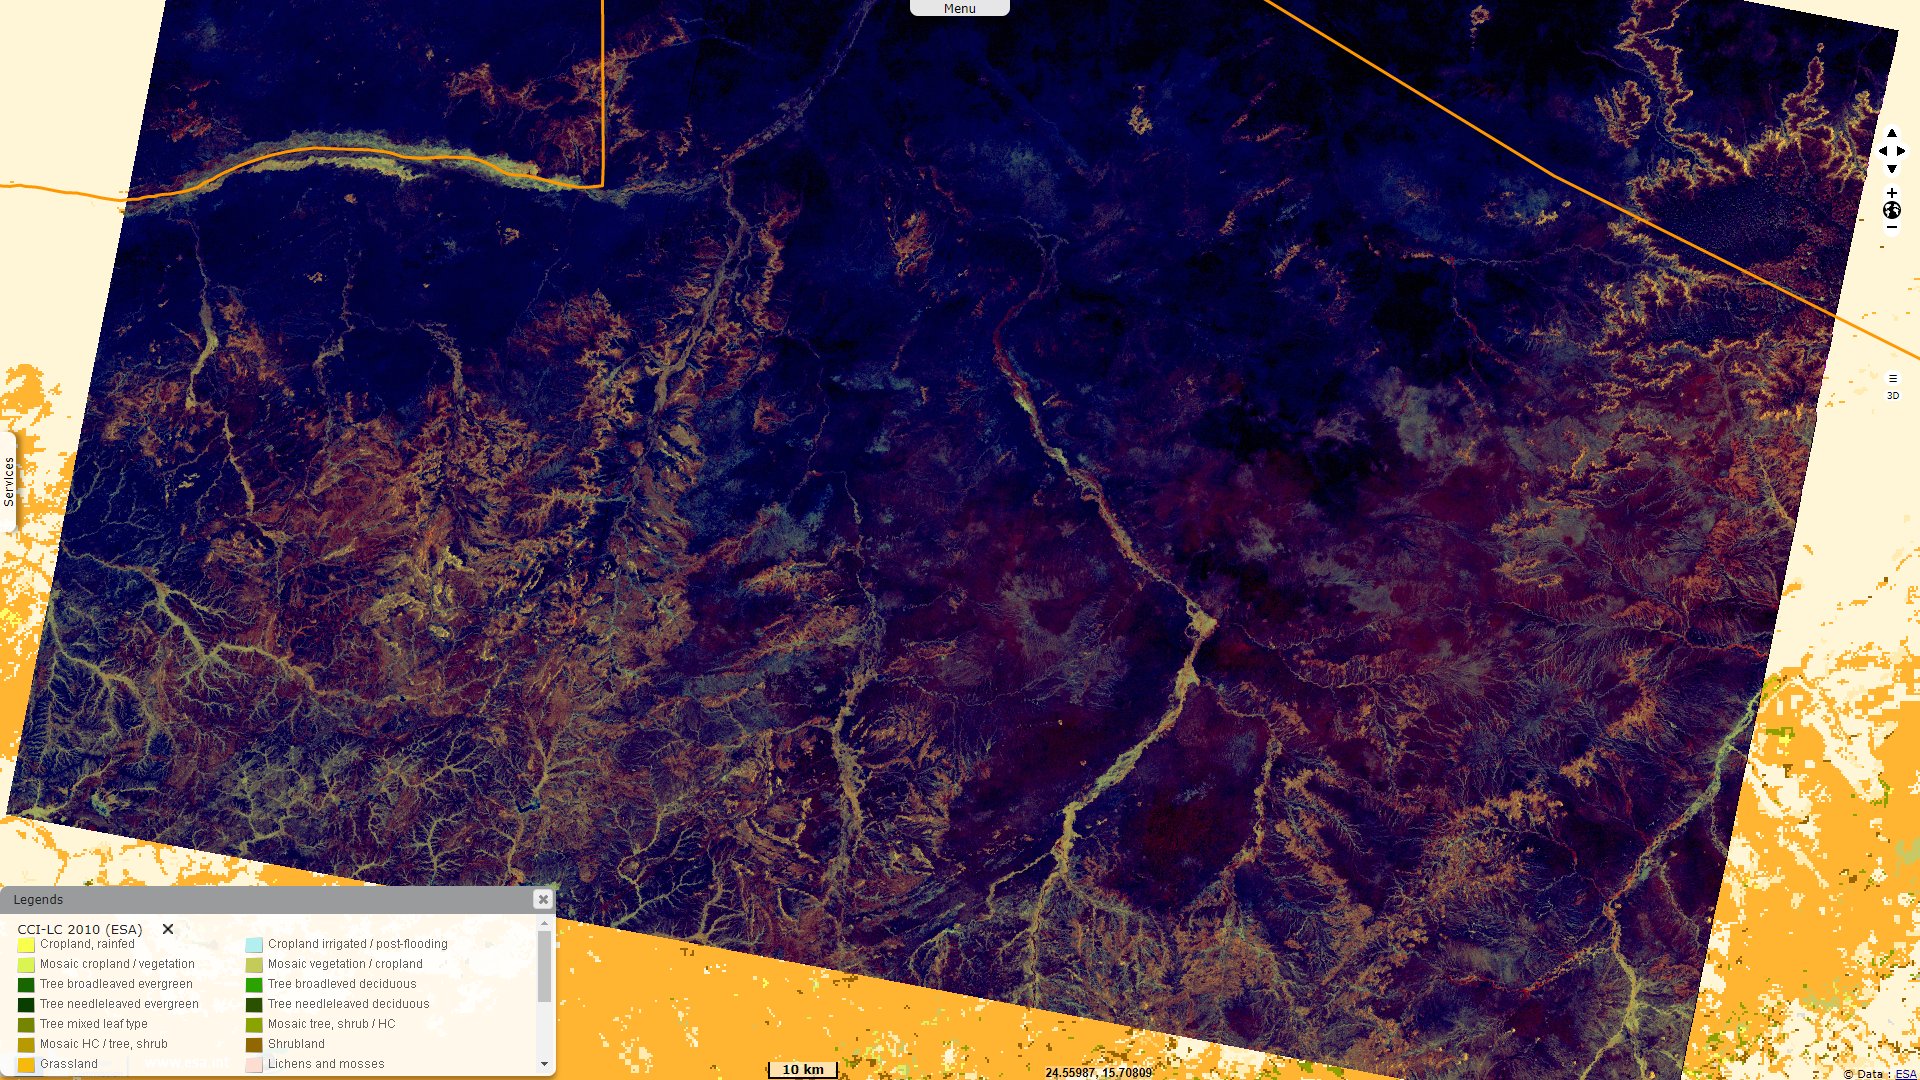
Sentinel-1 CSAR IW acquired on 26 August 2020 at 04:12:46 UTC
Sentinel-2 MSI acquired on 03 December 2019 at 08:43:31 UTC
Sentinel-1 CSAR IW acquired on 22 May 2020 at 04:12:40 UTC
Sentinel-3 OLCI FR & SLSTR RBT acquired on 16 June 2020 at 08:07:29 UTC
Sentinel-1 CSAR IW acquired on 26 August 2020 at 04:12:46 UTC
Keyword(s): Drought, desertification, fire, precipitations, seasons, food security, oil, Great Green Wall, Sudan, Sahel
Food security in the Sahel is a particularly acute problem in south-western Sudan in the Darfur region, which has been in the grip of a civil war for almost 20 years over control of agricultural and oil resources.
Radio France International reported a recent confrontation in the region in early June: Clashes between the African tribe Fallata and the Arab tribe al Ta'aiysha took place. A dispute over agricultural land was at the root of the clashes, according to the official Sudanese agency Suna. The clashes between two opposing tribes left 36 people dead and around 40 injured. The local government has launched an investigation to determine who is responsible for these new and frequent clashes in the South Darfur region over land, water and pasture.
The recurrence of violence in Darfur is one of the many challenges facing the Sudanese transitional government. Last April, 132 people died in tribal clashes in West Darfur. In January, another 250 people died in similar fighting. Since the withdrawal of Minaud, the joint UN-African Union mission in Darfur, at the end of 2020, these clashes have increased.
Arte investigates the particular case of the rebels located in Djebel Marra: Repeatedly bombed, attacked from all sides and besieged by the military, the inhabitants of Jebel Marra live cut off from the world. Unlike other Darfuris, these rebels are not starving. The mountains, rich in water, produce thousands of fruit trees. Cattle grow there without lack of pasture.
It is in order to monopolise this food that the Janjaweeds, the Arab militias under the orders of Omar el-Bechir, the former president of the Republic of Sudan, who was overthrown by a coup d'état in 2019, continue to surround Jebel Marra. These militias, still under the control of the army, are known to occupy the lands of African tribes that they drive out of their homes.
In order to keep their territory, the mountain people have joined together in the Sudan Liberation Army, the last rebel group in Darfur to officially fight the Sudanese military. While the country is still ruled by men involved in the Darfur massacres, the peace dreamed of by the people who inhabit these remote lands remains a distant hope.
This document shows the contribution of satellite data, meteorological and climatic models for the environmental monitoring of a semi-arid zone located on the route of the Great Green Wall. This monitoring is carried out by calculating indicators that characterise land use, the impact of human activity, the results of land restoration efforts and the degree of possible land degradation.
The observations are made by the Sentinel satellites of the European Copernicus programme. The meteorological models are from the ERA5 collection of the Copernicus Climate Change Service (C3S). The hyperlooks describe the on-the-fly processing of the raw data on the VisioTerra servers.
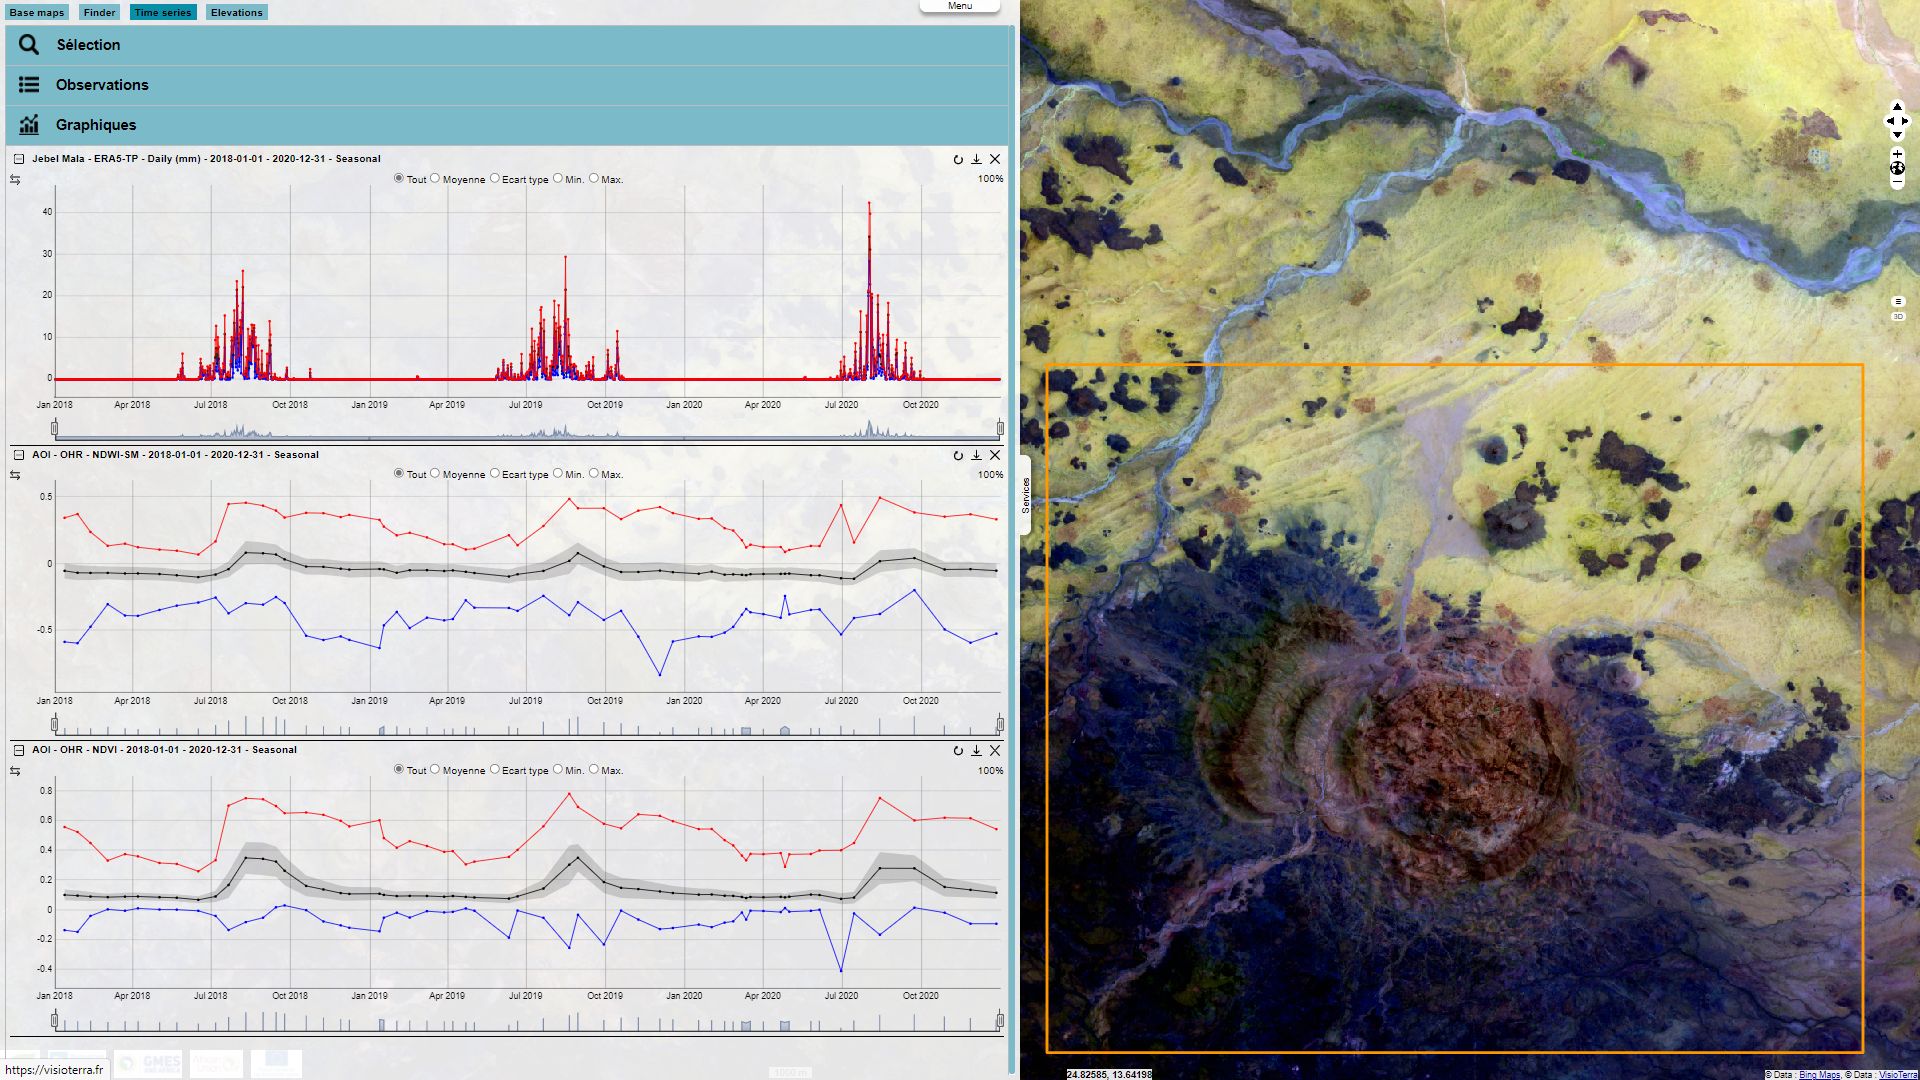
The above figure shows an analysis of multidate series in 2018, 2019 and 2020 of precipitation, surface moisture, vegetation index seen over the years. These indicators were calculated by the MISBAR application in the orange rectangular area. In an operational context, we are interested in a set of plots, multipurpose gardens, reforestation park, set-aside area, etc. The background image is a Sentinel-2 tile observed on 22.05.2018 and rendered in a coloured composite (mid-infrared, near-infrared, blue). The relationship between precipitations and surface moisture can be observed, from which the permeability of the soil and plant activity can be deduced.
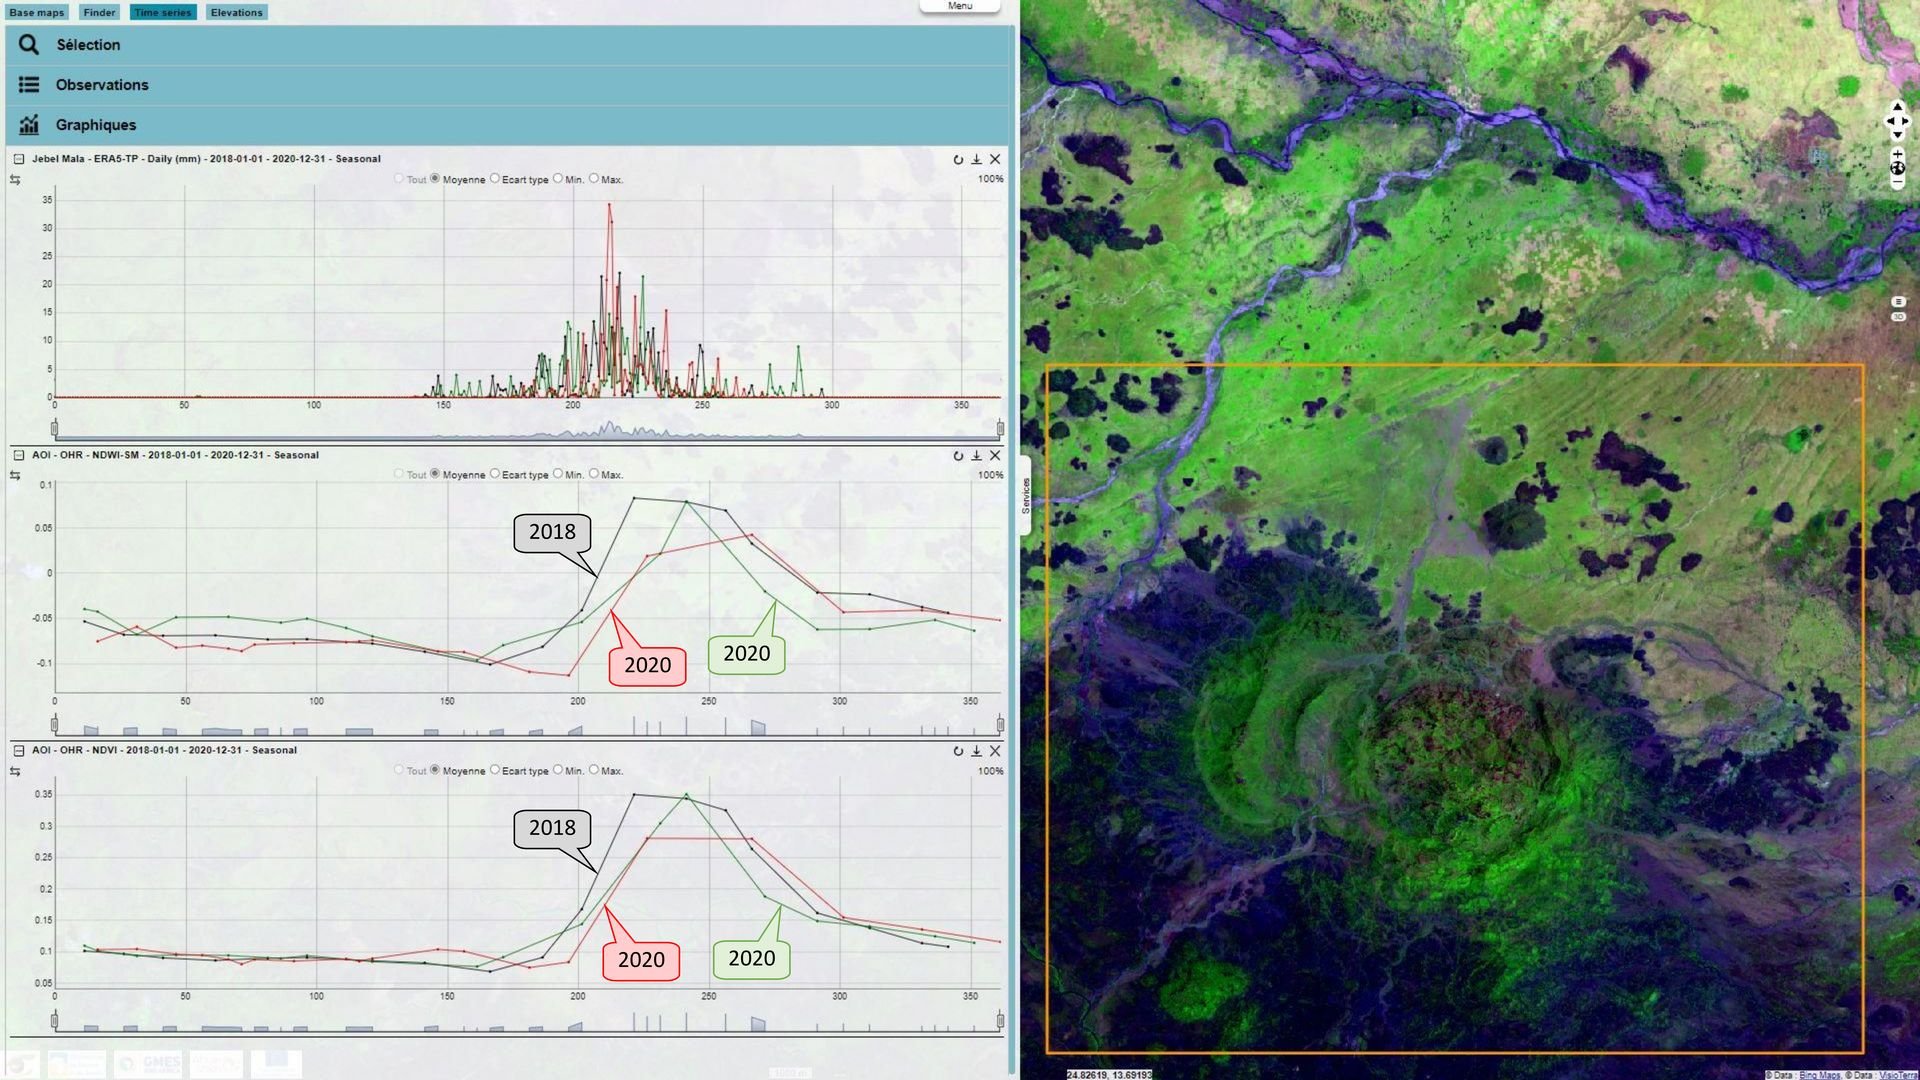
The above figure shows the multi-date series analysis in 2018, 2019 and 2020 of precipitations, surface humidity, vegetation index, this time in seasonal view. Fig.3 is another representation of the measurements in Fig.2. For each of the three indicators, the values from one year to the next are superimposed here to allow comparison. It can be seen that surface moisture, and to a lesser extent vegetation, increased earlier in 2018. In contrast, the wet season was less spread out in 2020. Applied to areas of cultivation or reforestation, these indicators will make it possible to anticipate future yields in the form of early warnings.
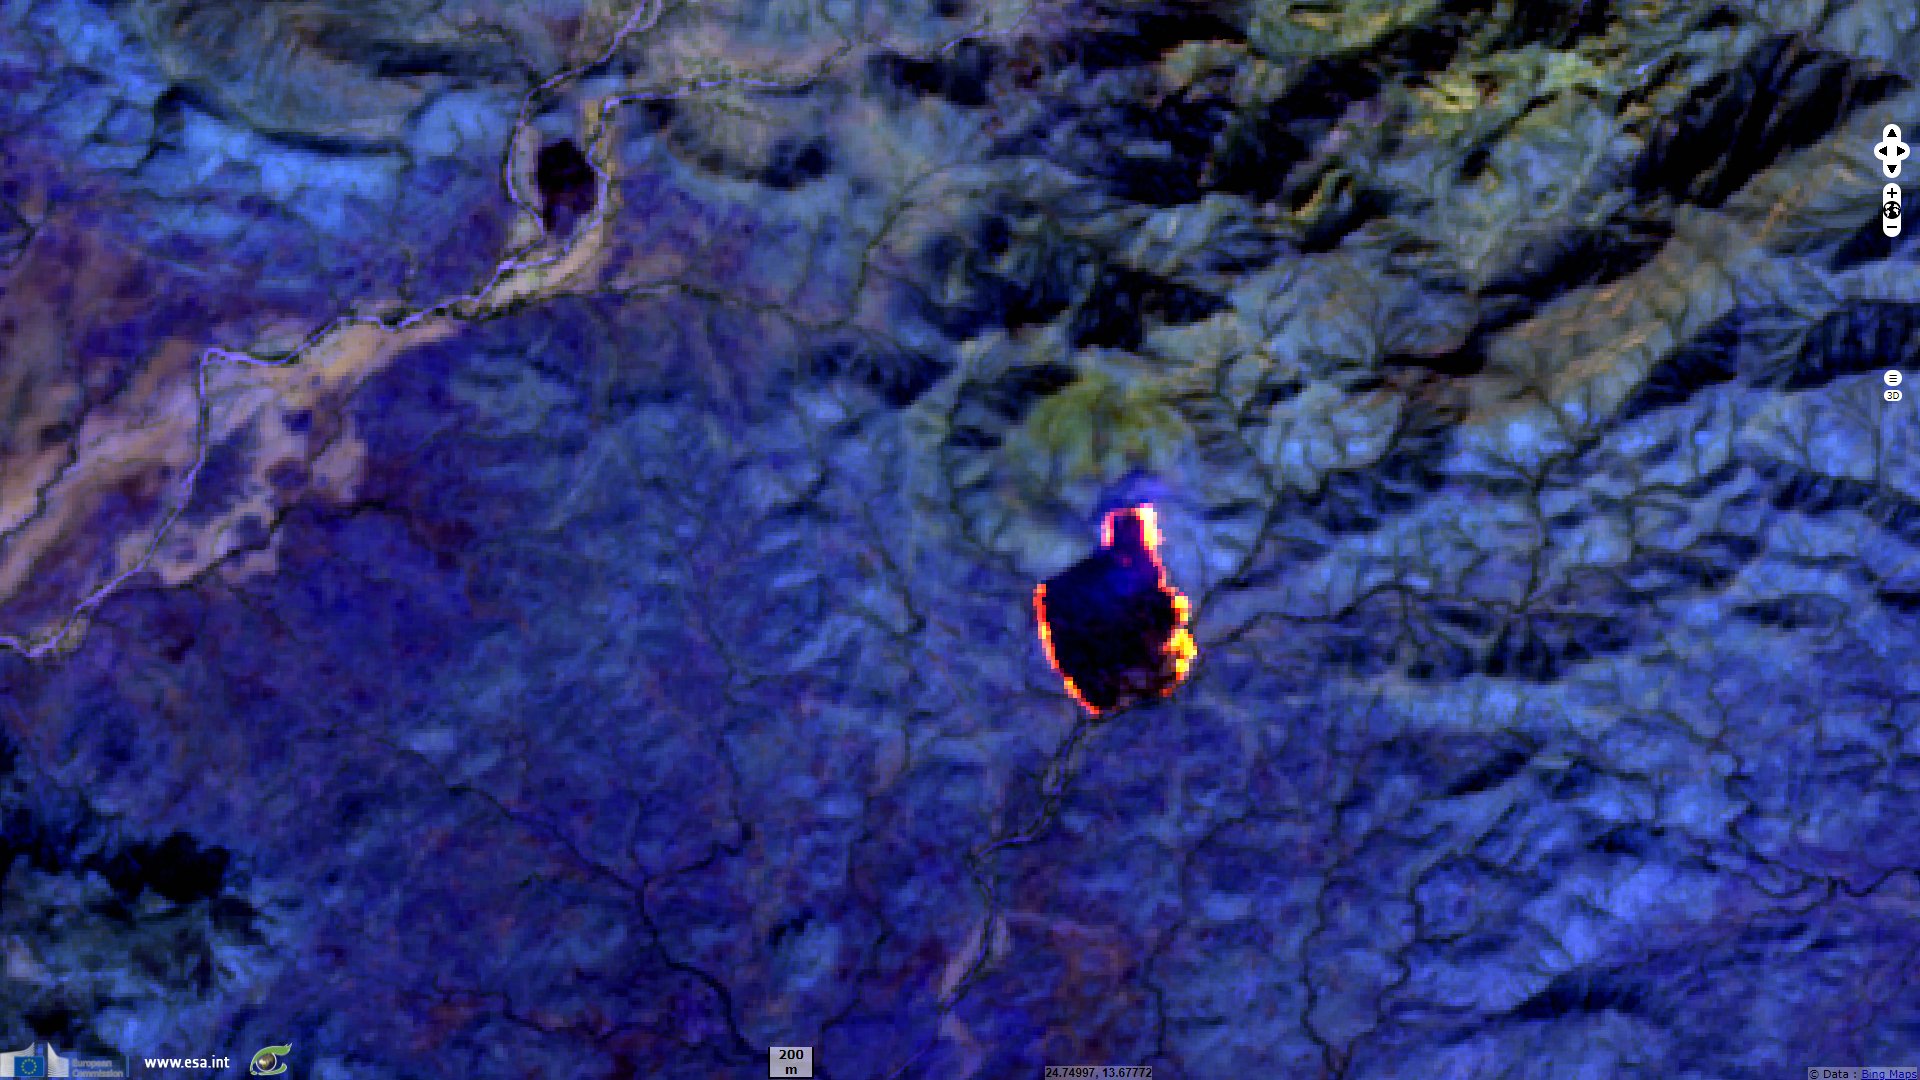
In the Sentinel-2 scenes, active fires and burnt areas are clearly visible in the mid-infrared and blue band colour compositions.
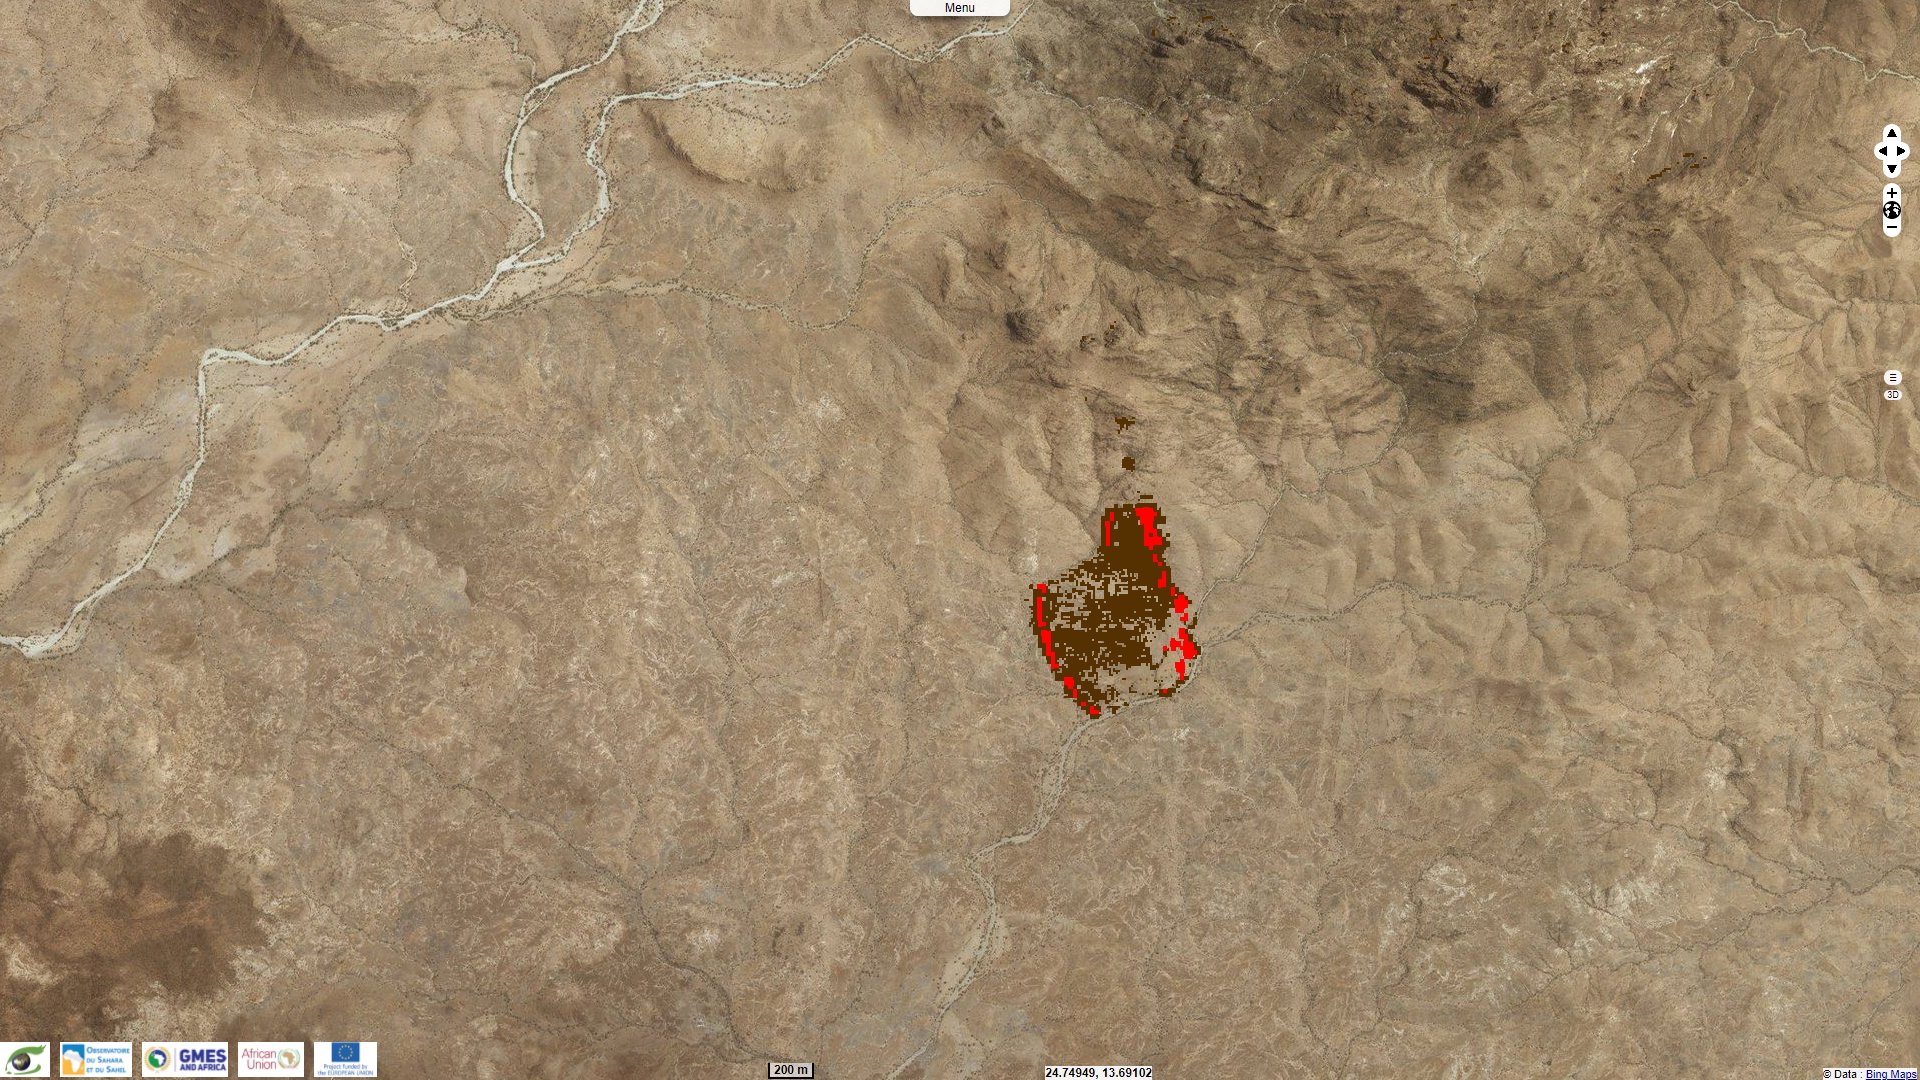
Two original algorithms allow the automatic recognition of active fires and burnt areas. The geo-services developed by VisioTerra allow the calculation of active fire occurrences and burnt areas. The processing is done within minutes of the Sentinel products being made available by ESA. Active fires in particular can be used to issue alerts.
The boundaries of the Great Green Wall vary between organisations and over time. The boundary shown in green in Fig. 4 is the one used by the Pan African Agency for the Great Green Wall in June 2020. We are interested here in its intersection with the Darfur region whose boundaries are shown in brown.
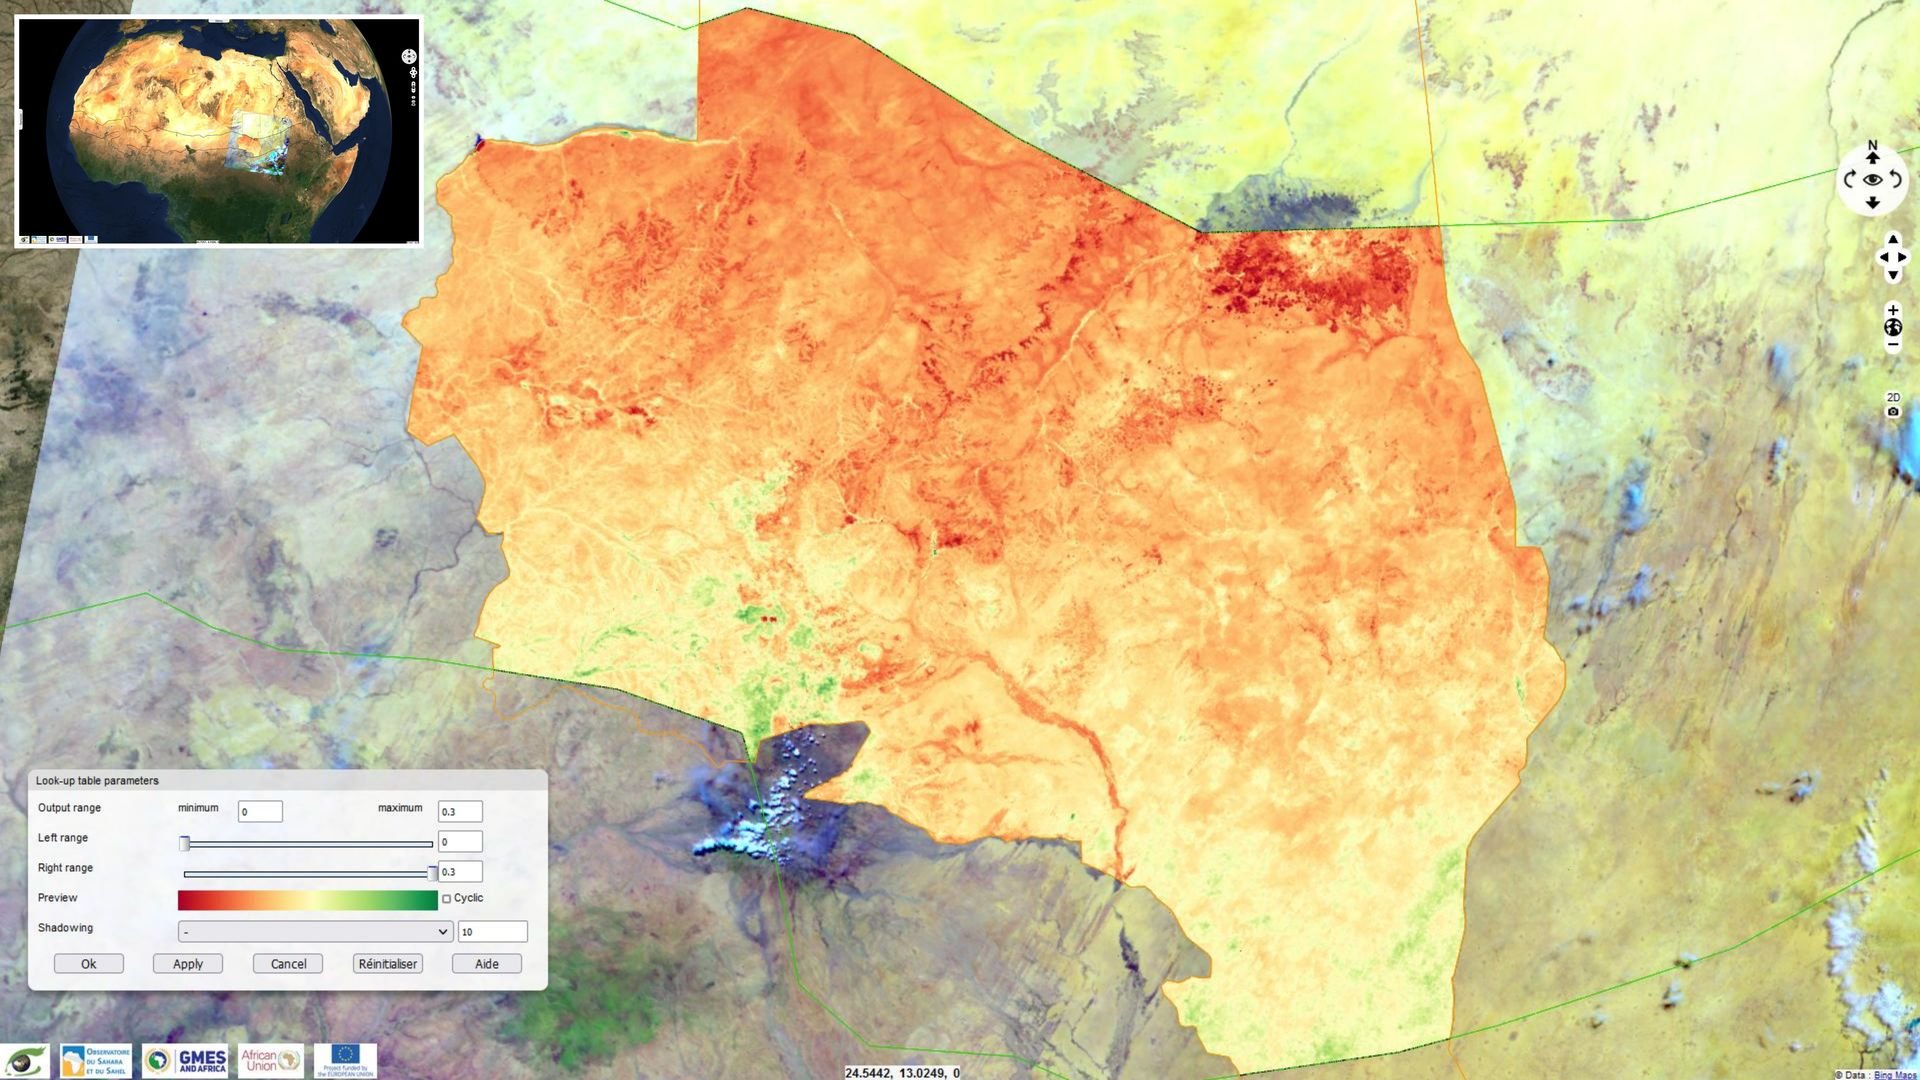
The Sentinel-3 satellites carry multi-spectral optical instruments (OLCI and SLSTR) and an altimeter (SRAL). While is offers medium spatial resolution (pixel size of 300 m for OLCI compared to 10 m and 20 m for Sentinel-2), the swath width is much wider (1270 km compared to 290 km for Sentinel-2). This processing uses an OLCI image to compute a vegetation index that clearly shows the dry areas (in red) and the vegetation cover (in green).
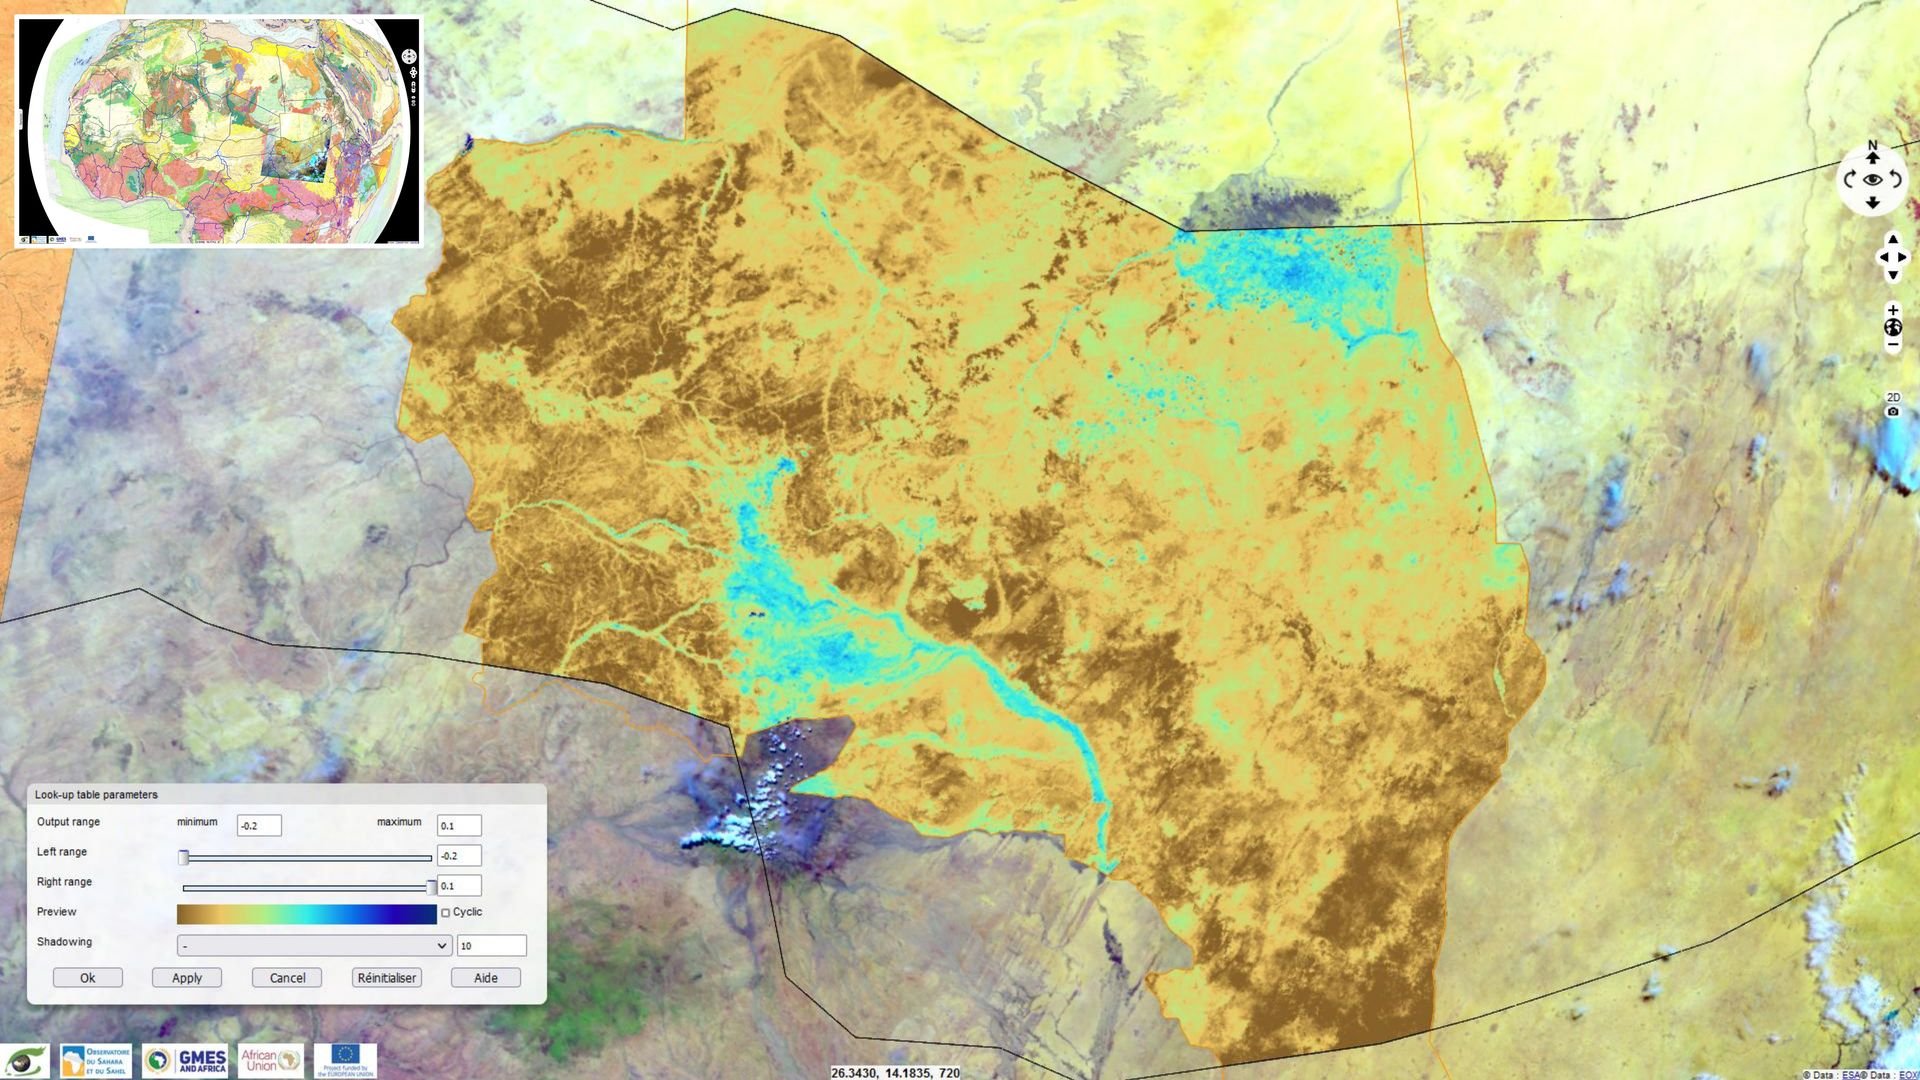
By combining the near-infrared and mid-infrared bands of Sentinel-3 SLSTR instrument, a standardised surface moisture index can be produced. The colour table used indicates arid areas in brown and wetter areas in blue. Medium-scale monitoring can be carried out almost daily with an instrument swath width of 1400 km at nadir (satellite vertical). The background scene is a coloured composite of simultaneous acquisitions involving visible and near-infrared bands from OLCI combined with mid-infrared from SLSTR.
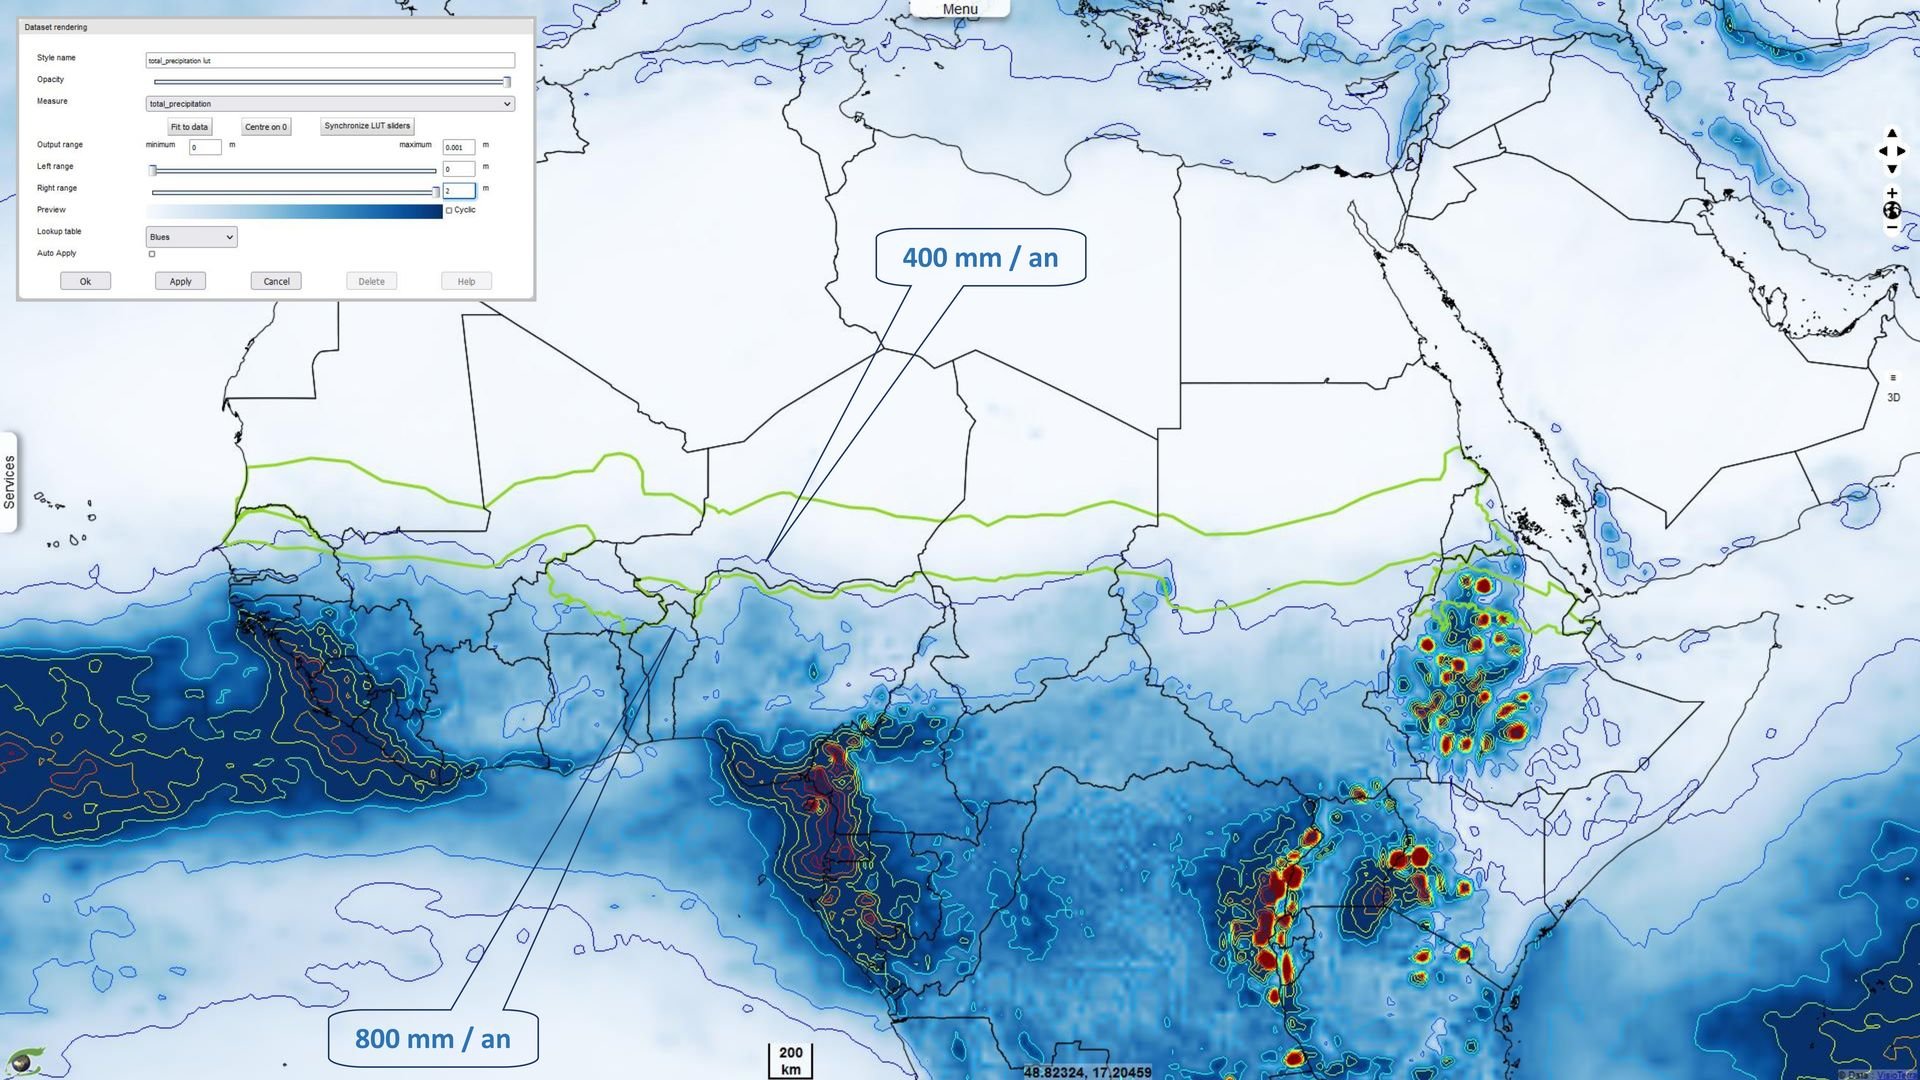
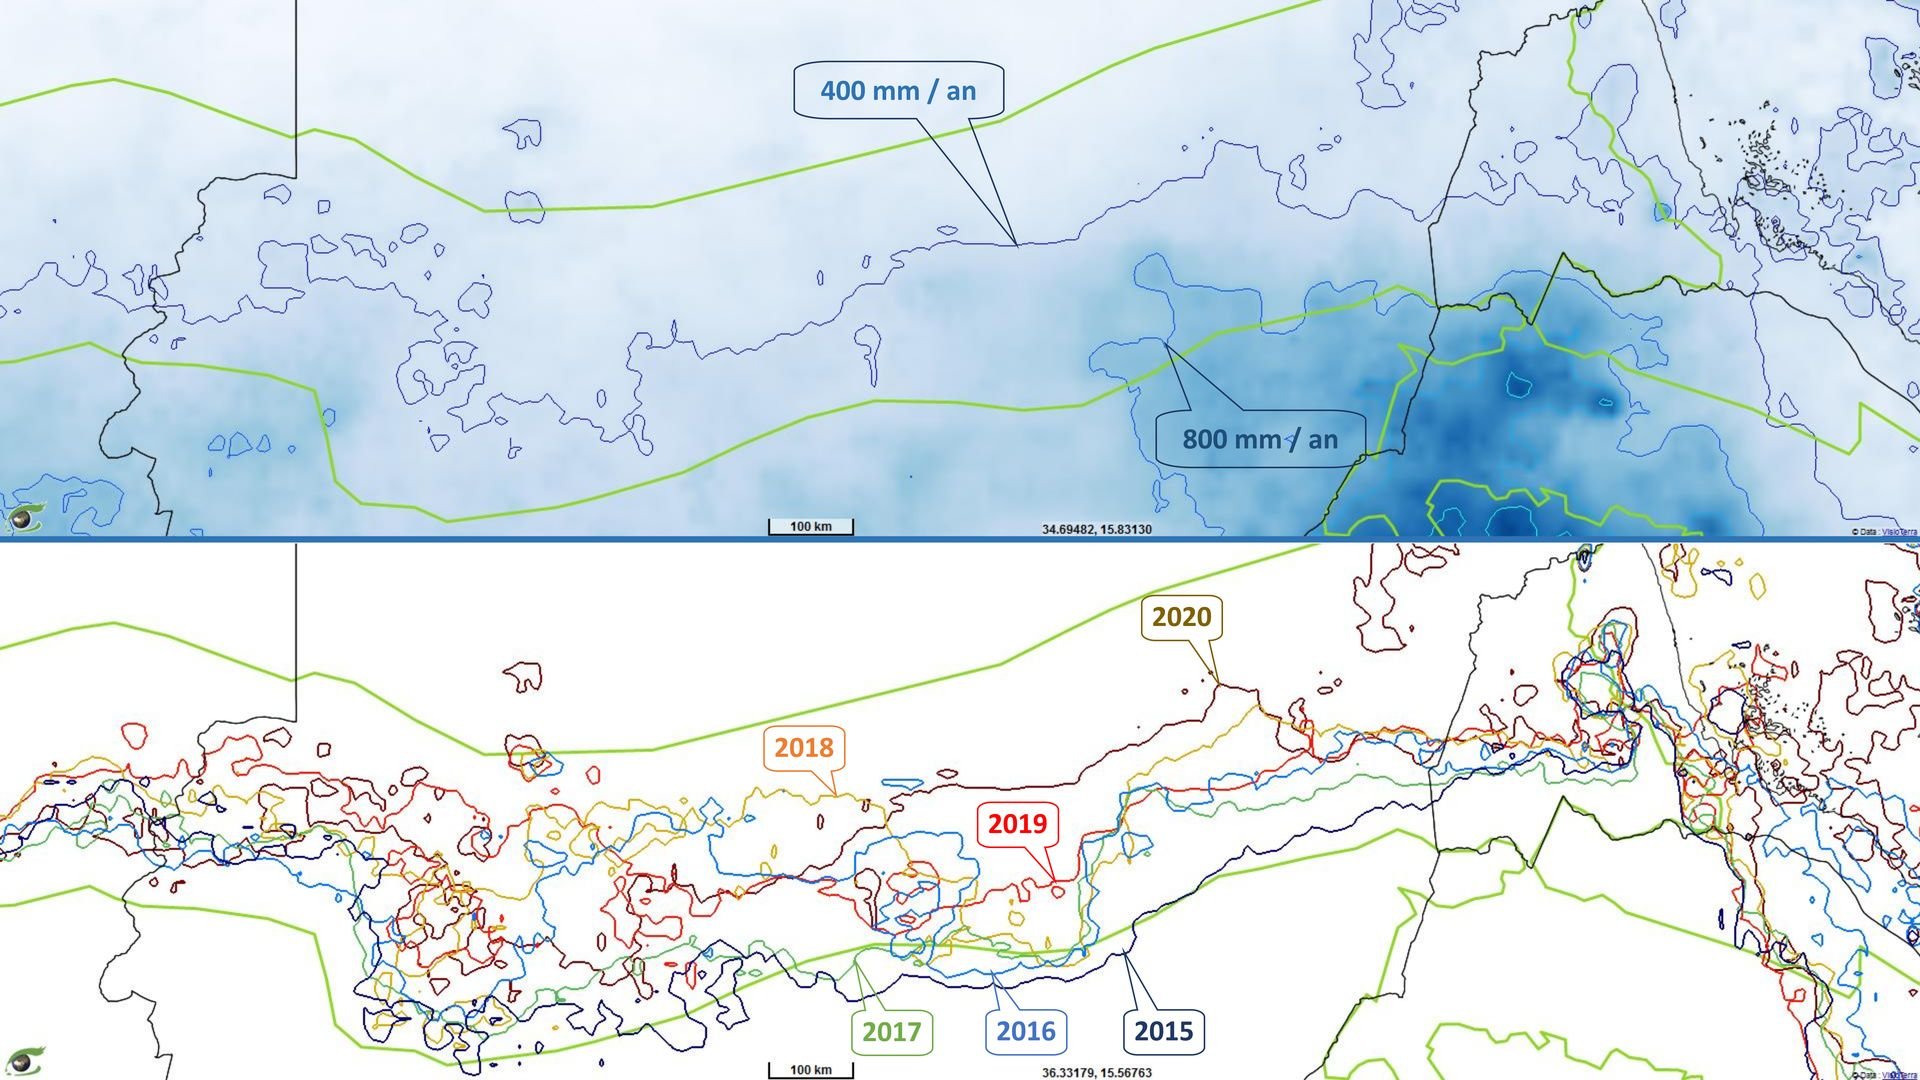
By aggregating the monthly total precipitation (TP-M) data from ERA5 produced by the Copernicus Climate Change Service (C3S), we obtain total annual precipitation. The background image shows this precipitation precipitation with a colour scale ranging from white (no precipitation) to dark blue (2000 mm) to dark blue (2000 mm of water or 2 metres in total per year). The contour lines, called isohyets, are calculated at 400 mm intervals and use another table of colours ranging from blue (low precipitation) to red (high precipitation) through the colours of the rainbow.
Other precipitation models are available. For example, NASA provides data from the IMERG (Integrated Multi-satellite Retrievals) model from its (IMERG) model from its Global Precipitation Measurement (GPM) collection. Fig.8 is a rendering of monthly cumulative precipitation in 2020 that can be compared to the ERA5 model in Fig.7.
Historically, the 400 mm / year isohyet was used to define the boundary of the Great Green Wall (GGW) south of the Sahara. The lower figure shows this isohyet from the GPM model in 2015, 2016, 2017, 2018, 2019 and 2020. In this part of the GMA in Sudan, there is a retreat to the north in the last 3 years years 2018, 2019 and especially 2020 which may be a sign of the Sahel regreening. Note: The calculations in VtWeb are done on the fly, including the determination of isohyets. These calculations require more resources making the display in 2D and especially in 3D slower.
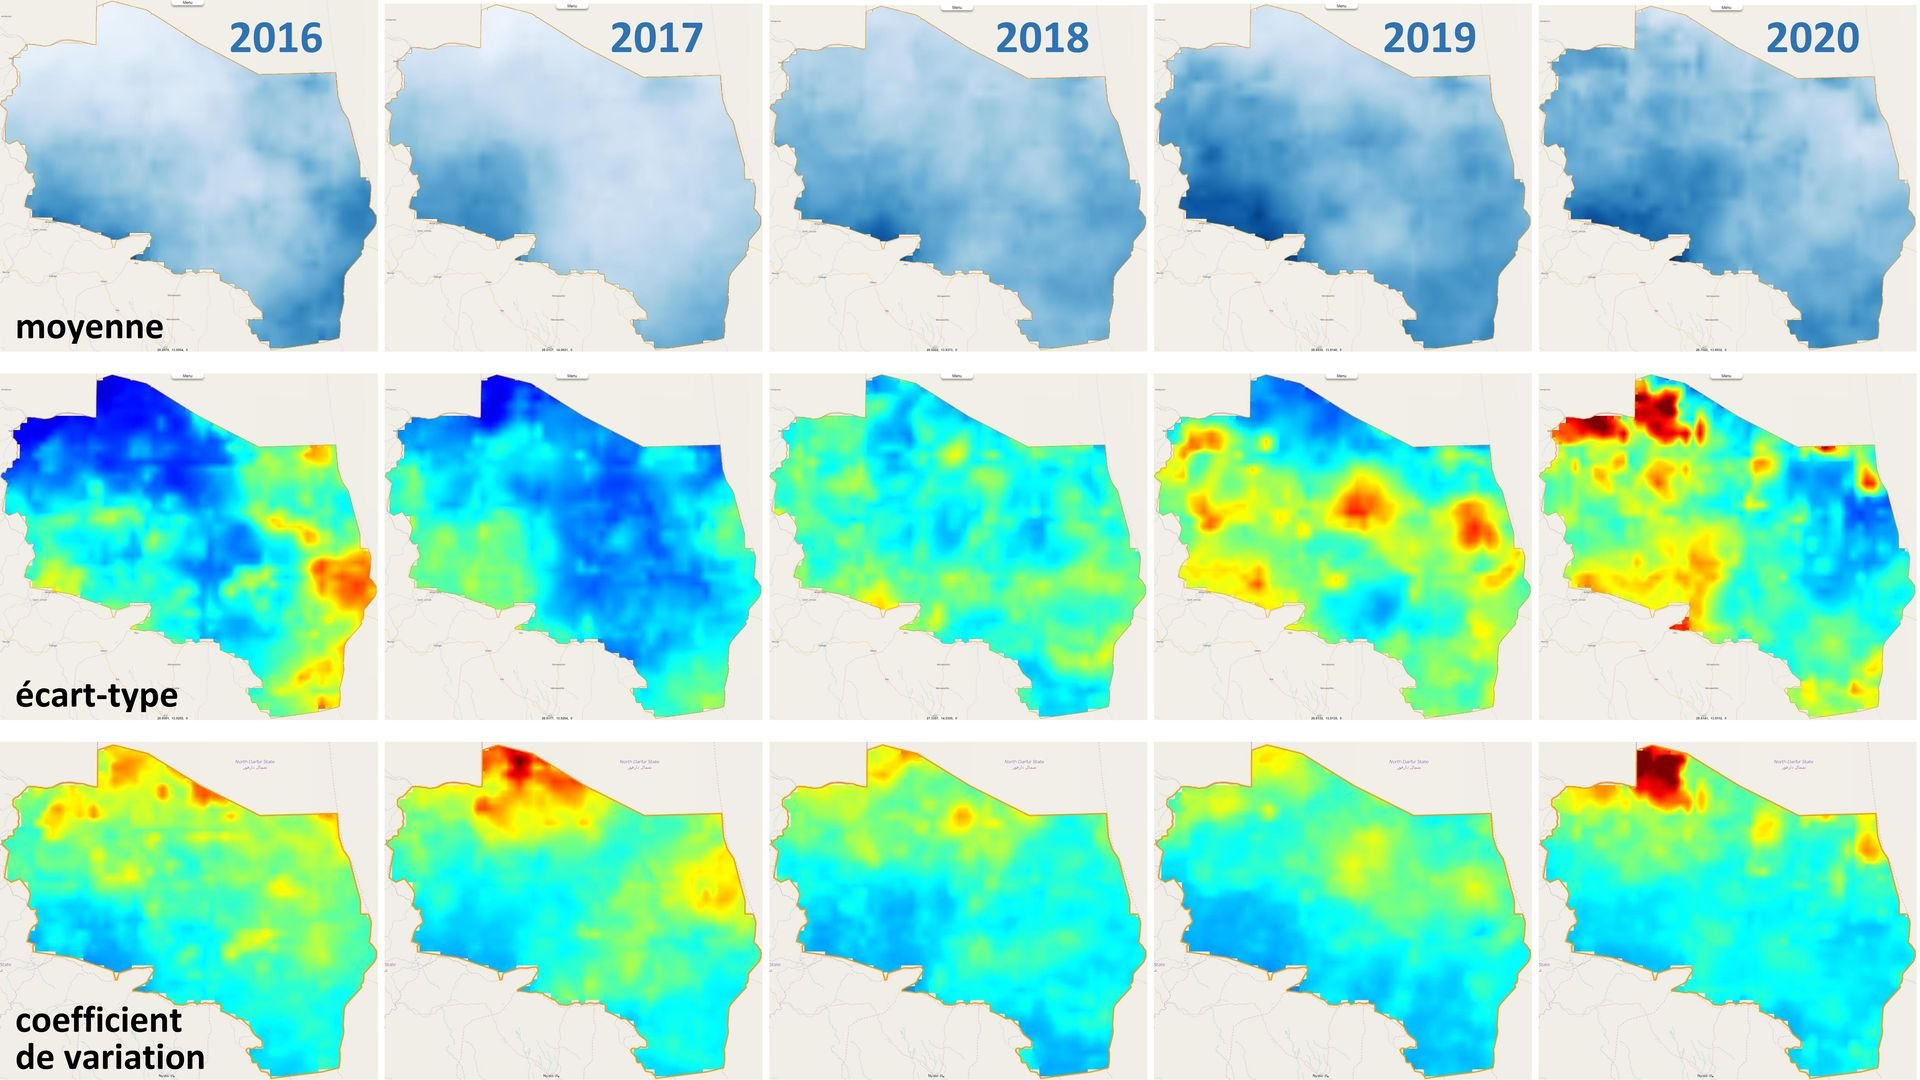
The spatial distribution of precipitation in a particular area can be measured. Fig.10 shows the mean, standard deviation and coefficient of variation of daily precipitation from the IMERG GPM model in each year from 2016 to 2020. The mean highlights the wettest parts of the area. The standard deviation measures the variation in rainfall over the year. The coefficient of variation measures this variance but neutralises the amount of water discharged. This coefficient measures the temporal dispersion of precipitation even in areas with little water. Its high values in the north reflect the sporadic nature of low rainfall.
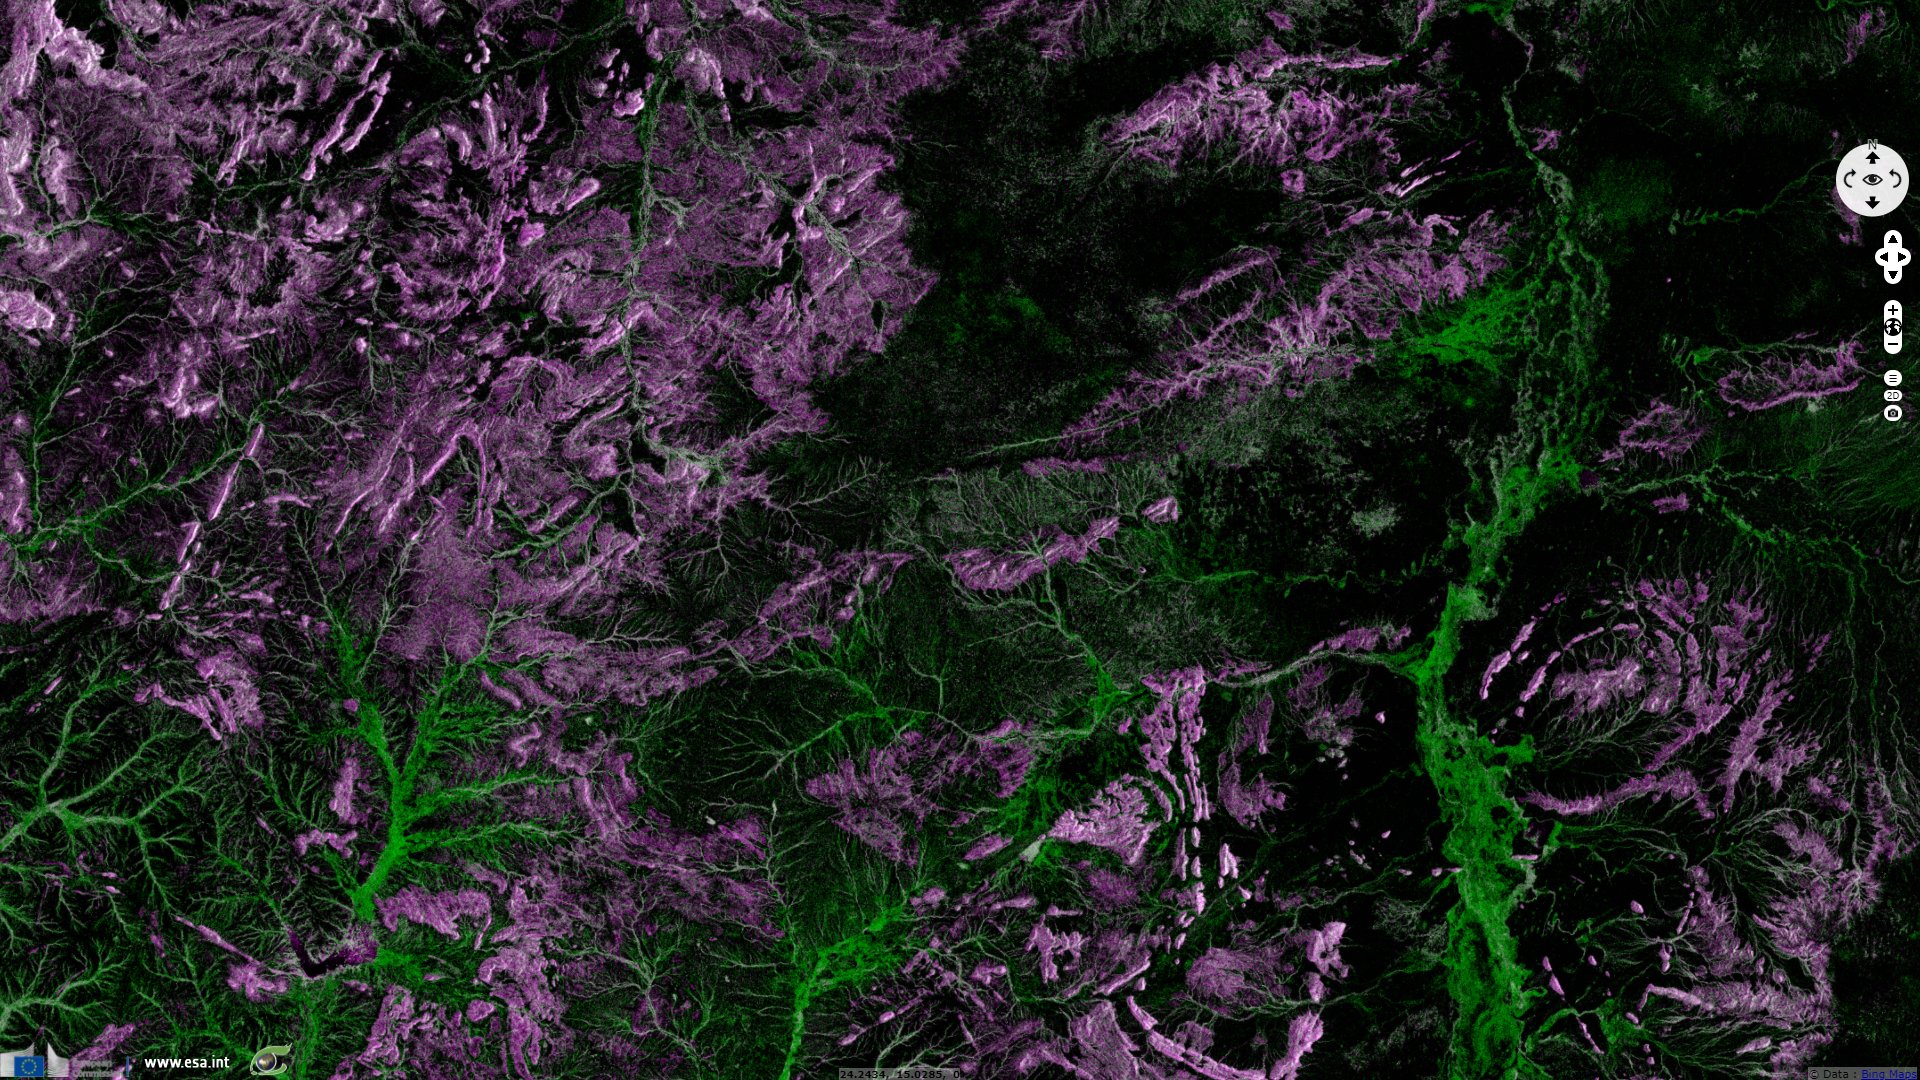
The Sentinel-1 satellite and its radar instrument C-SAR allow the Earth to be observed through clouds. The backscattered signal is influenced by land cover (especially vegetation), surface conductivity which is often related to moisture.
The colour composite produced for this radar image uses the two polarisations of the C-SAR instrument: -VV corresponding to the polarisation transmitted vertically (V) and received vertically in the red and blue planes (blue and red channels) and -VH corresponding to the polarisation transmitted vertically and received horizontally (H) in the green plane. By combining the polarisations of these two images, we can highlight the difference in vegetation cover and surface humidity and even deduce the capacity of the soil and vegetation to retain surface water.
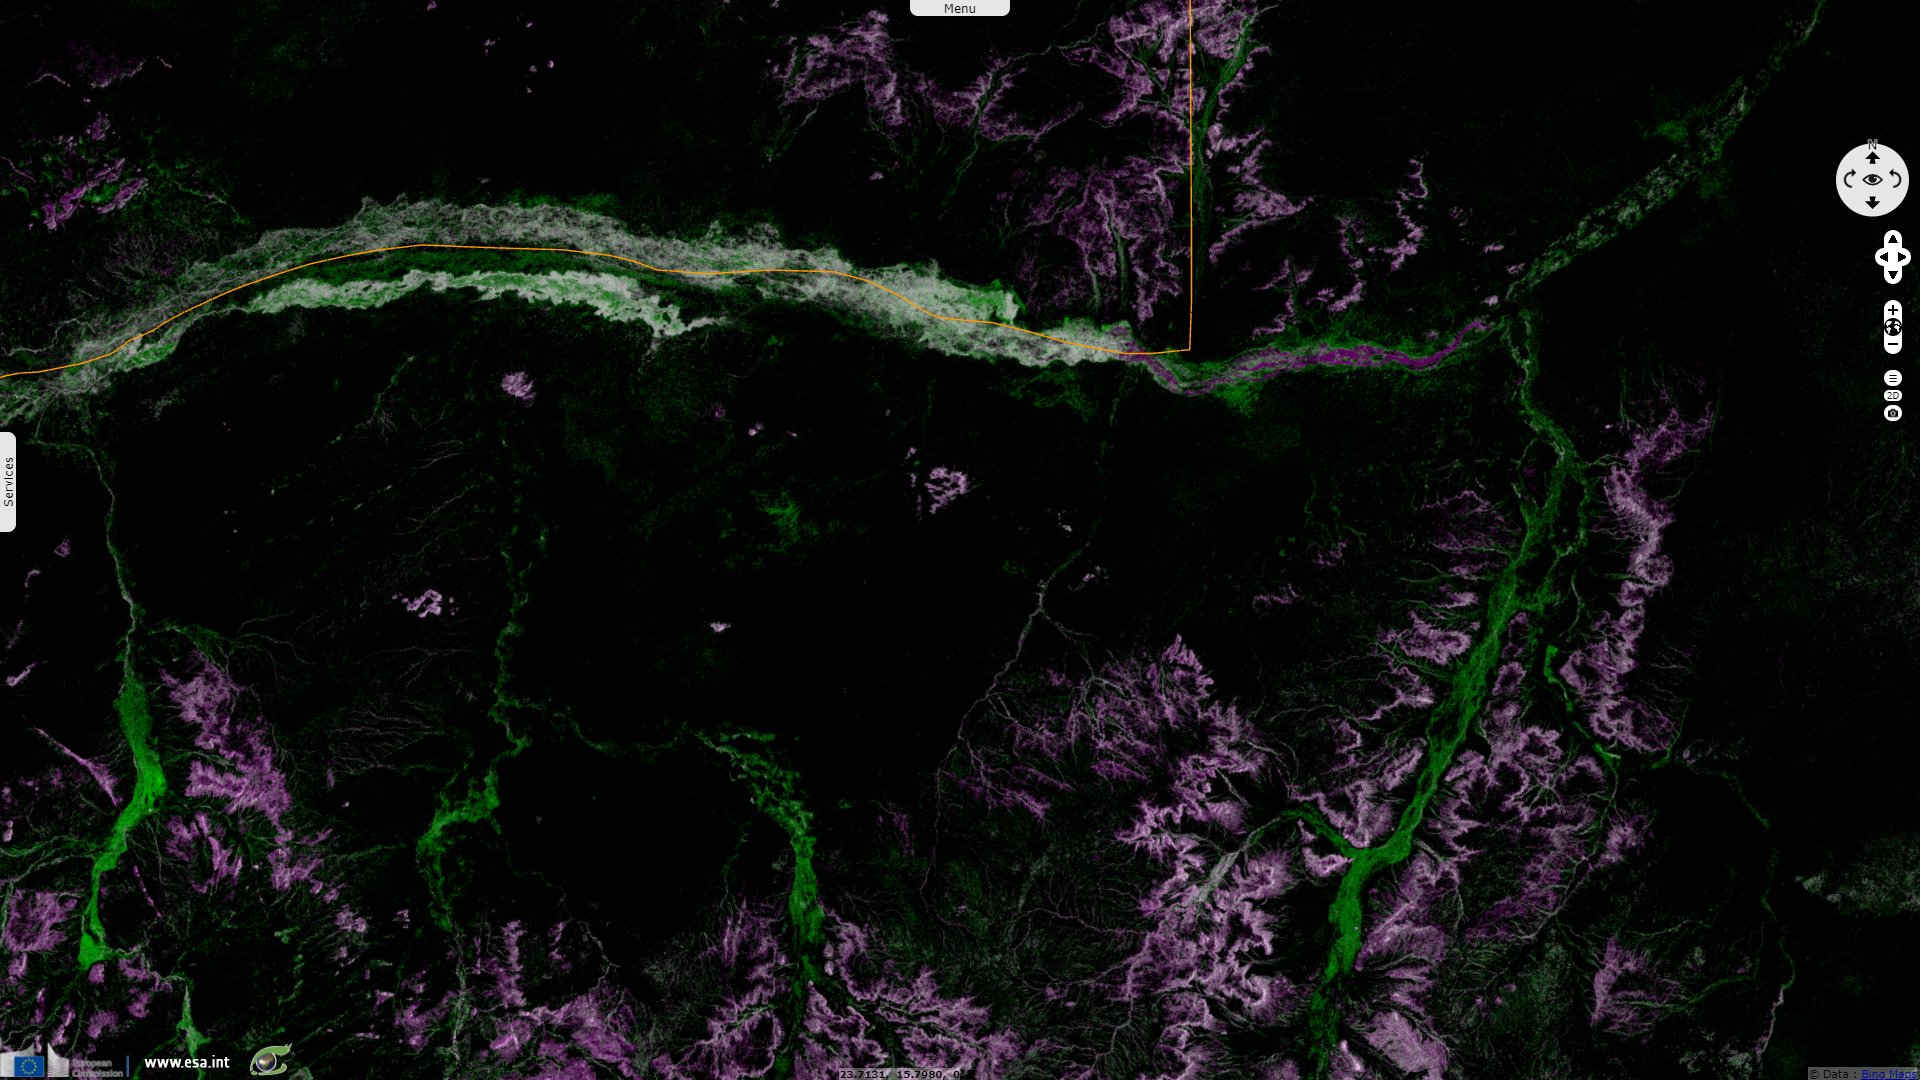
It shows that the image acquired on 26 August 2020 during the wet season (fig. 12 and green channel of fig.14 and fig.15) is brighter in the riverbeds than the one acquired on 22 May 2020 during the dry season (fig. 11 as well as blue and red channels of fig.14 and fig.15).
The views expressed herein can in no way be taken to reflect the official opinion of the European Space Agency or the European Union.
Contains modified Copernicus Sentinel data 2026, processed by VisioTerra.
Contains modified Copernicus Sentinel data 2026, processed by VisioTerra.
| More on European Commission space: |  |
 |
 |
||||
| More on ESA: | |
|
|
S-1 website | S-2 website | S-3 website | |
| More on Copernicus program: | |
|
|
Scihub portal | Cophub portal | Inthub portal | Colhub portal |
| More on VisioTerra: | |
|
|
Sentinel Vision Portal | Envisat+ERS portal | Swarm+GOCE portal | CryoSat portal |