Heterogeneity in the aspect of coffee crops
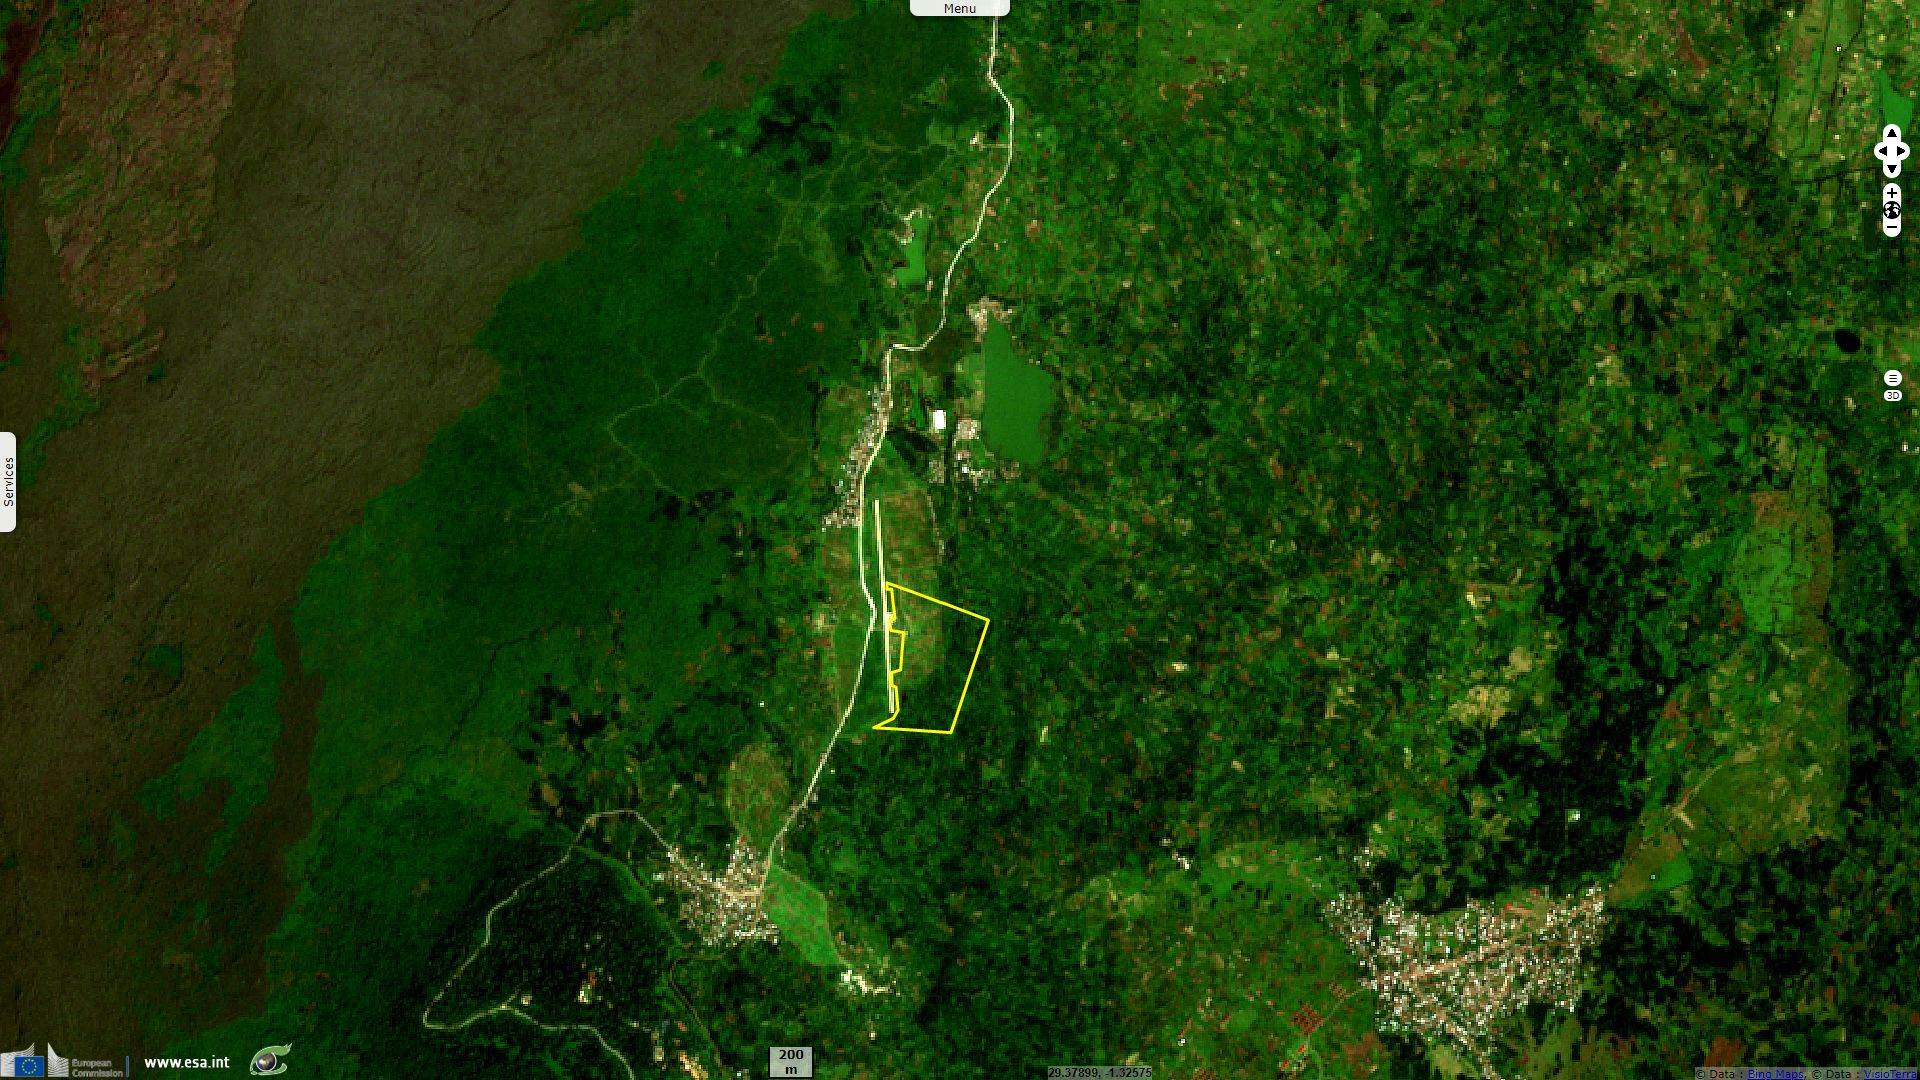
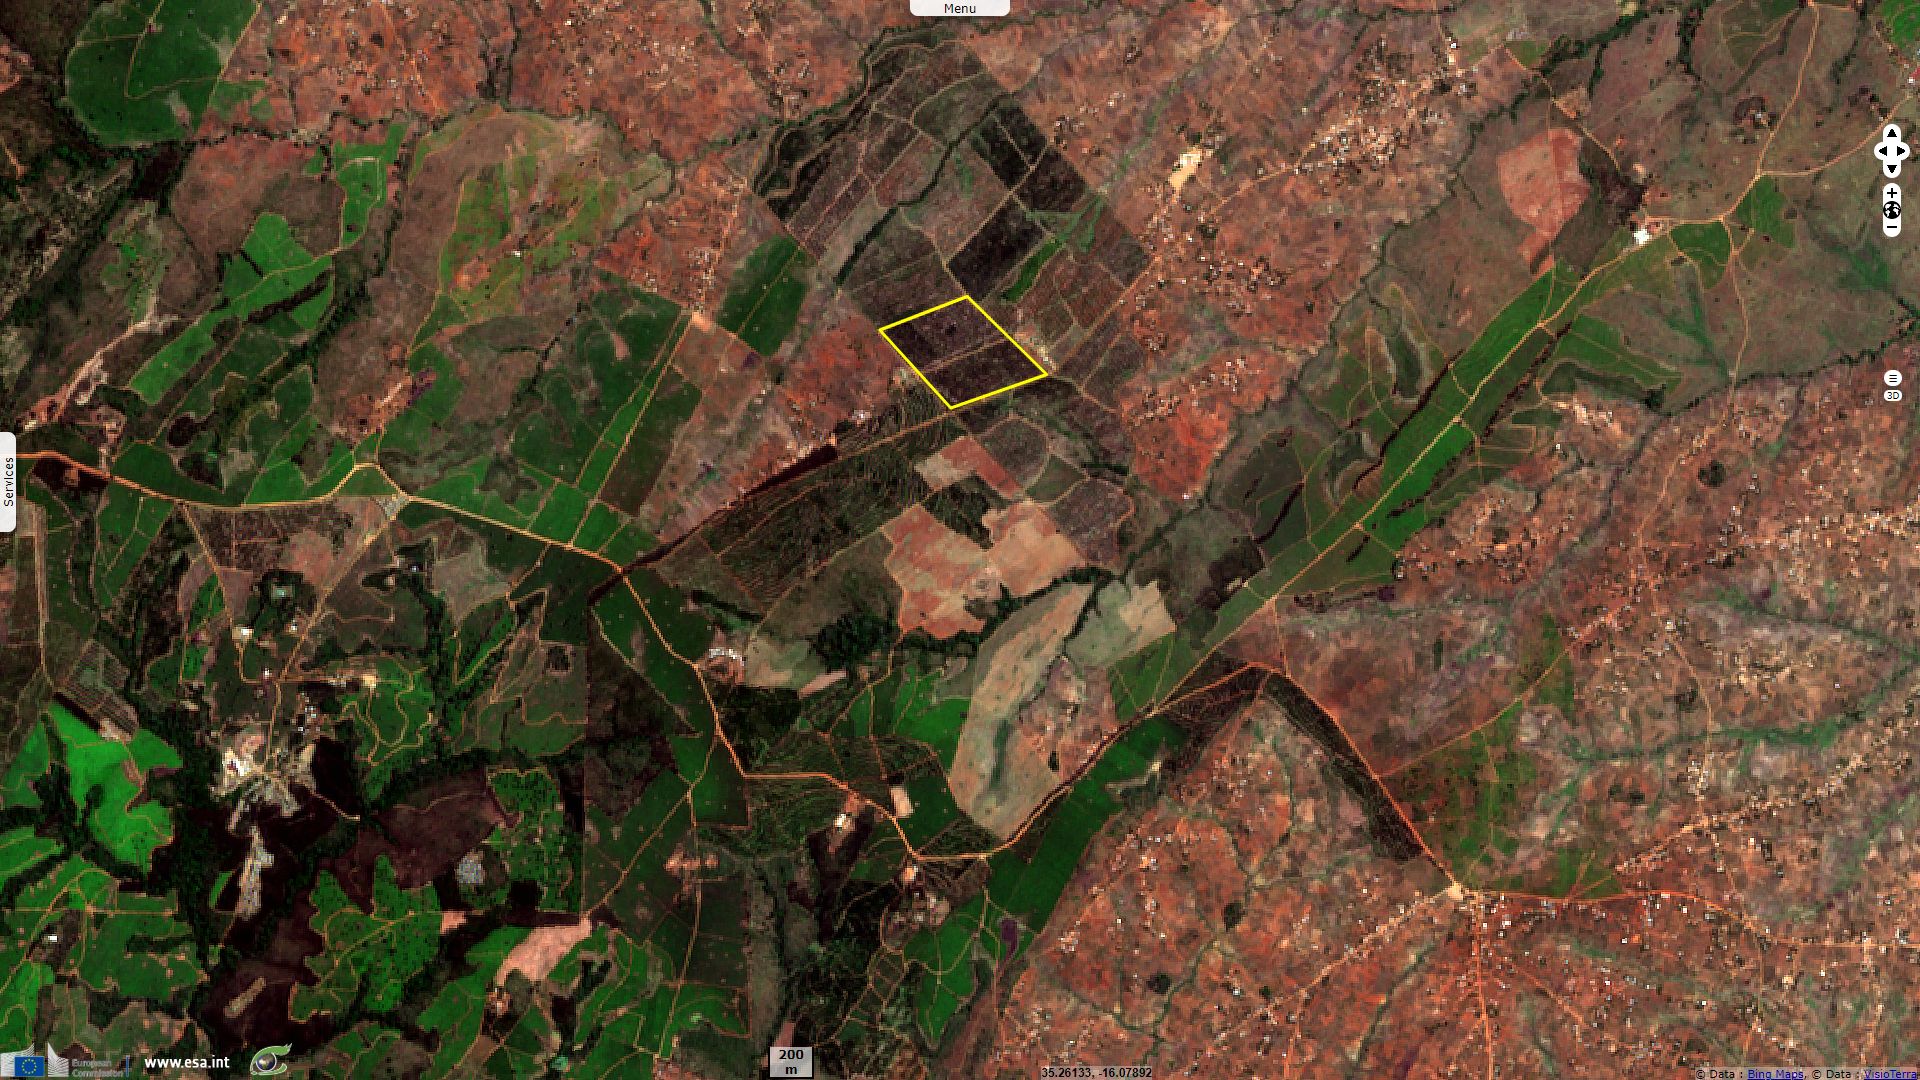
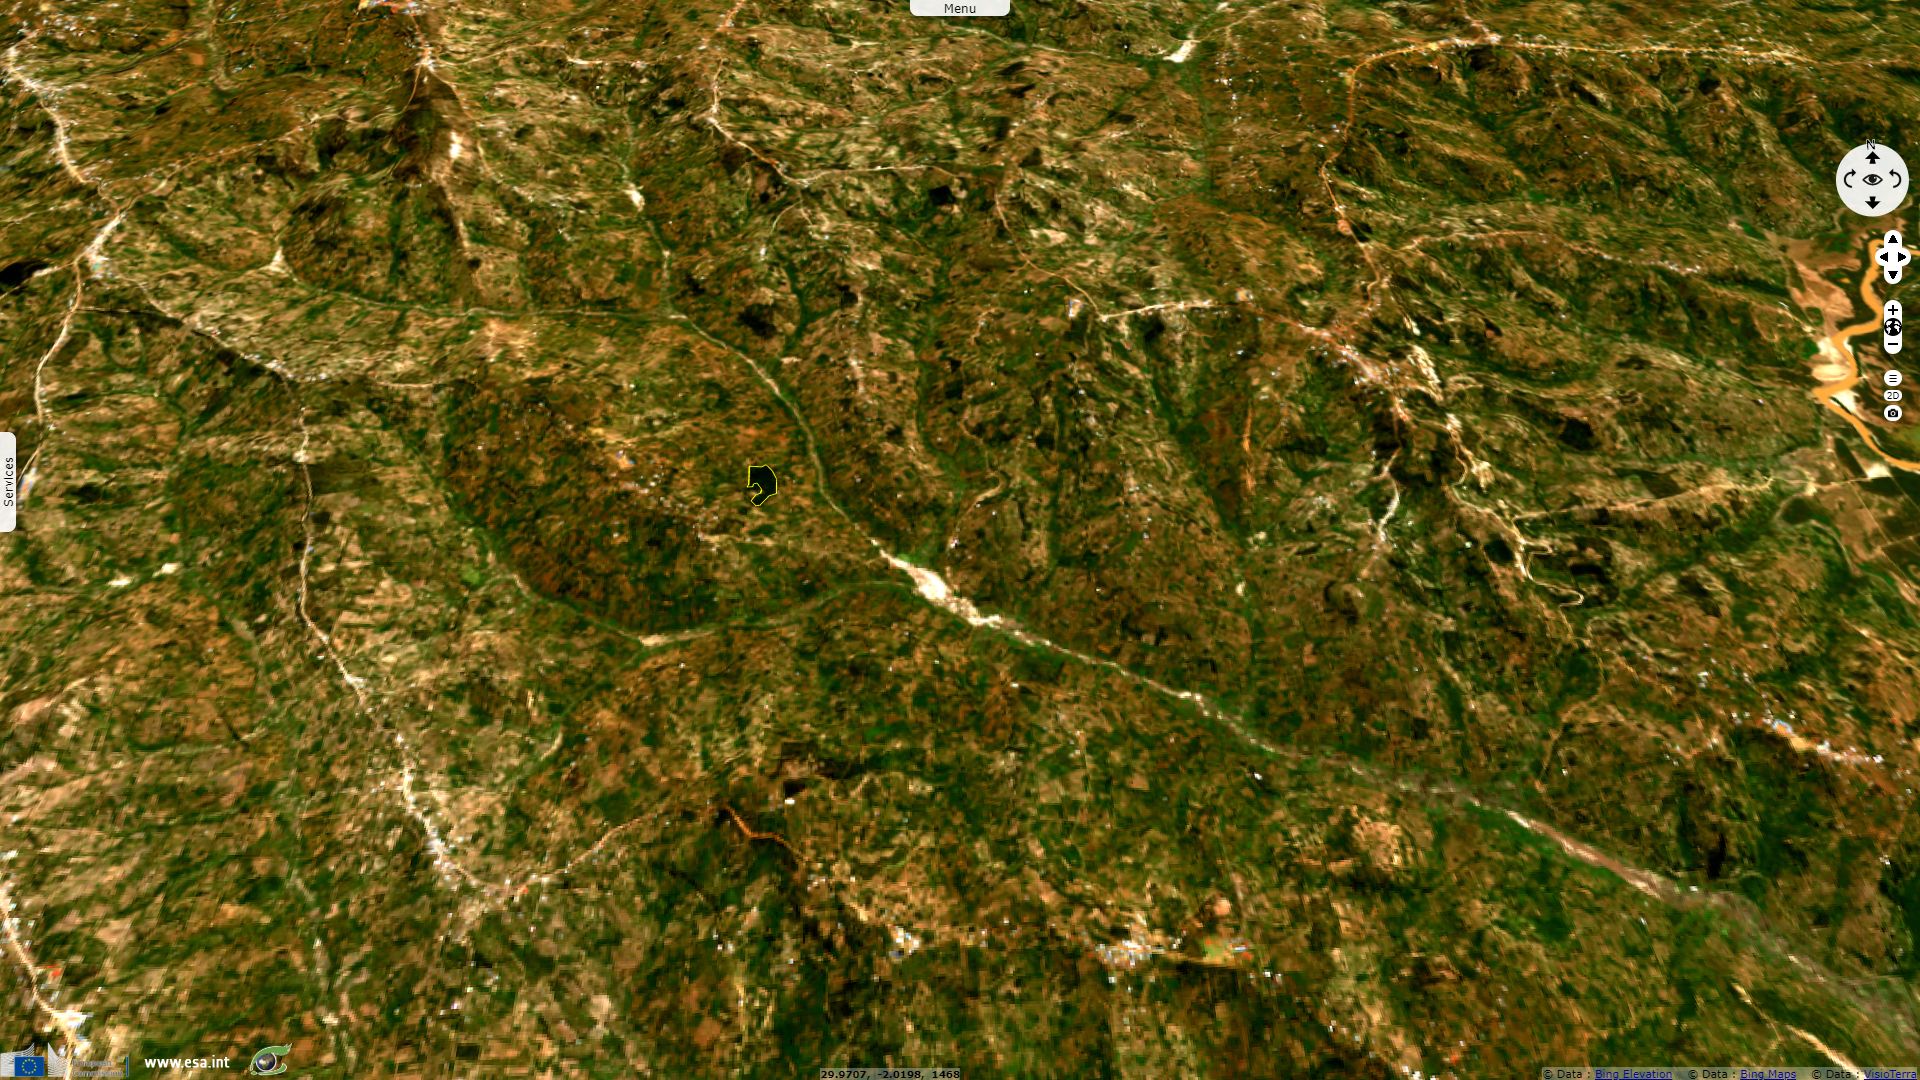
Sentinel-2 MSI acquired on 12 September 2017 at 07:56:11 UTC
...
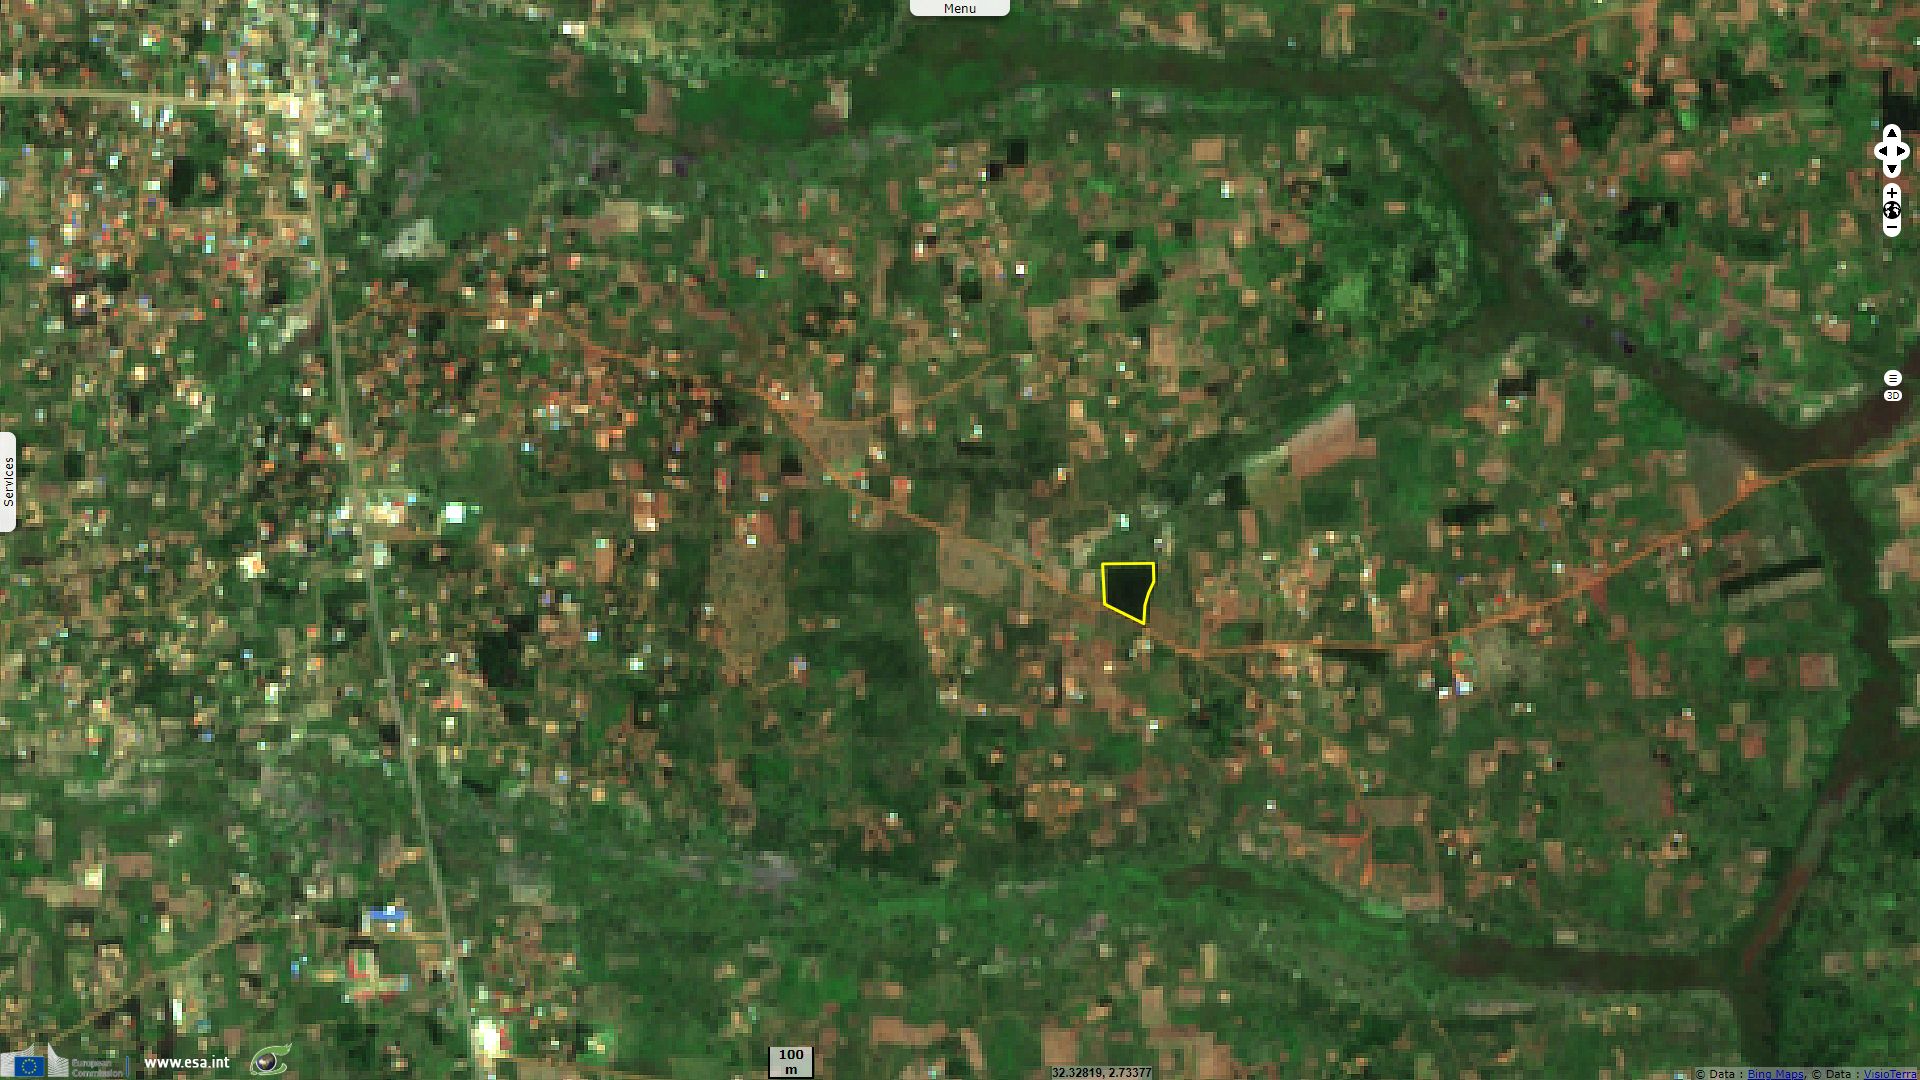
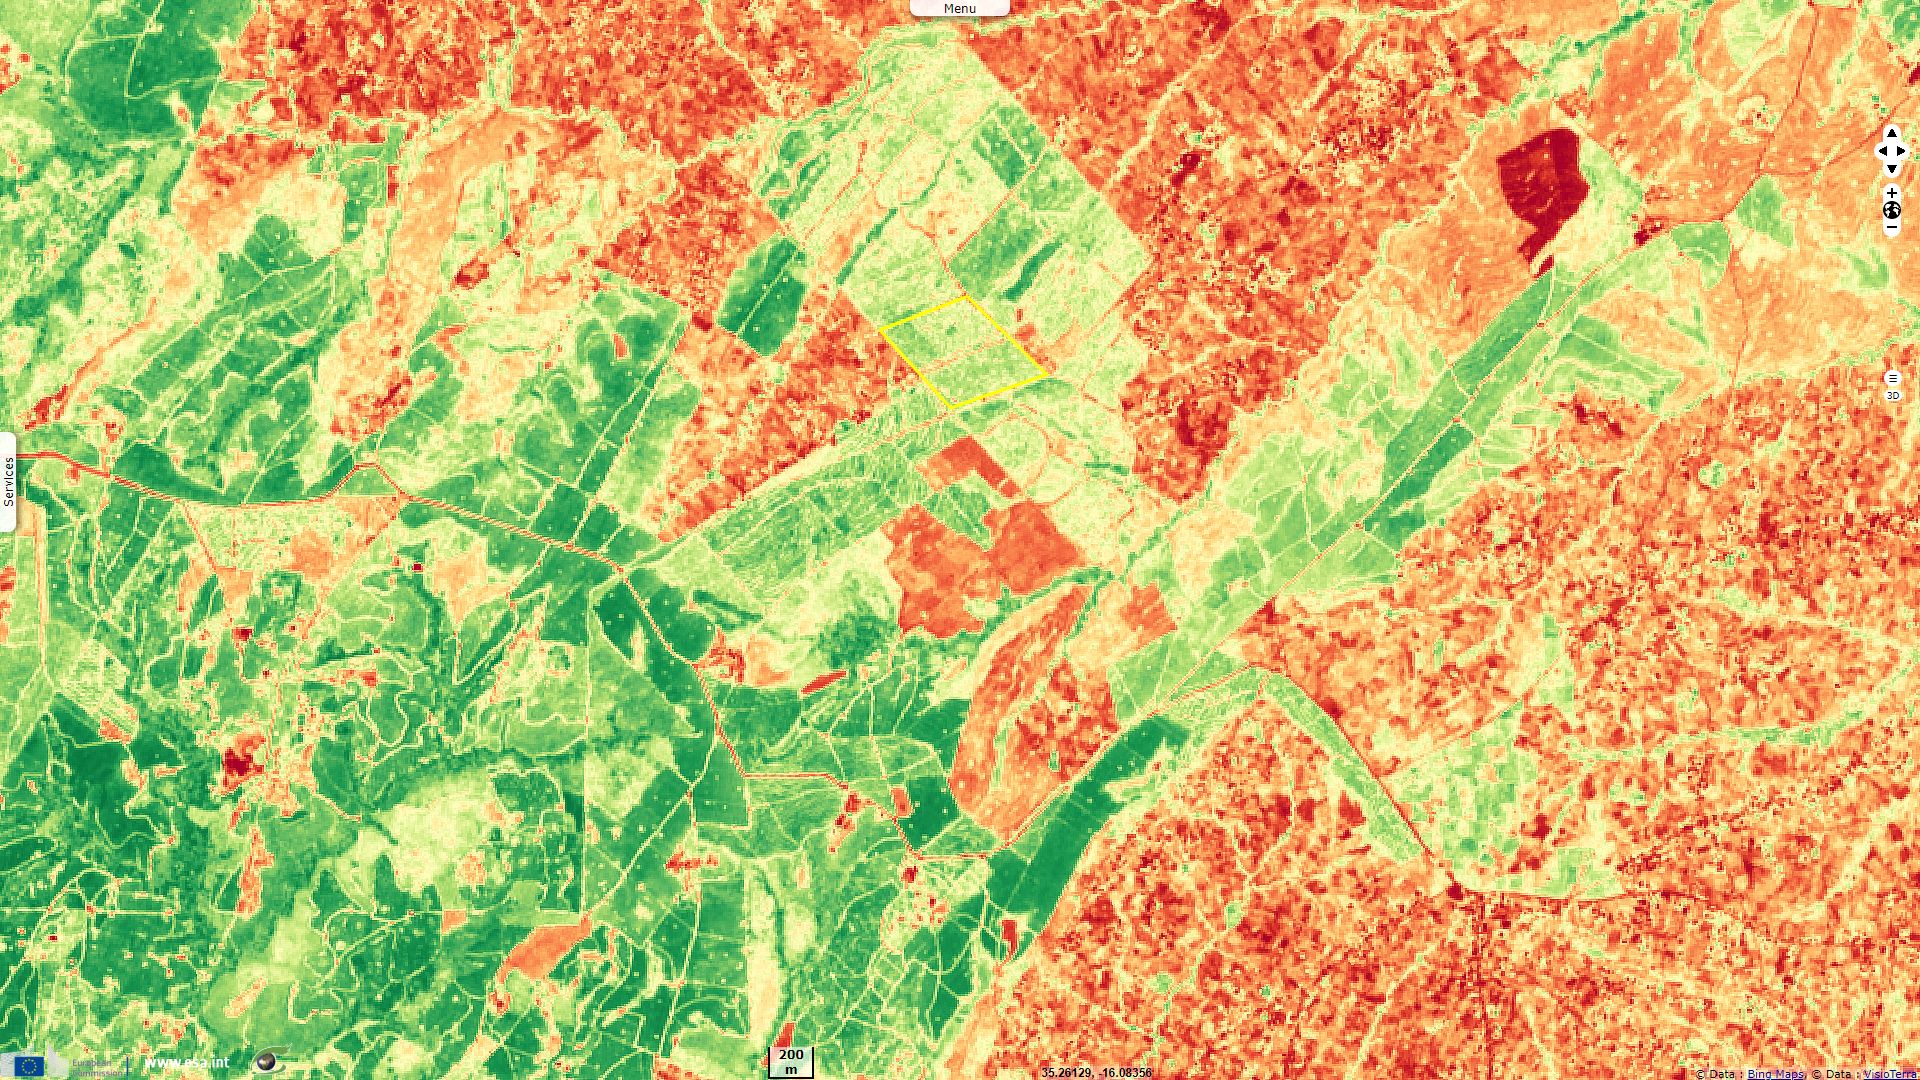
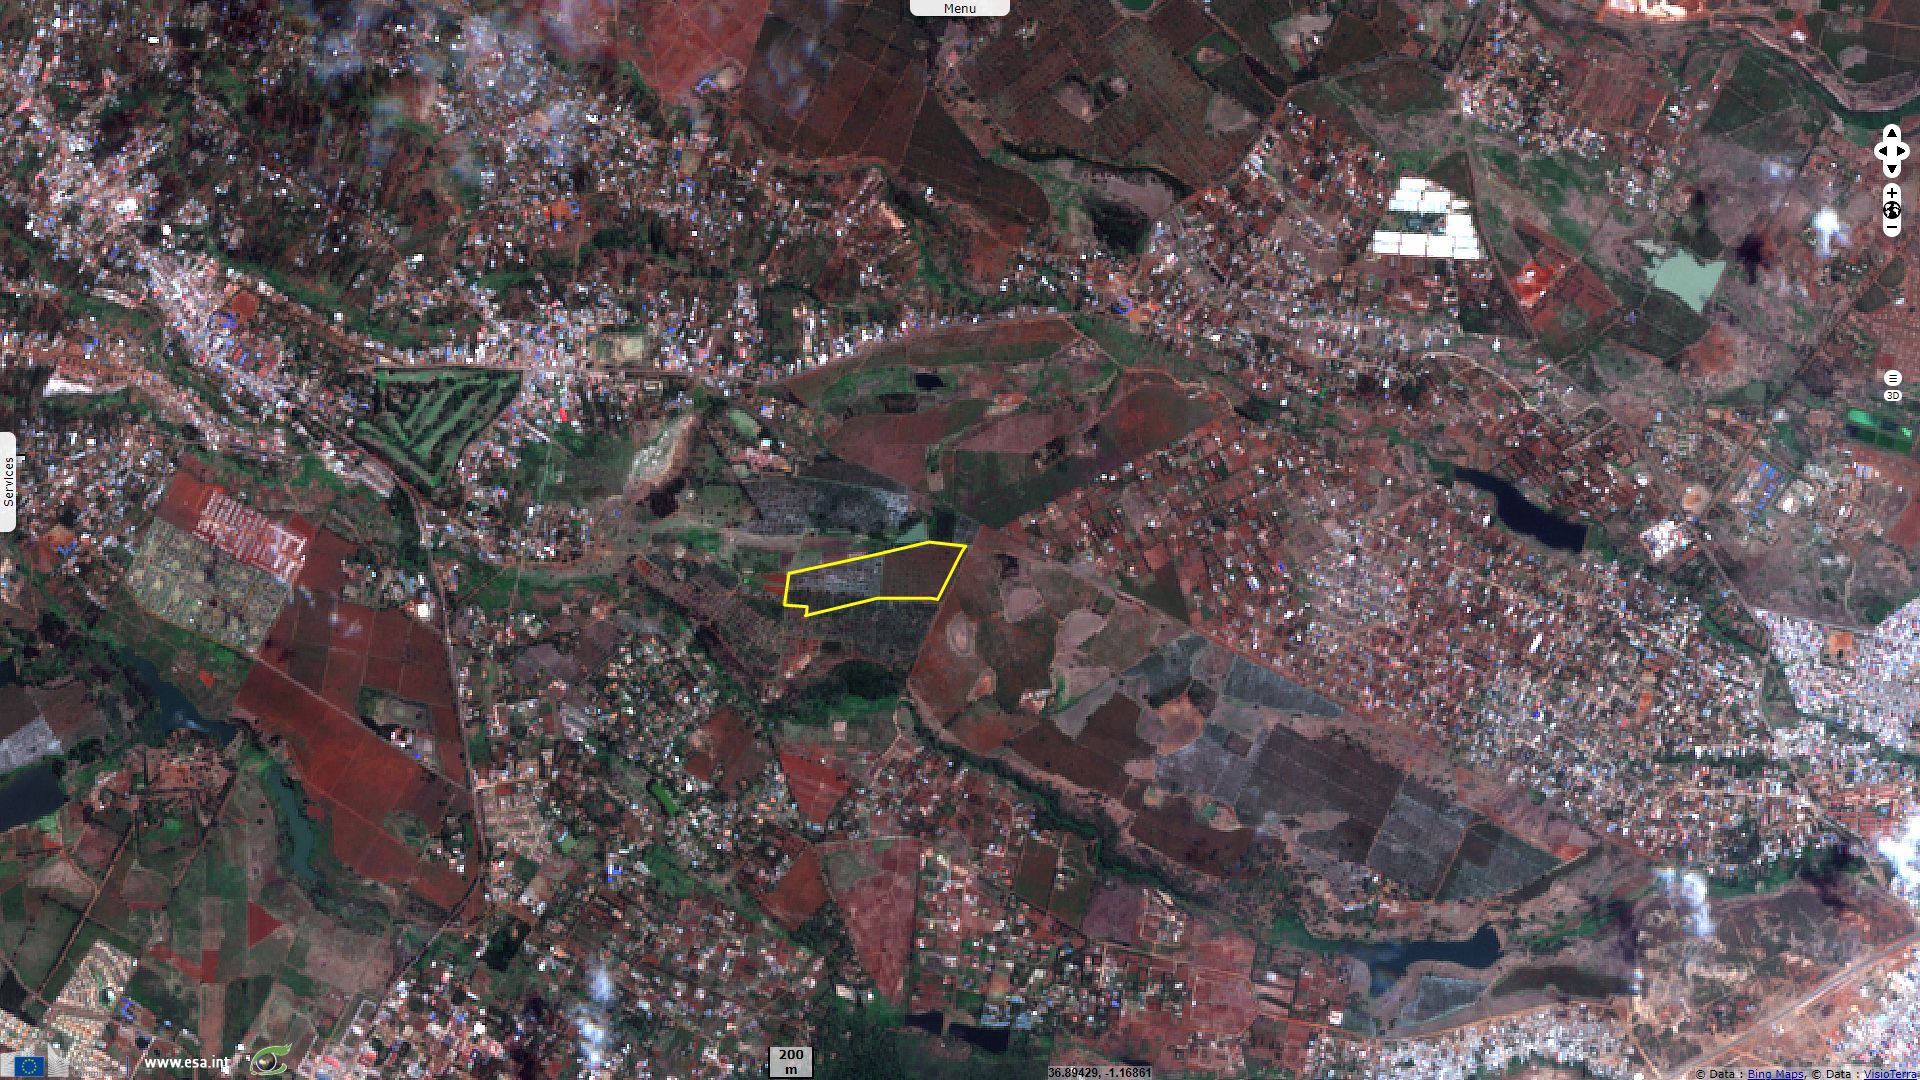
Sentinel-2 MSI acquired on 17 February 2018 at 08:10:09 UTC
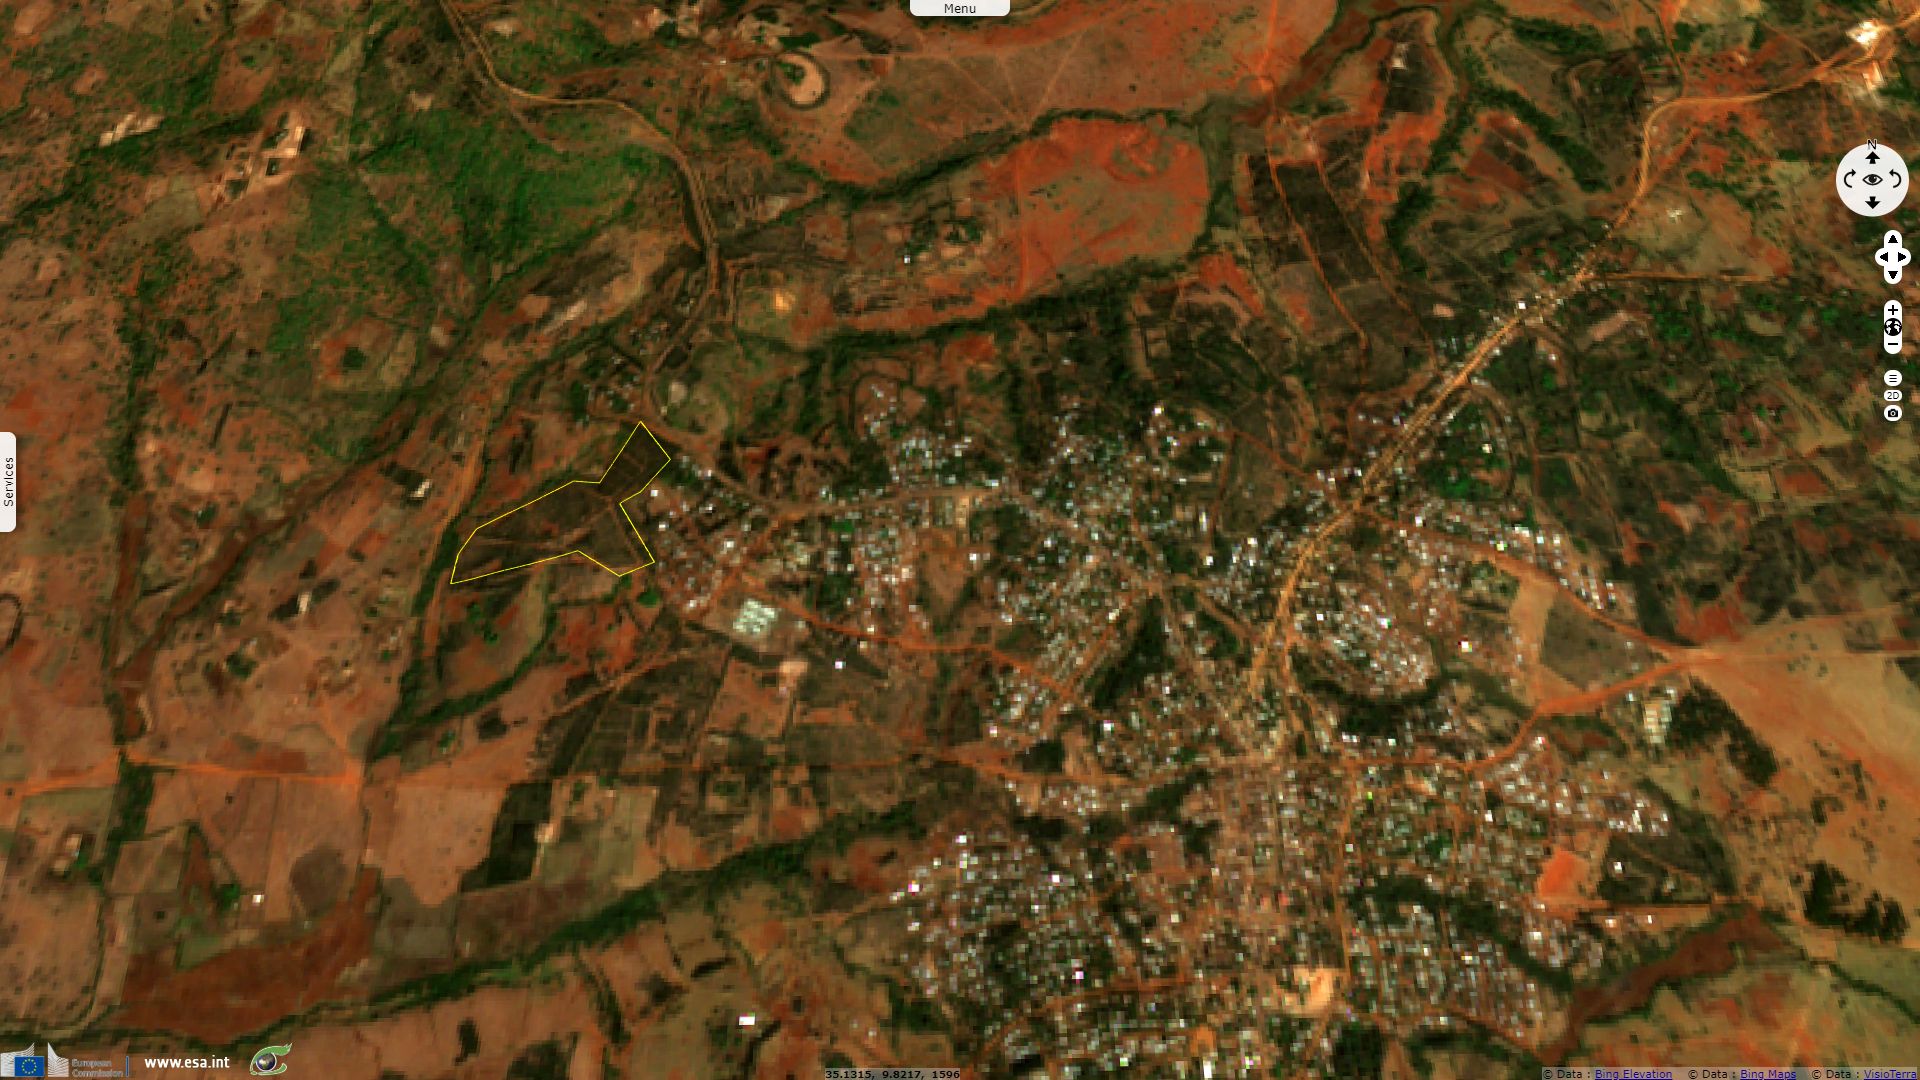
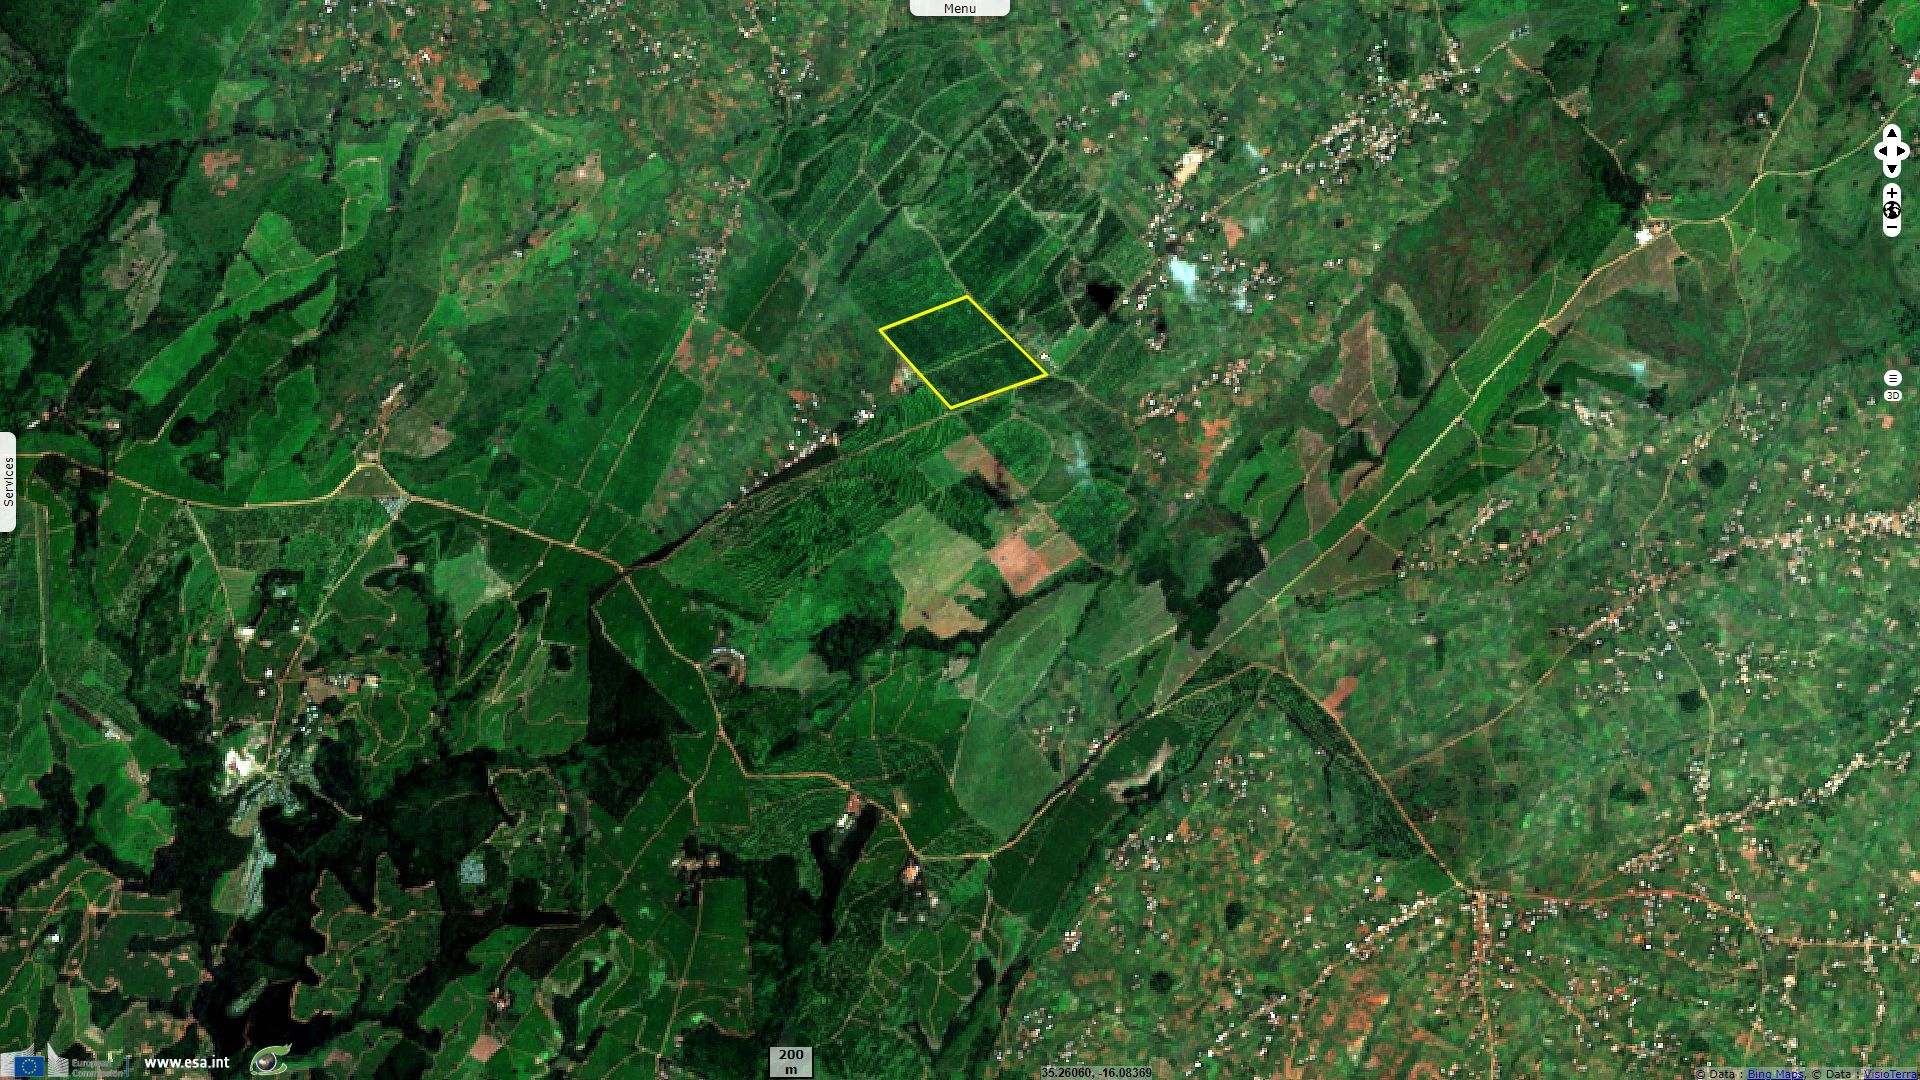
Sentinel-2 MSI acquired on 16 September 2018 at 07:36:09 UTC
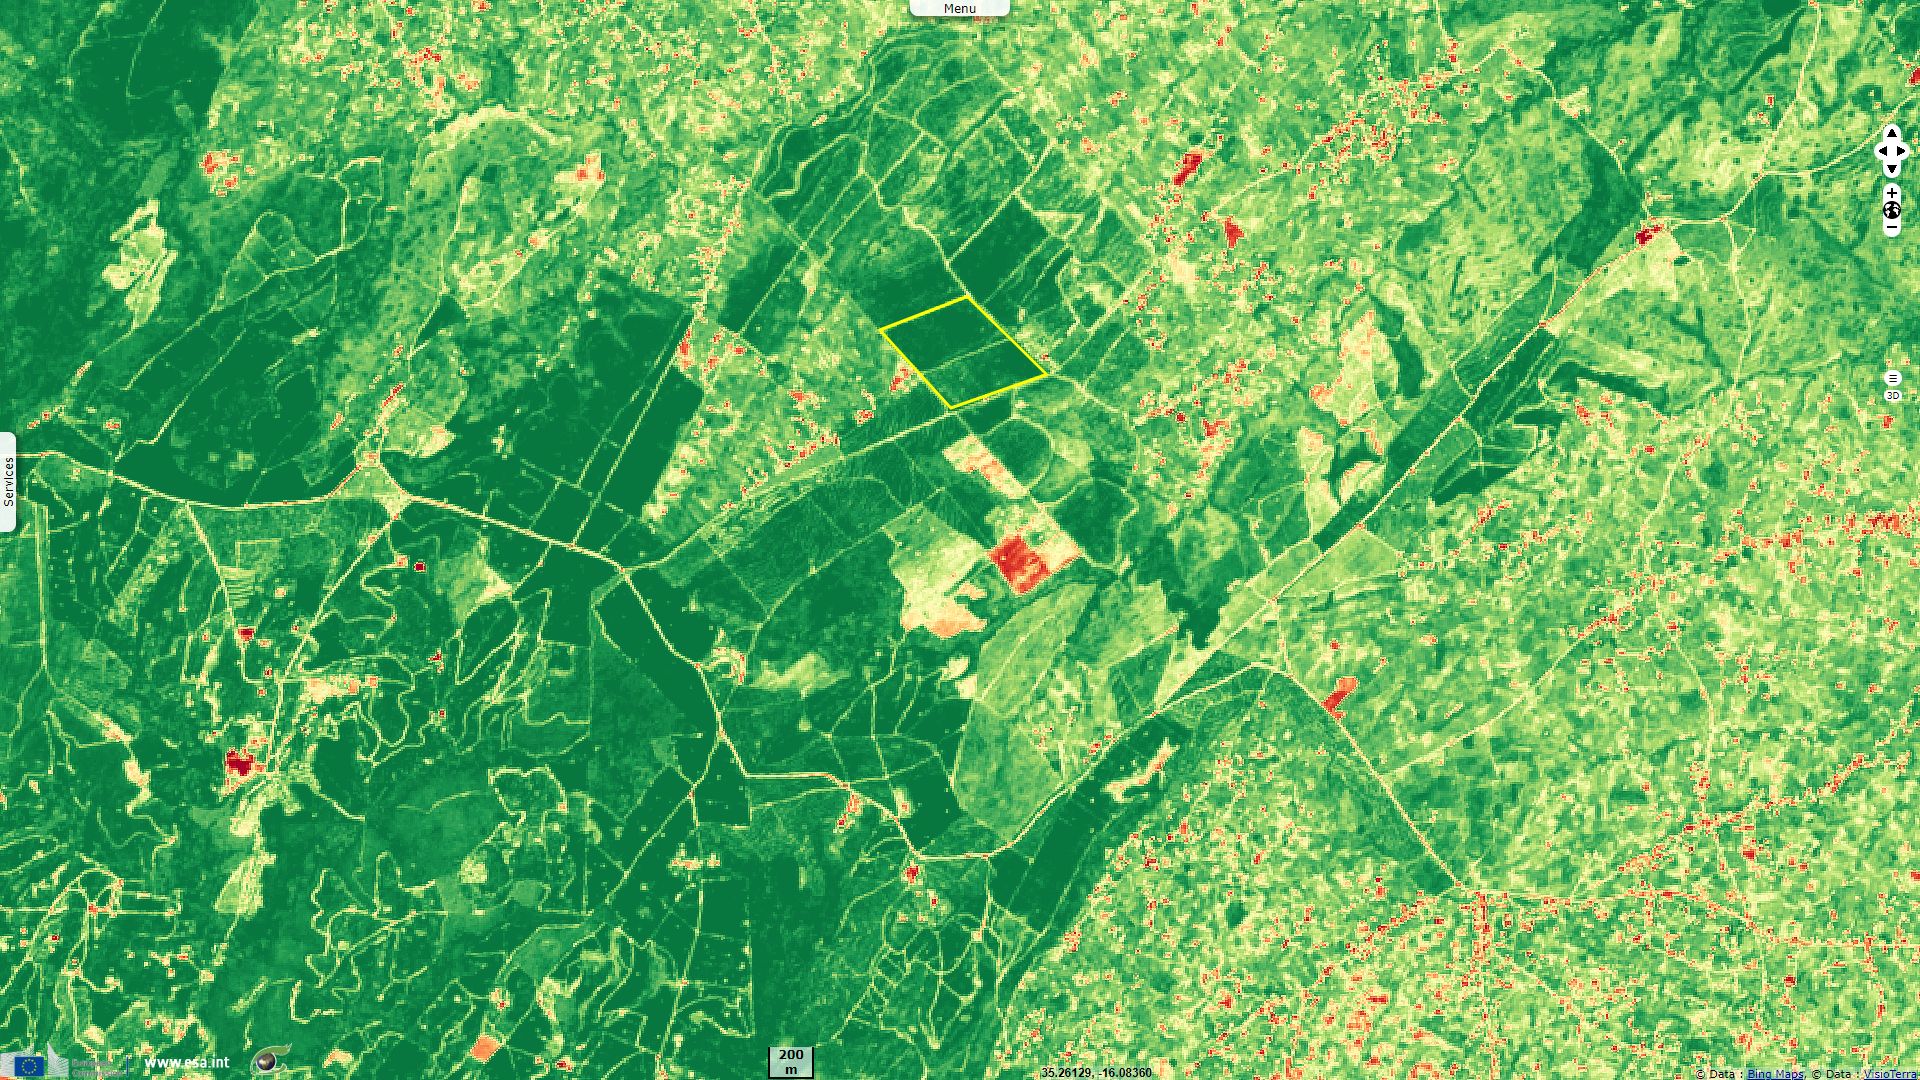
Sentinel-2 MSI acquired on 03 February 2019 at 07:41:29 UTC
...
Sentinel-2 MSI acquired on 17 February 2018 at 08:10:09 UTC
Sentinel-2 MSI acquired on 16 September 2018 at 07:36:09 UTC
Sentinel-2 MSI acquired on 03 February 2019 at 07:41:29 UTC
Keyword(s): Land, plateau, agriculture, Ethiopia, Ouganda, DRC, Kenya, Rwanda, Burundi, Tanzania, Zambia, Malawi, East Africa
Coffee is an important cash crop for many countries of the East African plateau as well as intermediate relief regions of Central and South America. As such, it is of prime importance for farmers to use the best practices, satellite imagery being one of the tools that can be used to improve productivity. Focusing on East Africa, this story intends to show exemples of this heterogeneity, explain some of its reasons and provide additional clues that can be used to identify coffee plantations.
In her thesis Using image analysis and GIS for coffee mapping released in April 2007, Sandra Bolanos wrote:
"Coffee systems are extremely variable (with respect to reflectance and topography) and their specific environmental conditions make difficult to determine a specific signature for each one." "The coffee systems can be extensively classified as: a) monoculture, also known as non-shade or Sun coffee b) polyculture, which is shaded coffee, consisting of mainly plantain over the coffee bushes and c) agroforestry systems (partially shaded coffee)."
In the article Classification of coffee-forest landscapes using Landsat TM imagery and spectral mixture analysis published in May 2013, Mikaela Schmitt-Harsh commented the effect on the mapping of coffee crops: "Coffee is often grown under the shade of trees (though the magnitude and extent of shade cover varies considerably across the globe; see Jha et al., 2011) compromising the spectral separability of forest classes from coffee. Even when grown under full sun, coffee-crop spectra may resemble that of forest spectra. In the Brazilian Amazon, for example, Lu et al. (2003a) found that sun coffee plantations had similar spectral responses to successional forests."
In the technical report Mapping and evaluating improved intercrop and soil management options for Uganda coffee farmers, Piet Van Asten explained why both are often grown together: "Coffee and cooking banana are the primary cash and food crops respectively for much of the African Great Lakes Region." "Coffee and banana are often grown by the same smallholder households and play a complementary role: coffee can provide households with a cash boom once or twice a year depending on the region, while bananas provide a continuous source of food, as well as some cash throughout the year (van Asten et al., 2011)." "The survey data across Uganda consistently shows that intercropping coffee and banana results in >40% more revenue for smallholders. The ability of the farmer to adopt this practice strongly depends on the suitability of the soil to accommodate both crops."
He also shows how banana trees can contribute positively to coffee crops: "Intercropping bananas in coffee seems to contribute to climate change adaptation through reduced sensitivity to drought and reduce incidence of certain diseases or pests that are generally lower in banana shade systems." "Shade provided by bananas was said to conserve soil moisture thus keeeping the root zone moist during drought periods." "Coffee under shade was greener; this was positively related to productivity and quality." "Banana residues contributed to mulch on coffee farms thus suppressing weeds and fostering soil improvement through nutrient recycling. Mulching depth thickness measurements revealed that intercropped coffee plots had a signicantly (p<0.05) thicker mulch layer than coffee monocrops".
Van Asten gives several explains the size of plots is not a significant indicator to discriminate coffee monocrops from intercrops: "There were no significant differences between sizes of farms or coffee plots of monocropping and intercropping farmers. It is important to keep in mind that some smallholder farmers could have more than one coffee plot and that one could be intercropped while the other one monocropped. So, even if farmers in the field explained that one of the drivers for them to intercrop coffee and banana was that they owned small plots, in none of the regions, monocropping was associated with bigger (or smaller) plot sizes than intercropping."
However Schmitt-Harsh offers several clues to distinguish coffee:
- "Because coffee is often grown in topographically heterogeneous landscapes, the potential contribution of using thermal band data in coffee-forest discrimination is expected to be high, though research investigating this area remains limited."
- "Coffee and banana yields varied with Coffee and Banana densities in the intercrop".
- "Optimal plant densities for intercropping of coffee and banana intercrop would ideally vary between regions, farms, and even within fields. However, we do notice that best performance is generally associated with 600 - 800 banana mats per hectare to 2000-2400 Arabica coffee trees per ha or 1000-1200 Robusta coffee trees per ha."
In the article Phenological characterization of coffee crop Coffea arabica published in December 2013, Antonio Felipe Couto Junior added other clues regarding the cycle of life of coffee bushes:
"The complete phenological cycle of coffee is for two years, with the development of vegetative branches in the first year and flowering in the second year (Camargo & Camargo, 2001). Among the various models developed, we adopt the subdivision proposed by Camargo & Camargo (2001) with six phenological stages: two stages in the first year and four stages in the second year."
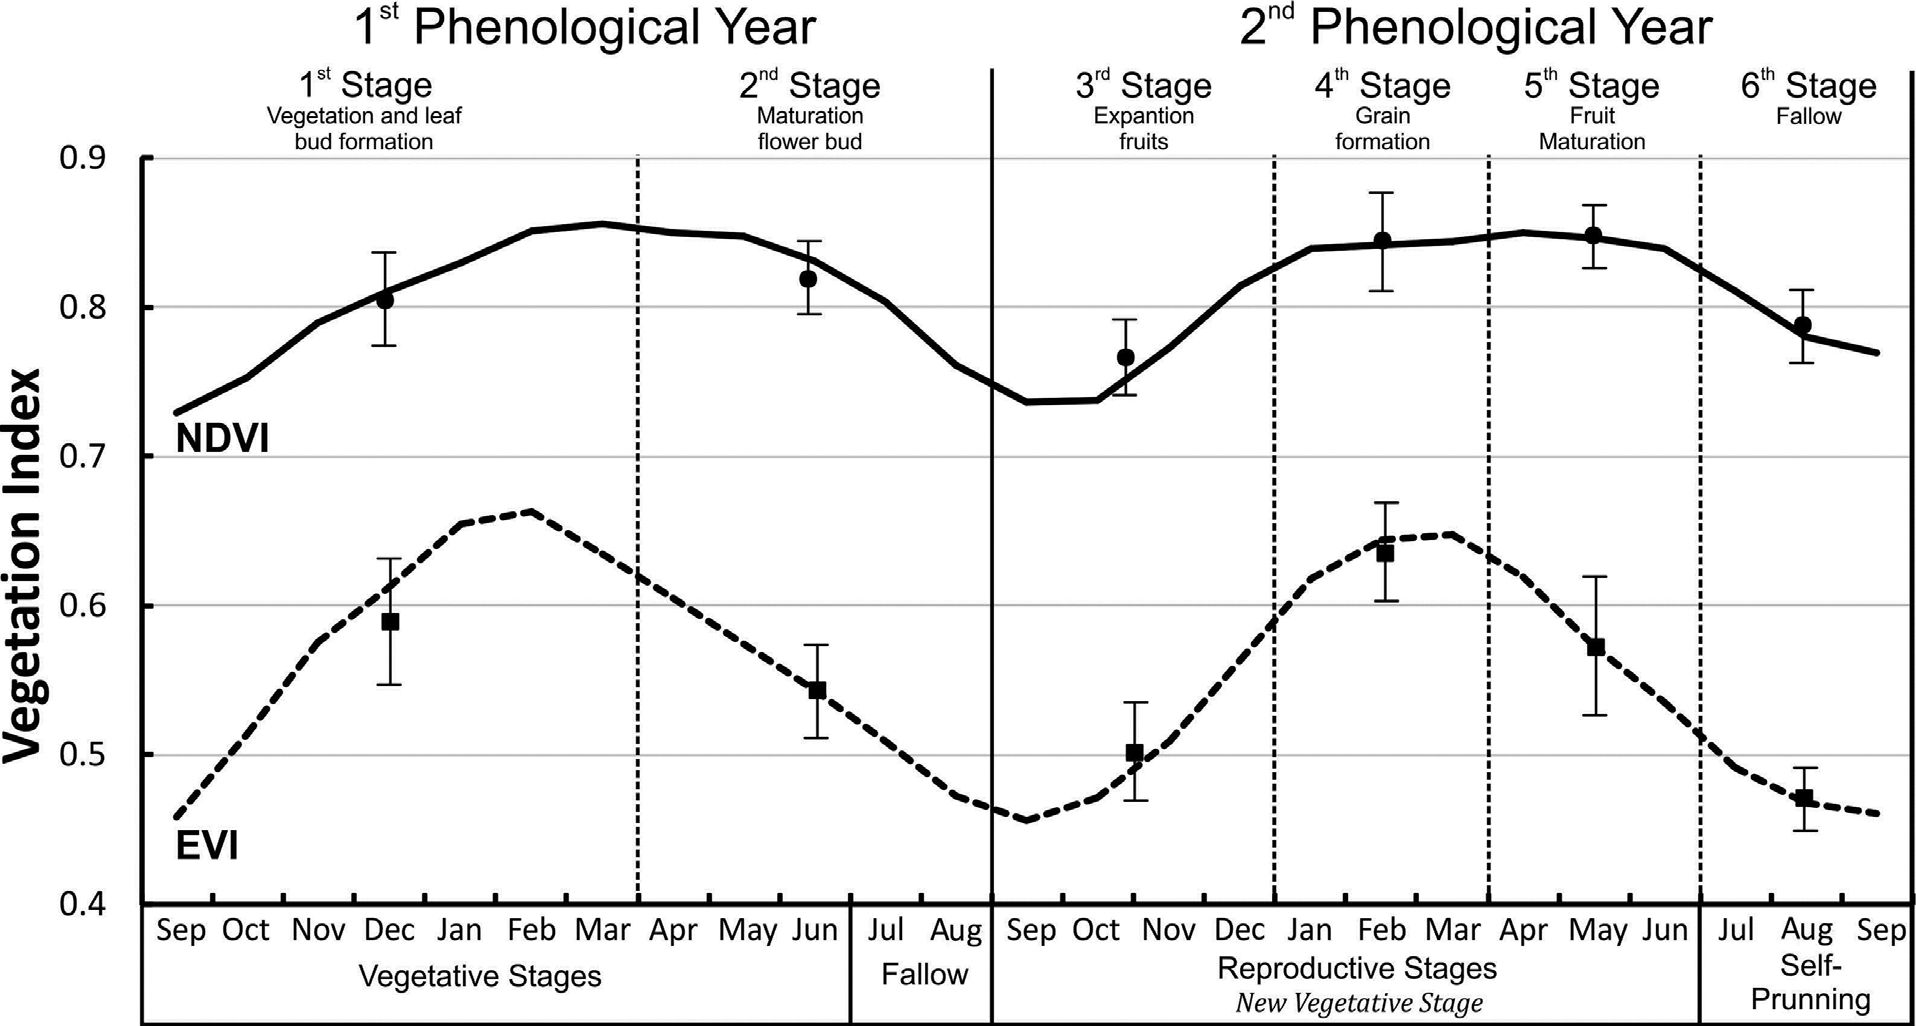
- "In the first phenological year, the first phase develops vegetative buds, usually occurring between September and March, when the days are longer (Camargo & Franco, 1985). The second stage marks the reproductive phase with induction, differentiation, growth and dormancy of flower buds, from April to August. Over the last two months, the dormant buds produce a pair of small leaves, marking the end of the first phonological year (Camargo & Camargo, 2001)."
- "In the second year phenological, the third phase (September to December) starts at blossom after water stress, achieving the expansion of the fruits (Camargo & Franco, 1985). Fourth stage occurs between January and March with the grain formation, when a water stress can be detrimental to the development of these grains (Meireles et al., 2009). Fifth stage corresponds to the fruit maturation between April and June, with a moderate water deficit that benefits the product. In the last stage there is the self-prunning process represented physiologically by senescence (July-August), when the productive branches wither and die, limiting its vegetative growth (Camargo & Camargo, 2001)."
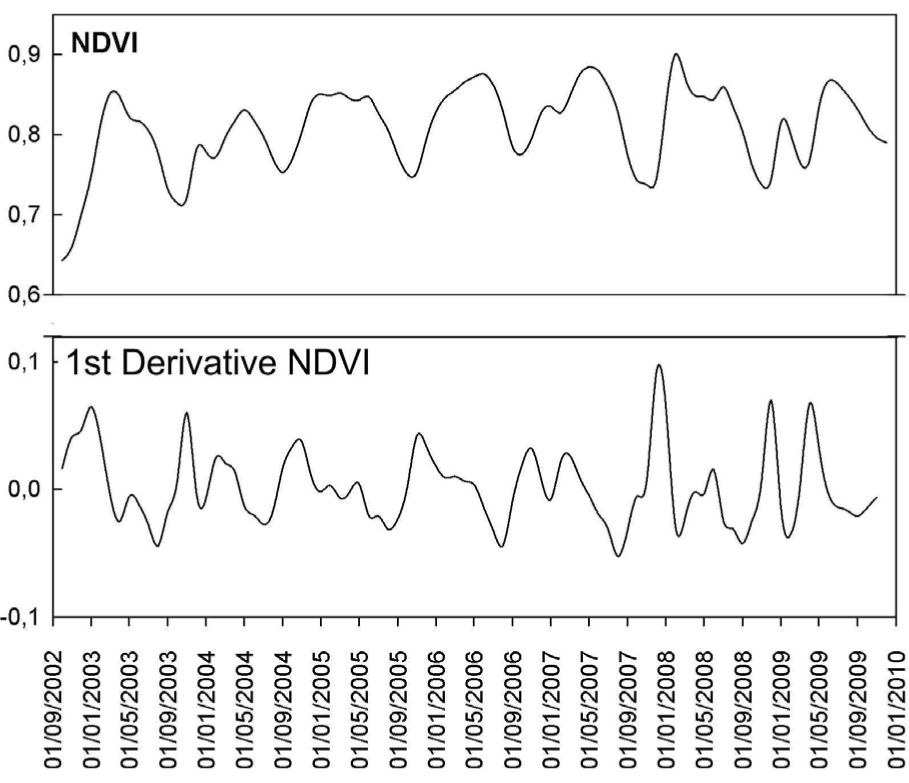
NDVI temporal profiles in relation to the Arabica coffee phenological cycle (24 months). The markers correspond to averages with their confidence intervals of 95%, NDVI is represented by the black circle, and EVI by the square - Source: Antonio Felipe Couto Junior