10 years of wars in Syria: Illegal oil refineries in northern Syria
Landsat TM acquired on 05 December 2010 from 07:46:43 to 07:47:07 UTC
Landsat8 OLI-TIRS acquired on 27 December 2013 at 08:11:04 UTC
Sentinel-1 CSAR IW acquired on 08 December 2014 from 03:17:40 to 03:18:05 UTC
Sentinel-2 MSI acquired on 22 December 2015 at 08:03:42 UTC
Sentinel-1 CSAR IW acquired on 10 December 2017 from 03:17:11 to 03:17:36 UTC
Sentinel-2 MSI acquired on 31 December 2017 at 08:03:31 UTC
Sentinel-1 CSAR IW acquired on 06 December 2020 from 03:17:30 to 03:17:55 UTC
Keyword(s): Security, oil and gas, pollution, armed conflict, Syria
"Unregulated oil extraction in areas of armed conflict poses a serious threat to ecosystems, leading to soil contamination and water pollution, and is associated with the total destruction of ecosystems near the exploited areas.", writes Samira Mobaied, Franco-Syrian Research Scientist specialized in the interrelationships between socio-political changes and environmental governance in Syria for the French National Museum of Natural History.
Hussein Almohamad, a Syrian professor at the department of geography of Justus Liebig University of Giessen added in his article Oil in Syria between Terrorism and Dictatorship published in January 2016 in Social sciences: "IS controls the main oilfields in Deir ez Zor province. In the province of Hasaka, IS controls the oilfields in southern Hasaka. In Raqqa province, the militants control all the small oilfields found in the area. IS also recently seized control of a number of oil and gas fields in central Syria (Homs province)."
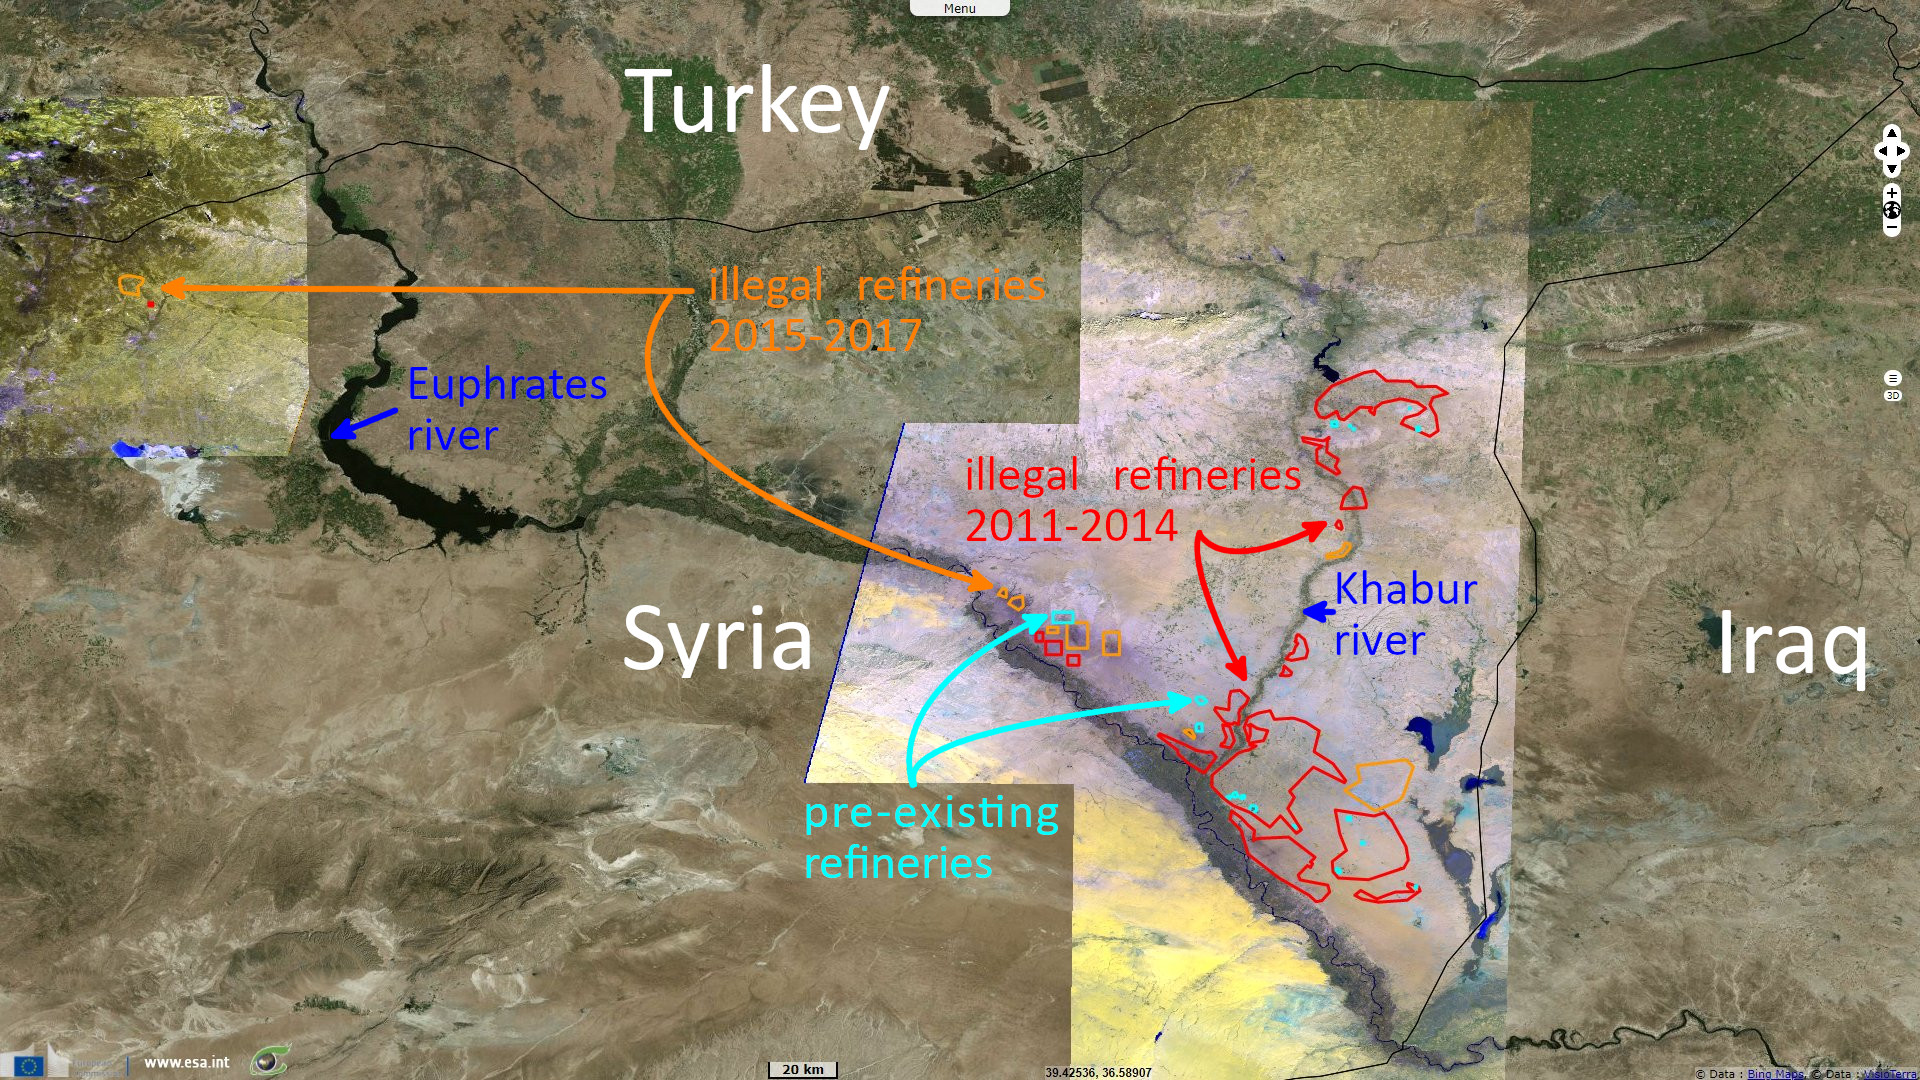
"The observation of the emergence and evolution of illegal refineries is possible from ESA Sentinel-2 images, which offers a very relevant tool in several areas, including the study of the impact of these refineries on the environment. The appearance of illegal refineries was frequently observed in north-eastern Syria during the period of control by armed groups and militias between 2013 and 2019, with oil being one of the main sources of funding for these groups." completes Samira Mobaied.
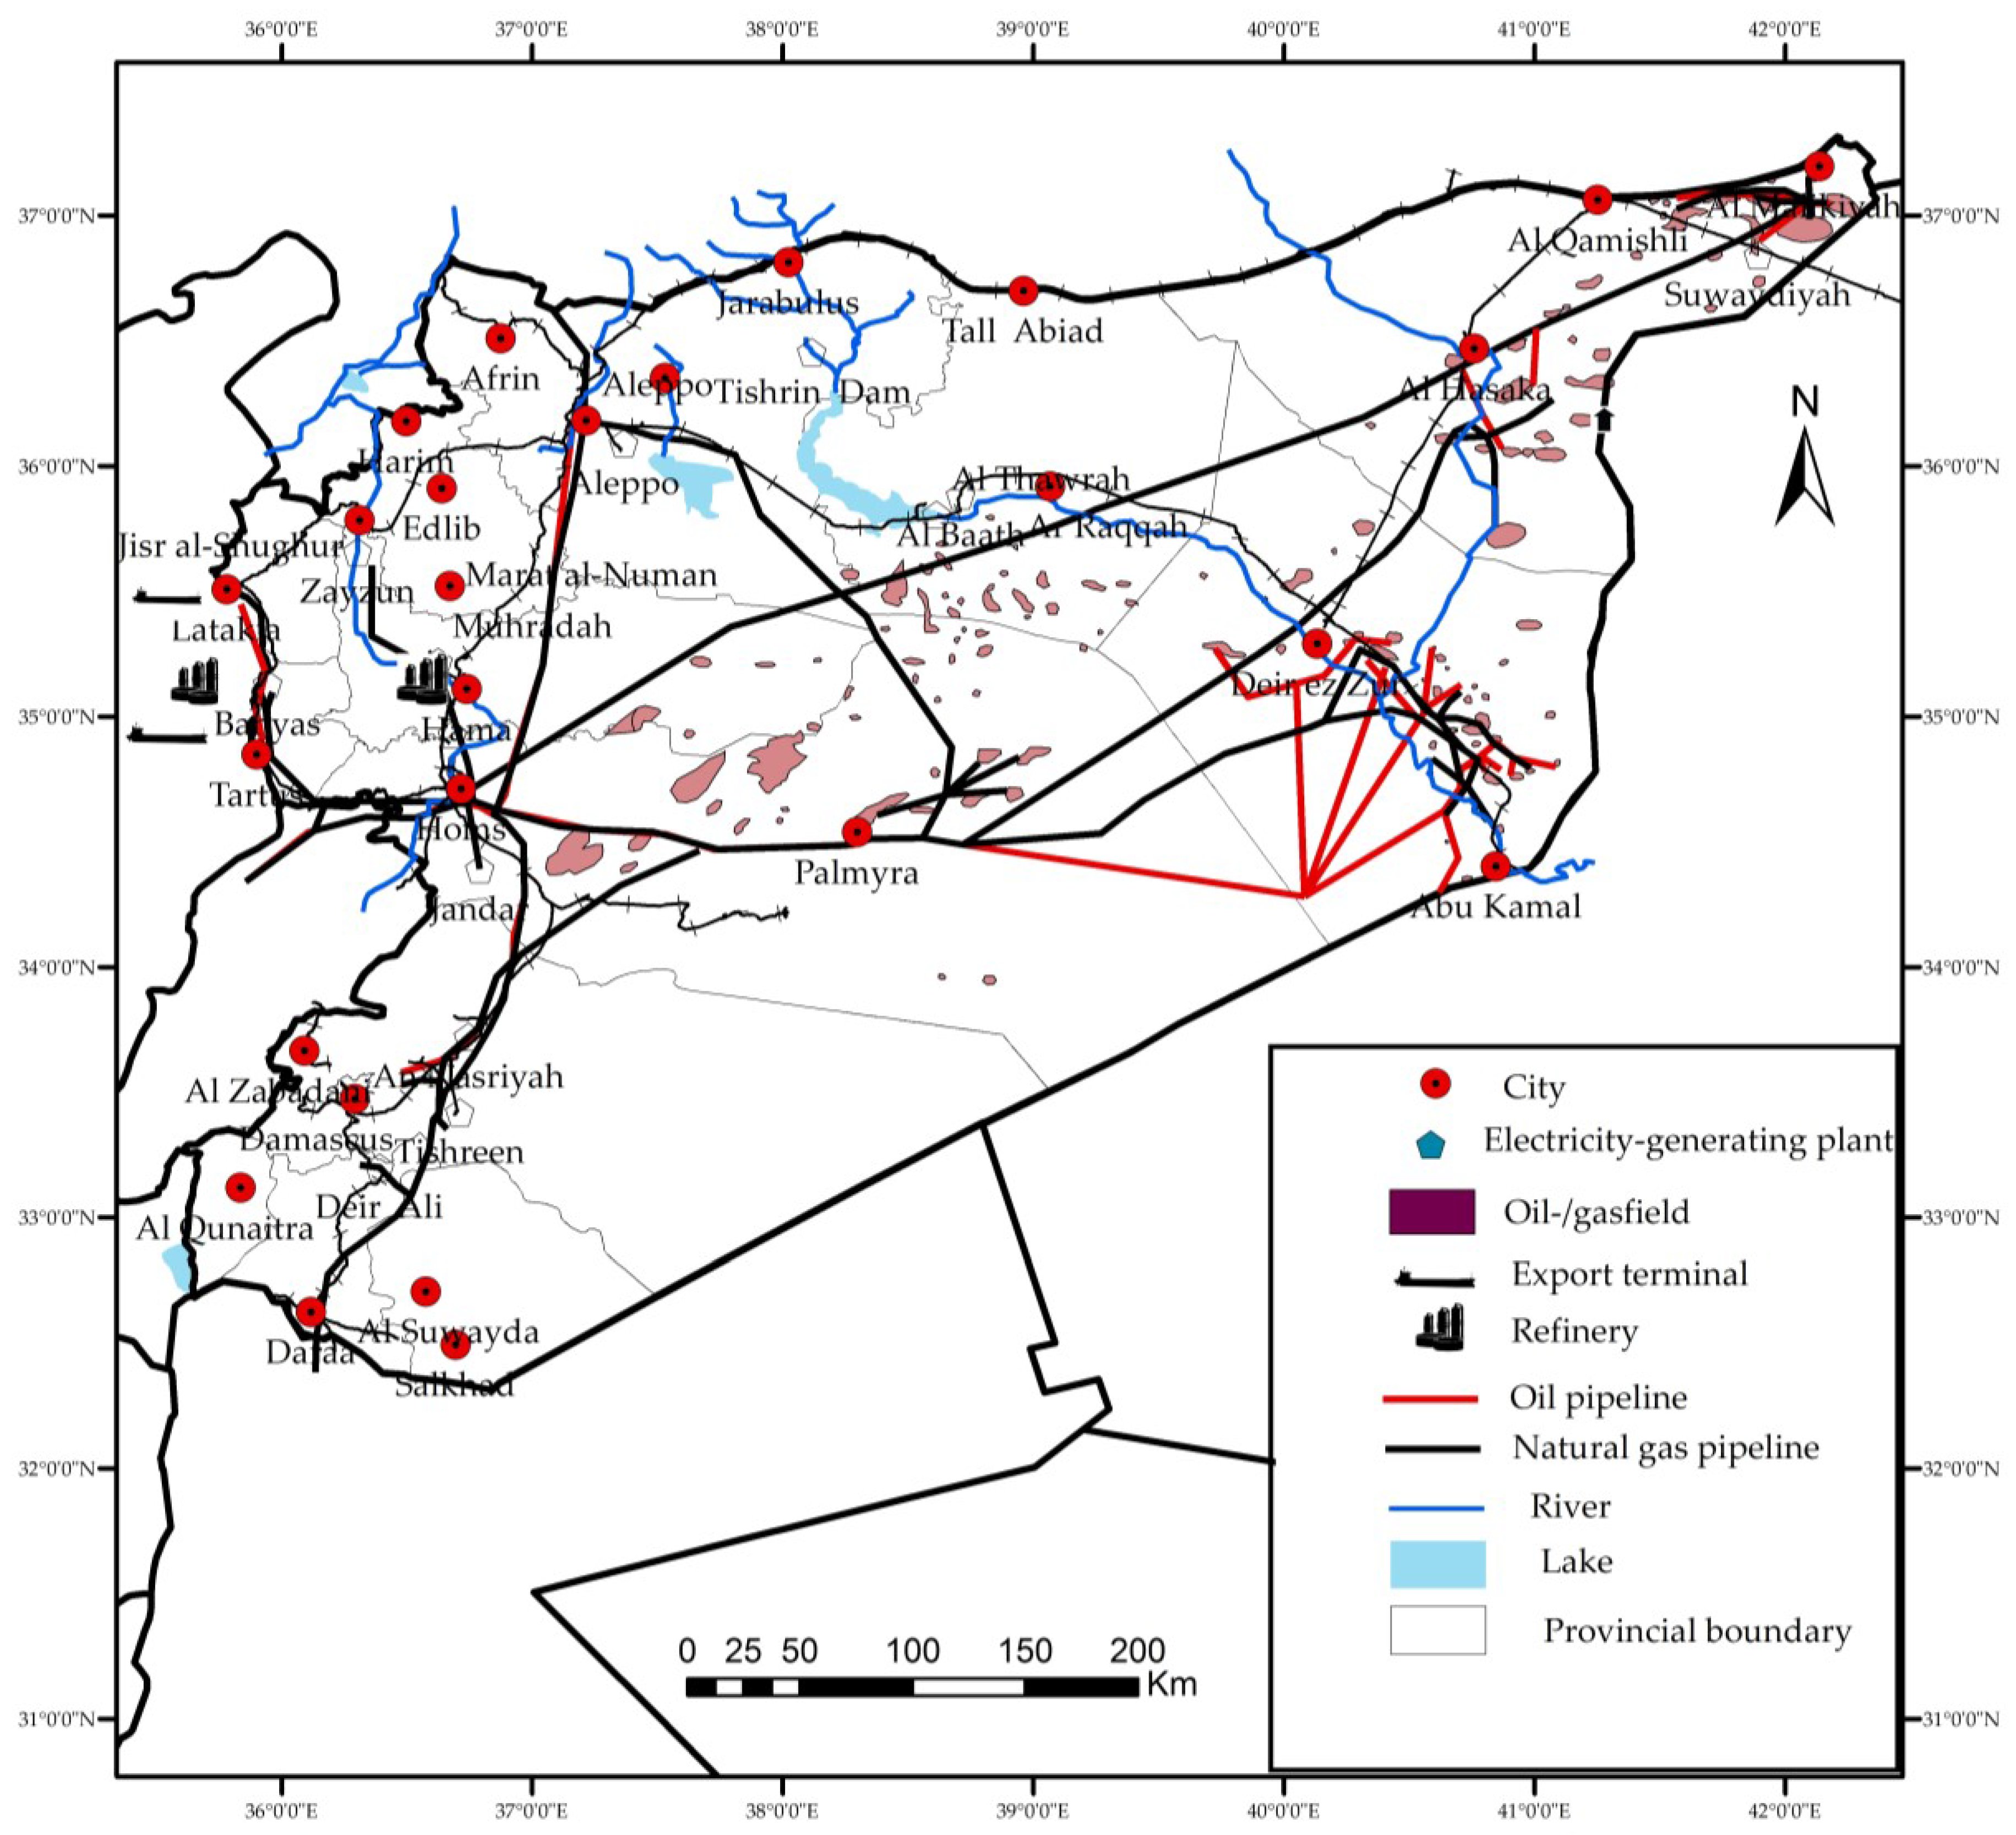
Geographical distribution of oil and natural gas deposits, refineries and pipelines source: Oil in Syria between Terrorism and Dictatorship by Hussein Almohamad.
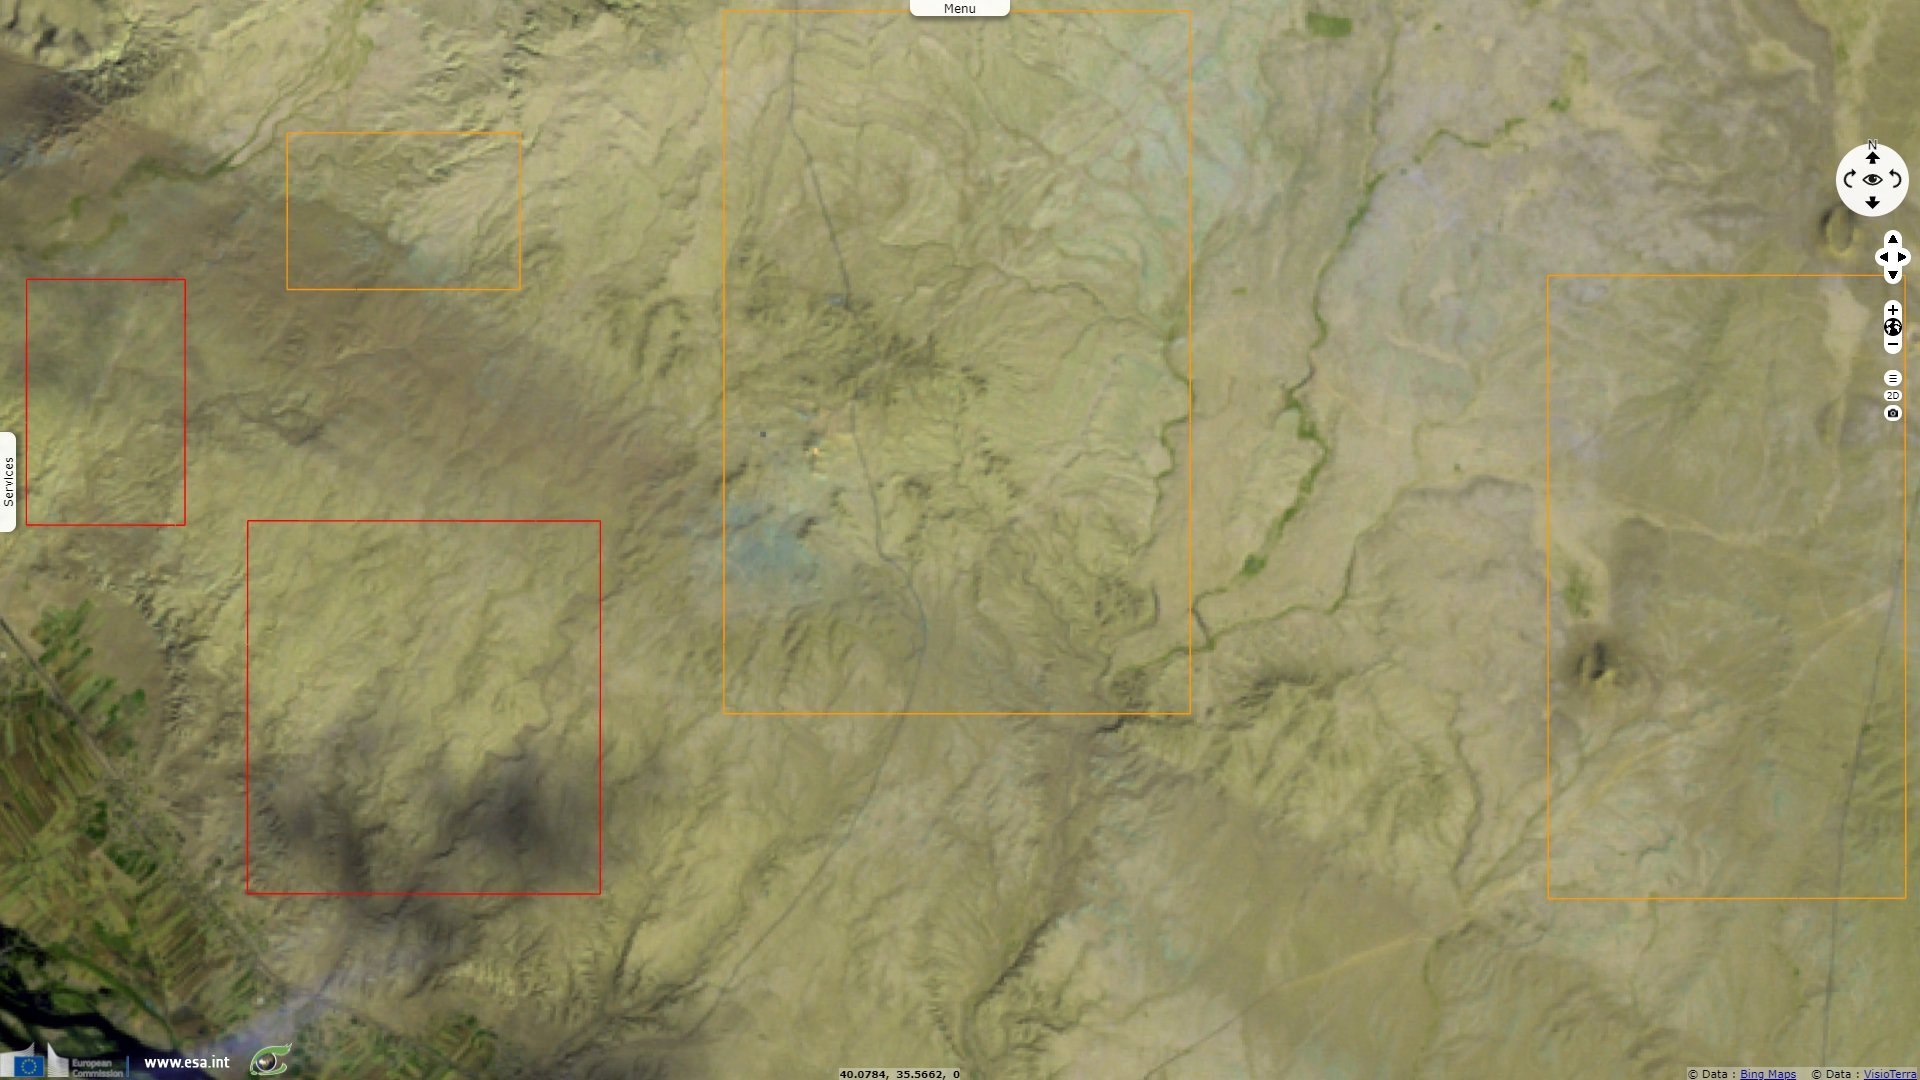
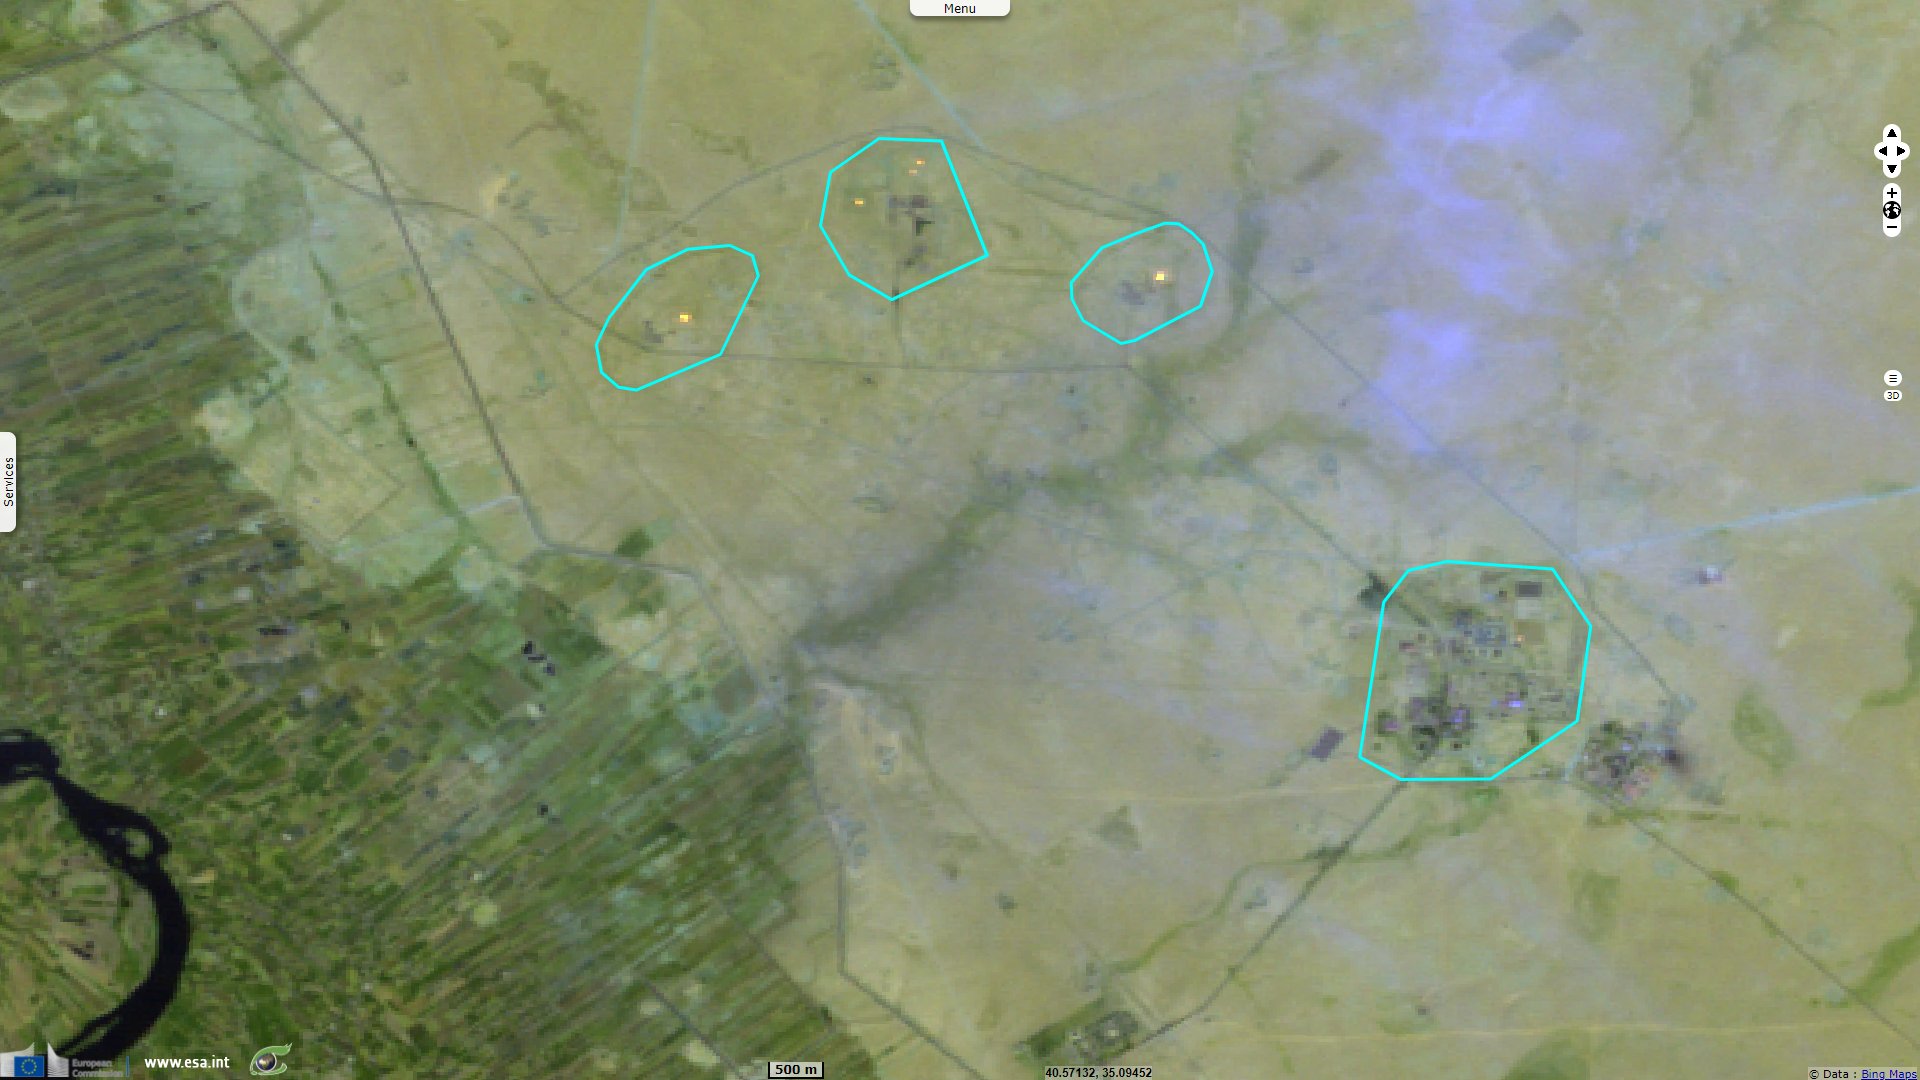
"Image of the desert of Deir ez-Zor governorate in 2010, before the outbreak of the war in Syria."
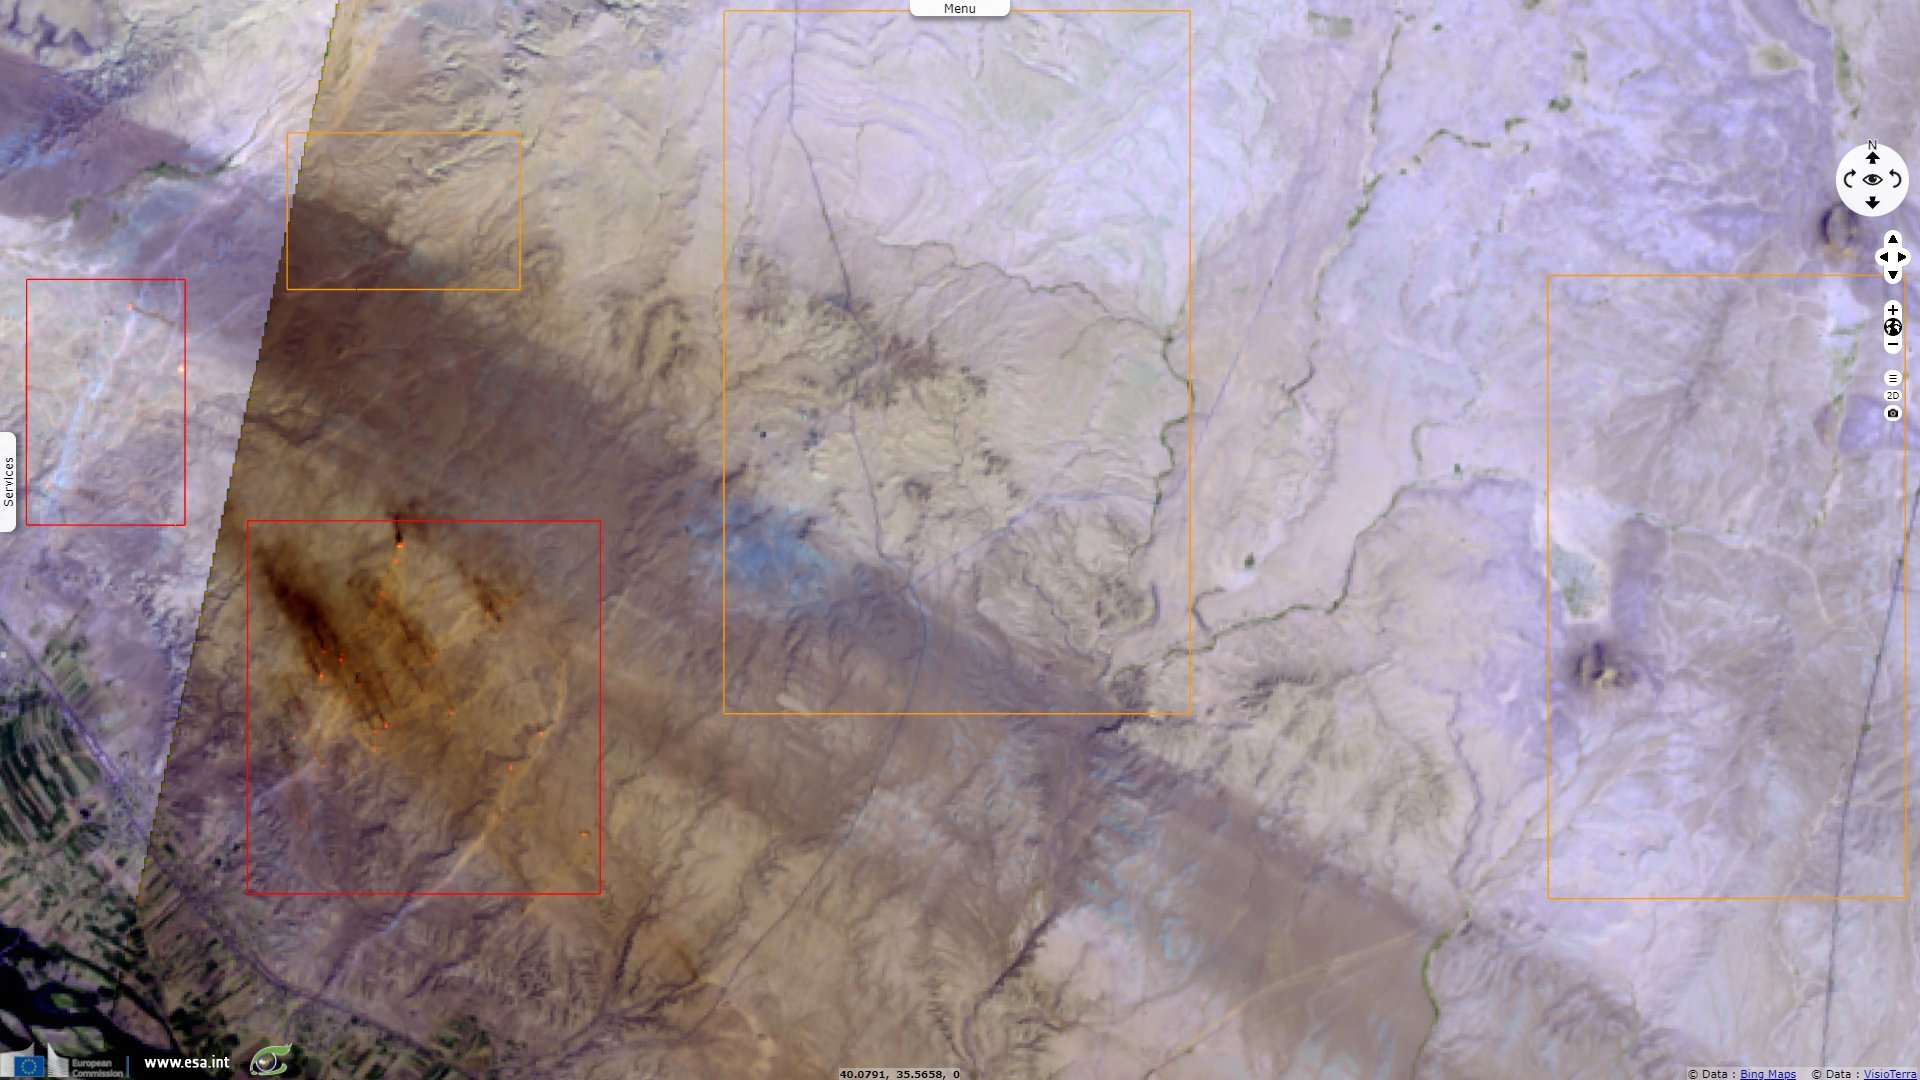
This 2013 image shows the same control area (as in Figure 2) located in Deir ez-Zor governorate mostly under the control of the Daech in 2013. "Illegal refineries can be detected at south-west (within the red rectangles) for two reasons:A pattern of dark dots shows on Sentinel-2 images owing to their finer resolution.
- The distillation vessels are heated to about 400 degrees, the hot spots appear on the optical images with reddish-orange pixels using two medium infrared channels.
- The refineries and the black smoke they emit can be seen in these optical images.
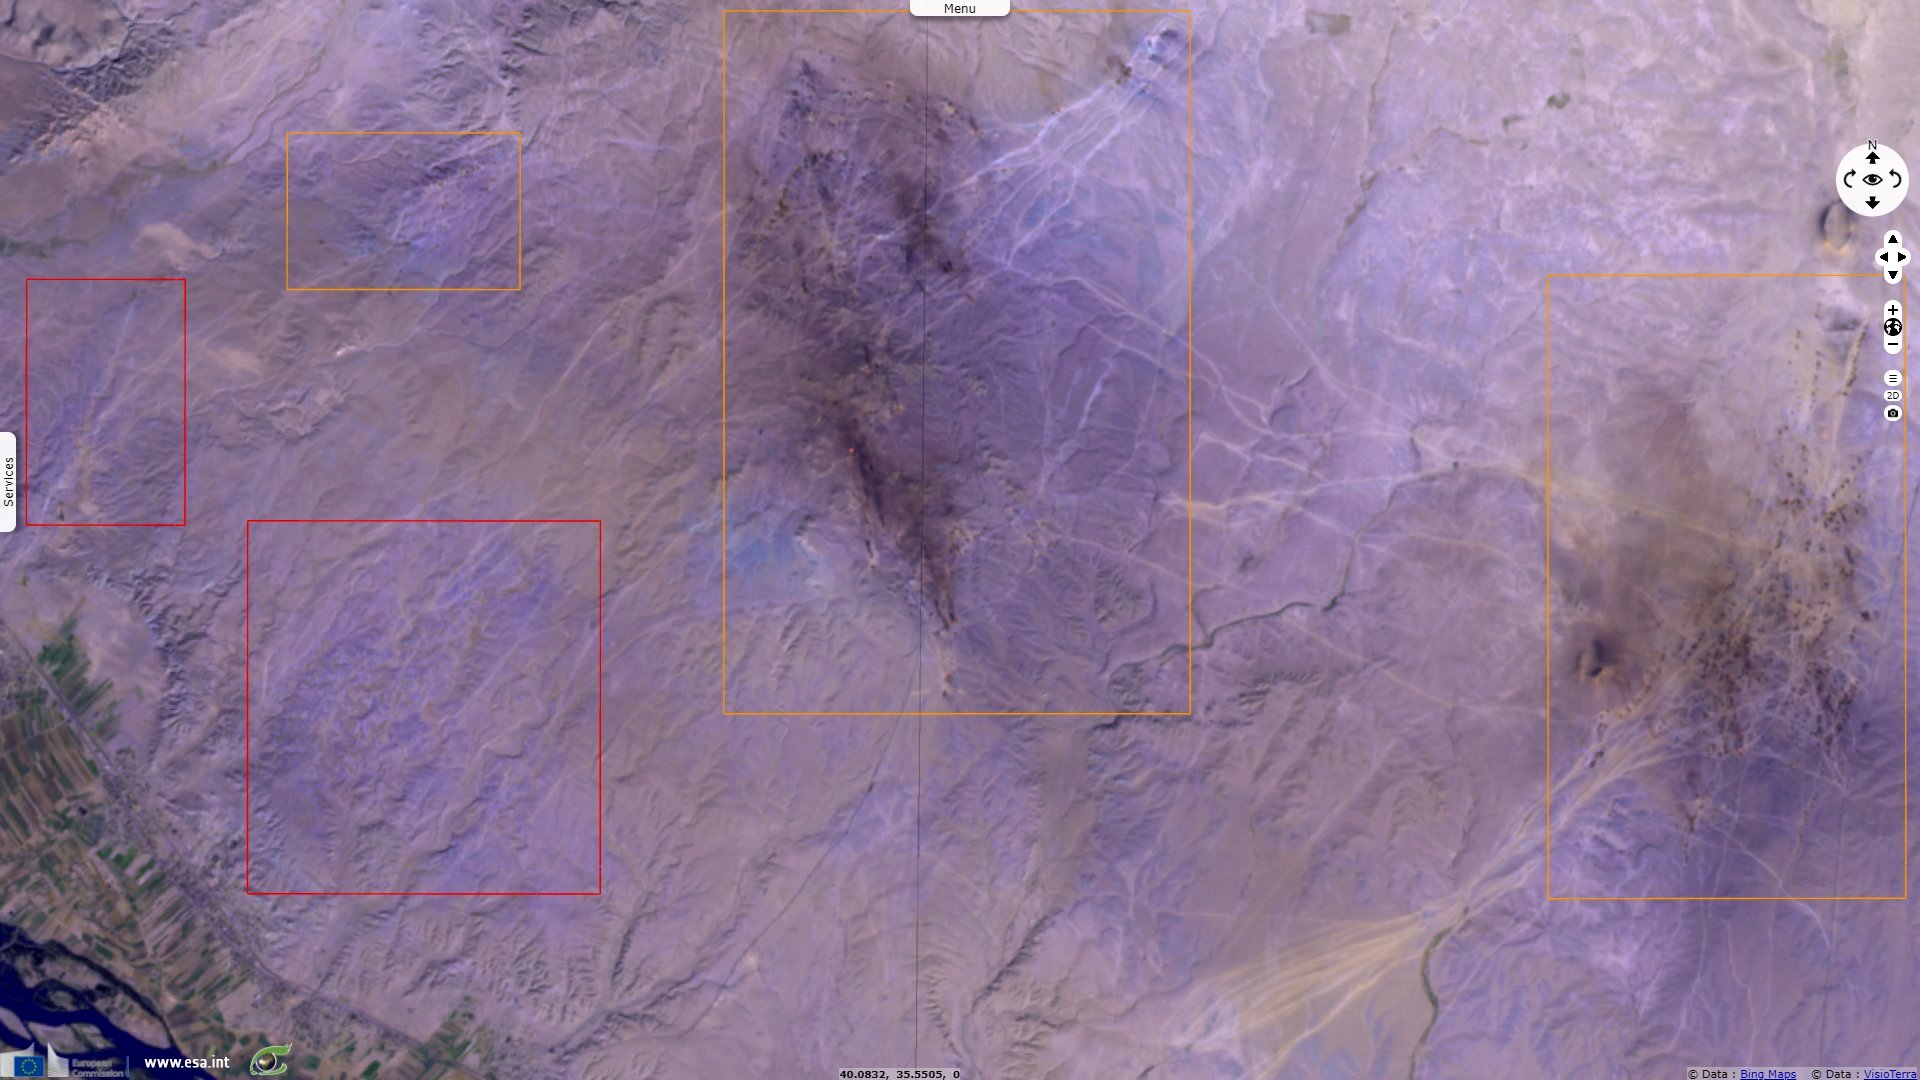
This 2015 image shows the same control area (as in Figure 2) in the governorate, then totally under the control of the Daech. Compared to 2013, the refineries have moved from the banks of Euphrates (red rectangles) to further locations (orange rectangles).
Regarding the refining methods, Hussein Almohamad described the artisanal process: "IS depends on pre-existing equipment to extract oil from the fields controlled by it and relies on primitive methods for refining the extracts. IS uses the incineration method, whereby crude oil is extracted from wells without freeing it from water and gas. It is then transferred to dirt digs for workers to wait for water to settle down at the bottom and gas to evaporate from the surface. The oil is then placed in reservoirs, where it is burned directly in order to derive diesel, gas, and gasoline. Workers can differentiate these items by changes in colour and smell. Also, local investors bring in Chinese- and Turkish-made makeshift refineries via Turkey, some of which process 500–1000 b/d.
When the international coalition began its operations against IS, though it targeted refineries in outfit-controlled areas, it generally avoided strikes on oil wells because of the potential impact on civilians and also because it seeks to preserve key oil infrastructure for the post-conflict period, causing IS to resort to selling unrefined crude oil. For this reason, the citizens were forced to establish incinerators and primitive refineries. OMORAN estimates that there are more than 3500 primitive refineries in areas held by IS and rebels."
These makeshift refineries where relocated during the cival war: "According to Foreign Policy magazine, before the onset of US airstrikes in summer 2014, IS was estimated to be producing more than 80 000 b/d and selling it in the black market for about $1 million to $3 million per day. It has been estimated that US airstrikes destroyed about 50% of IS’s refining capacity by early October 2014." "In spring 2016, the products of oil probably fell by half (30 000b/d) because of Russian, American and Kurdish attacks."
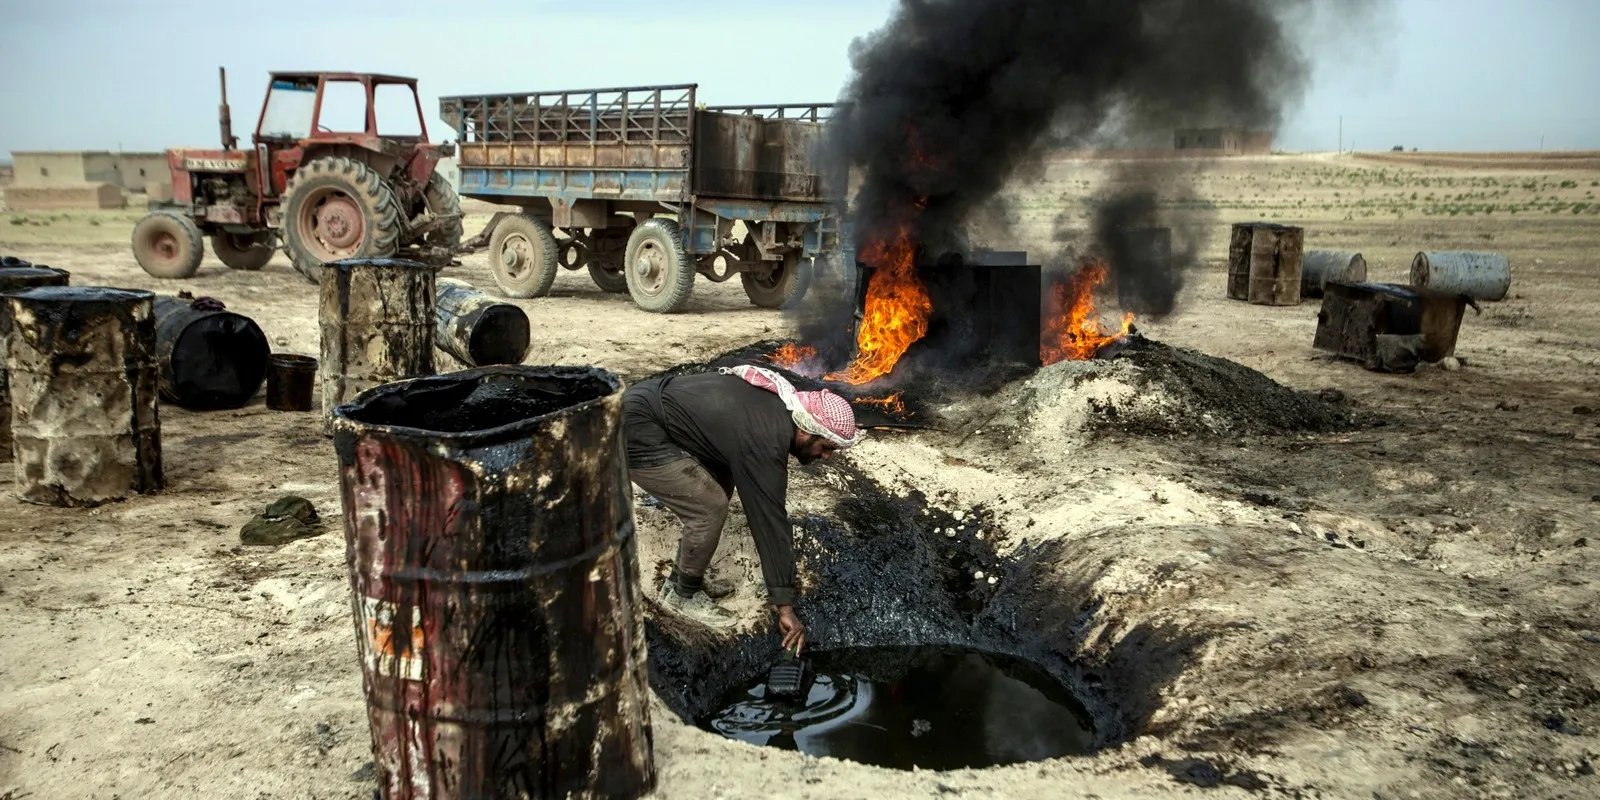
Exemple of artisanal refinery - Source.
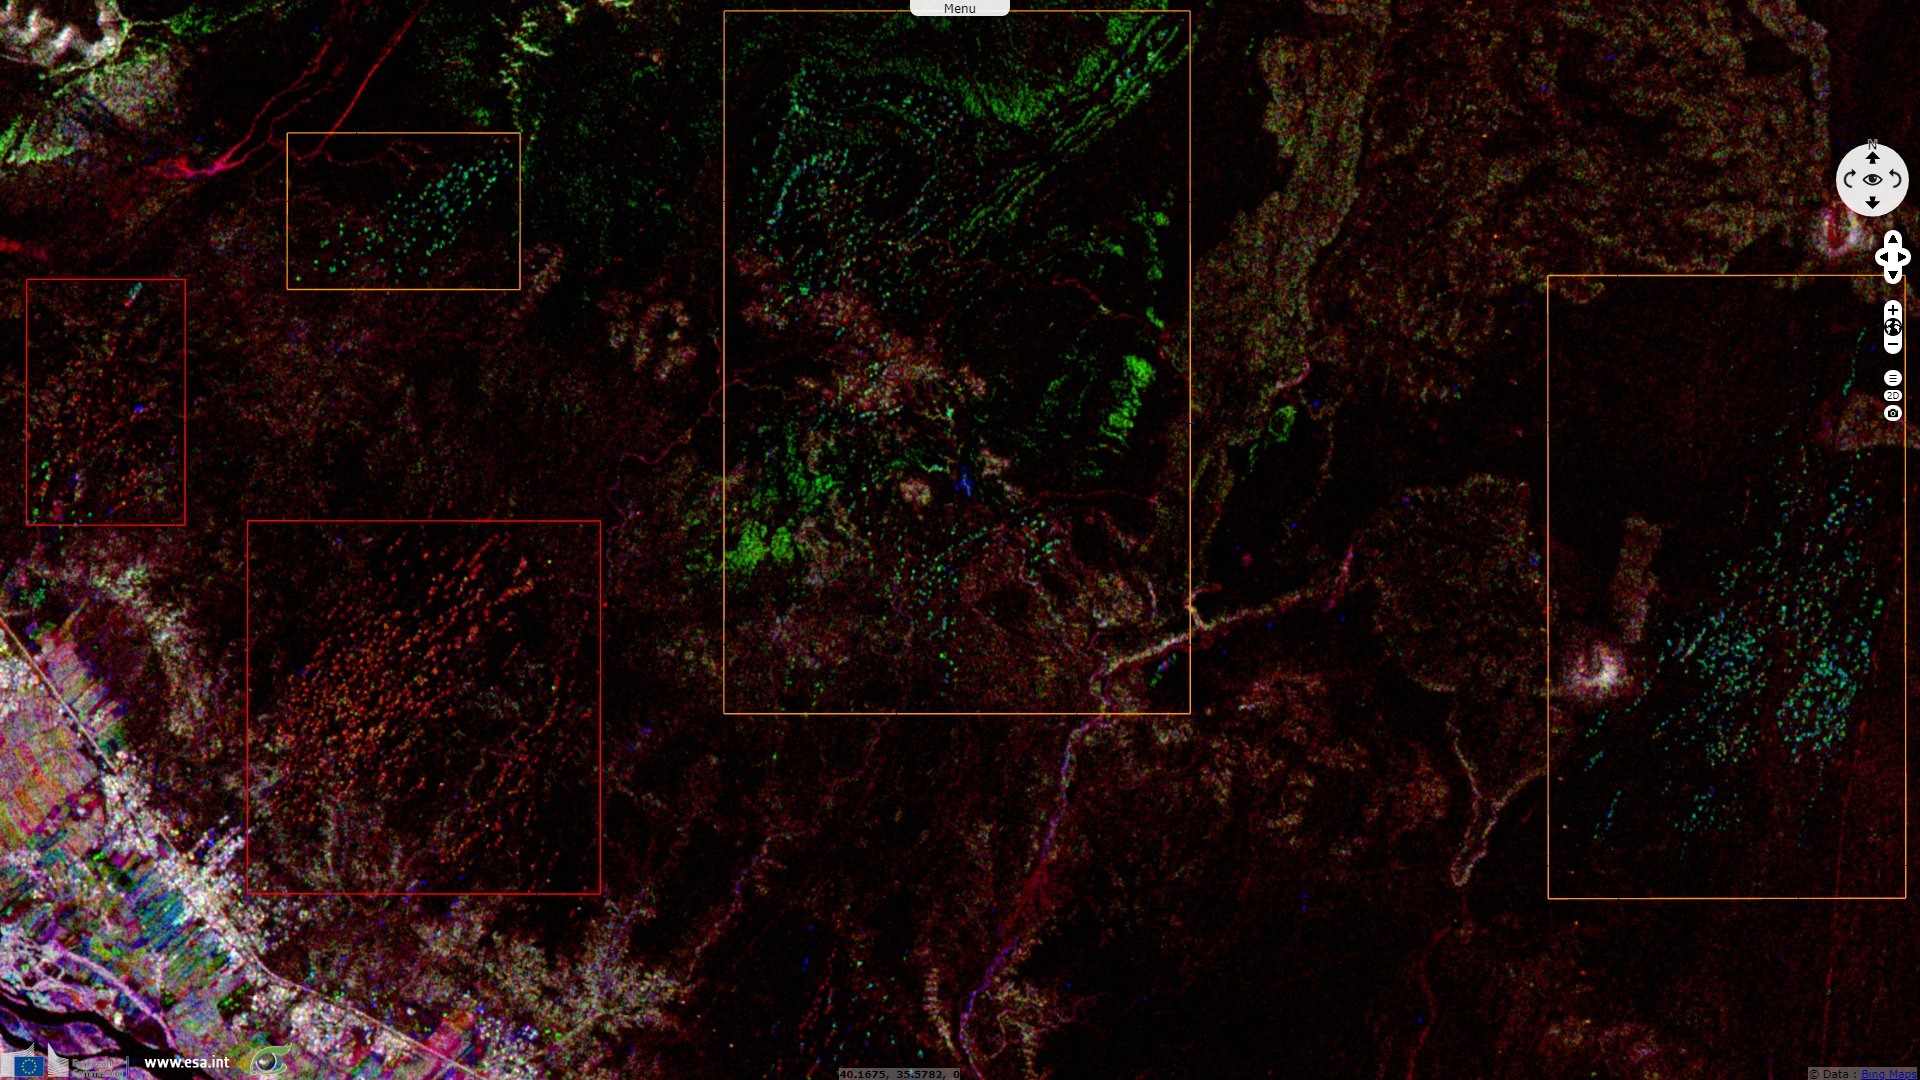
This radar image shows the same control area (as in Figure 2). Figure 5 is a coloured composite in vh polarisation in sigma0-dB using
- in the red channel: the average of 08 December 2014, 01 January 2015 and 13 January 2015,
- in the green channel: the average of 10 December 2017, 22 December 2017 and 03 January 2018,
- in the blue channel: the average of 06 December 2020, 18 December 2020 and 30 December 2020.
"A comparison using optical images between the legal refineries (Figure 6) that were present in north-eastern Syria before the start of the war in 2010 and the illegal refineries (Figure 3 and Figure 4) shows that the distillation tanks heated to around 400 degrees appear the same in both cases. There is a difference in texture between the images of the legal and illegal refineries: the building areas near the hot spots appear better organised and structured for the legal refineries" with tanks, roads and walls surrounding the preexisting refineries.
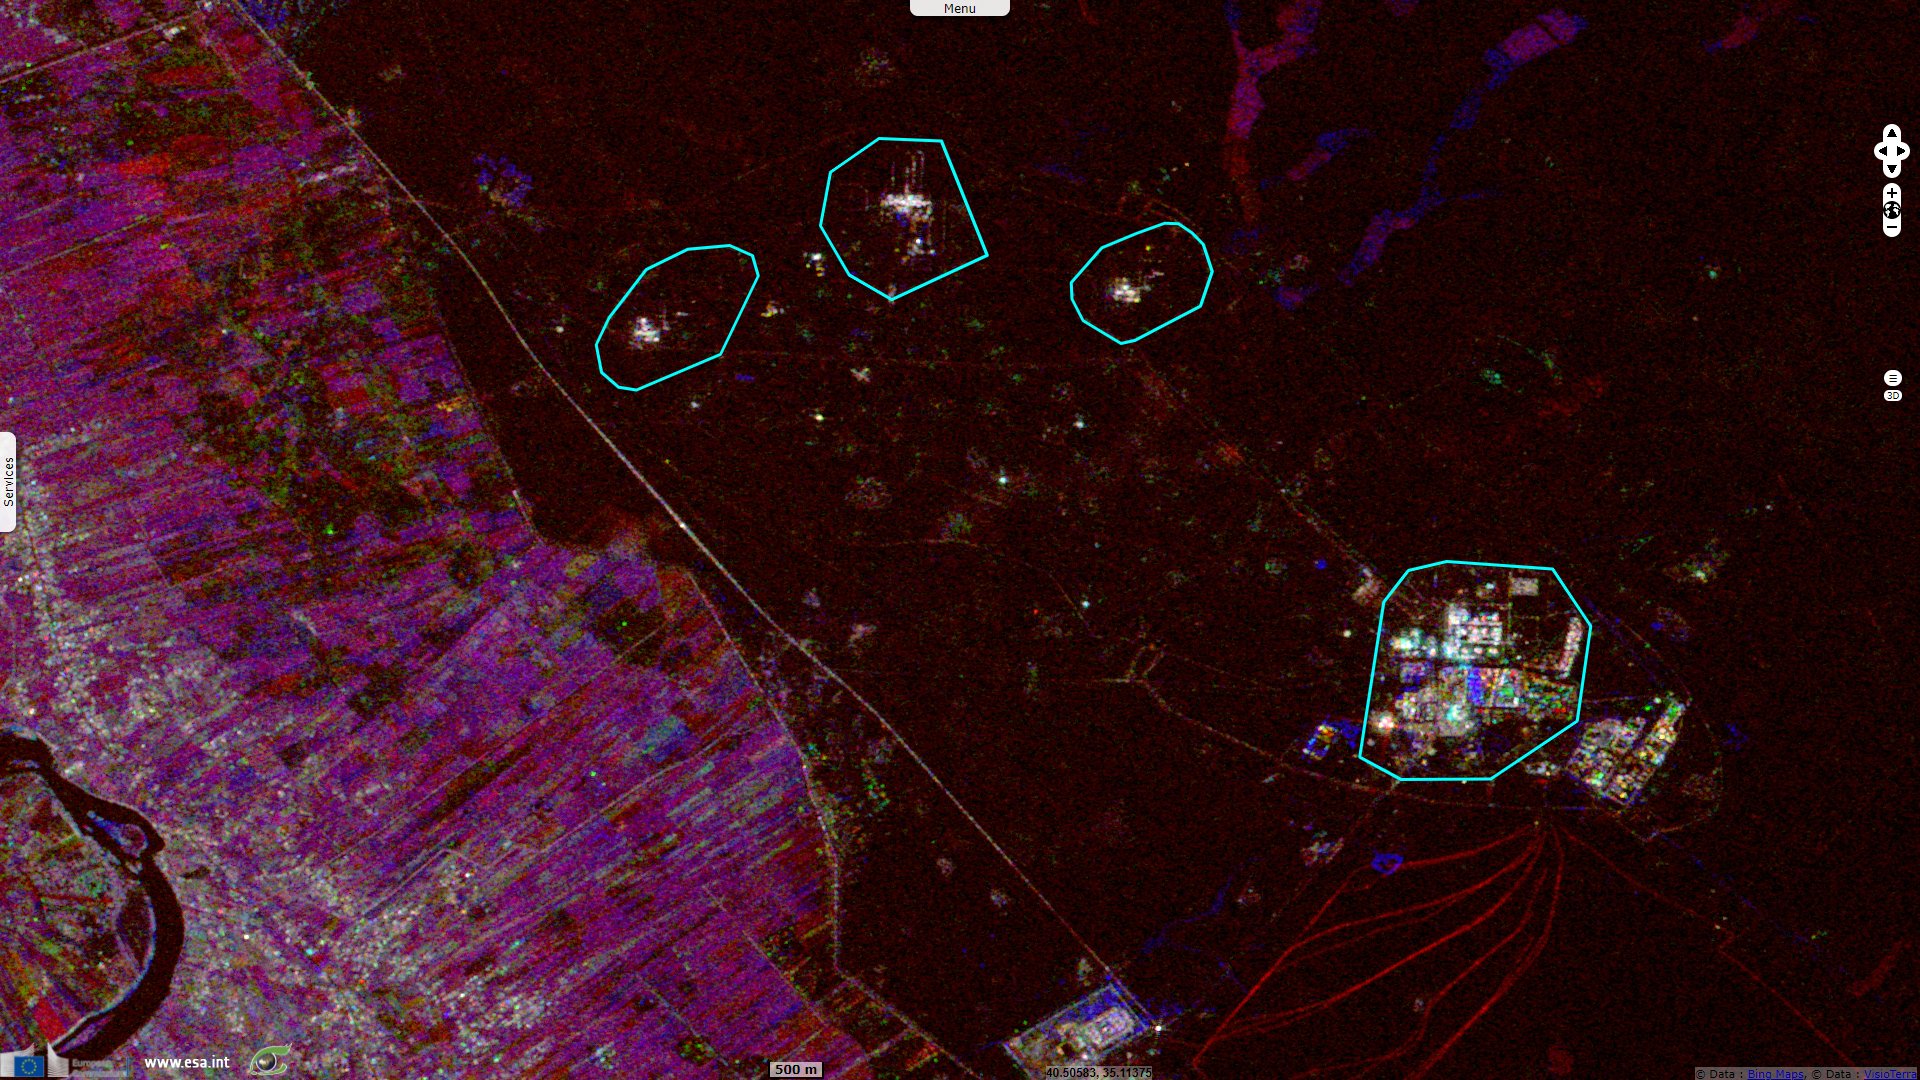
The radar comparaison shows the legal refineries are bigger structures than the dots visible on Figure 5. The white colour indicates they were present in 2014, 2017 and 2020, unlike the artisanal refineries.
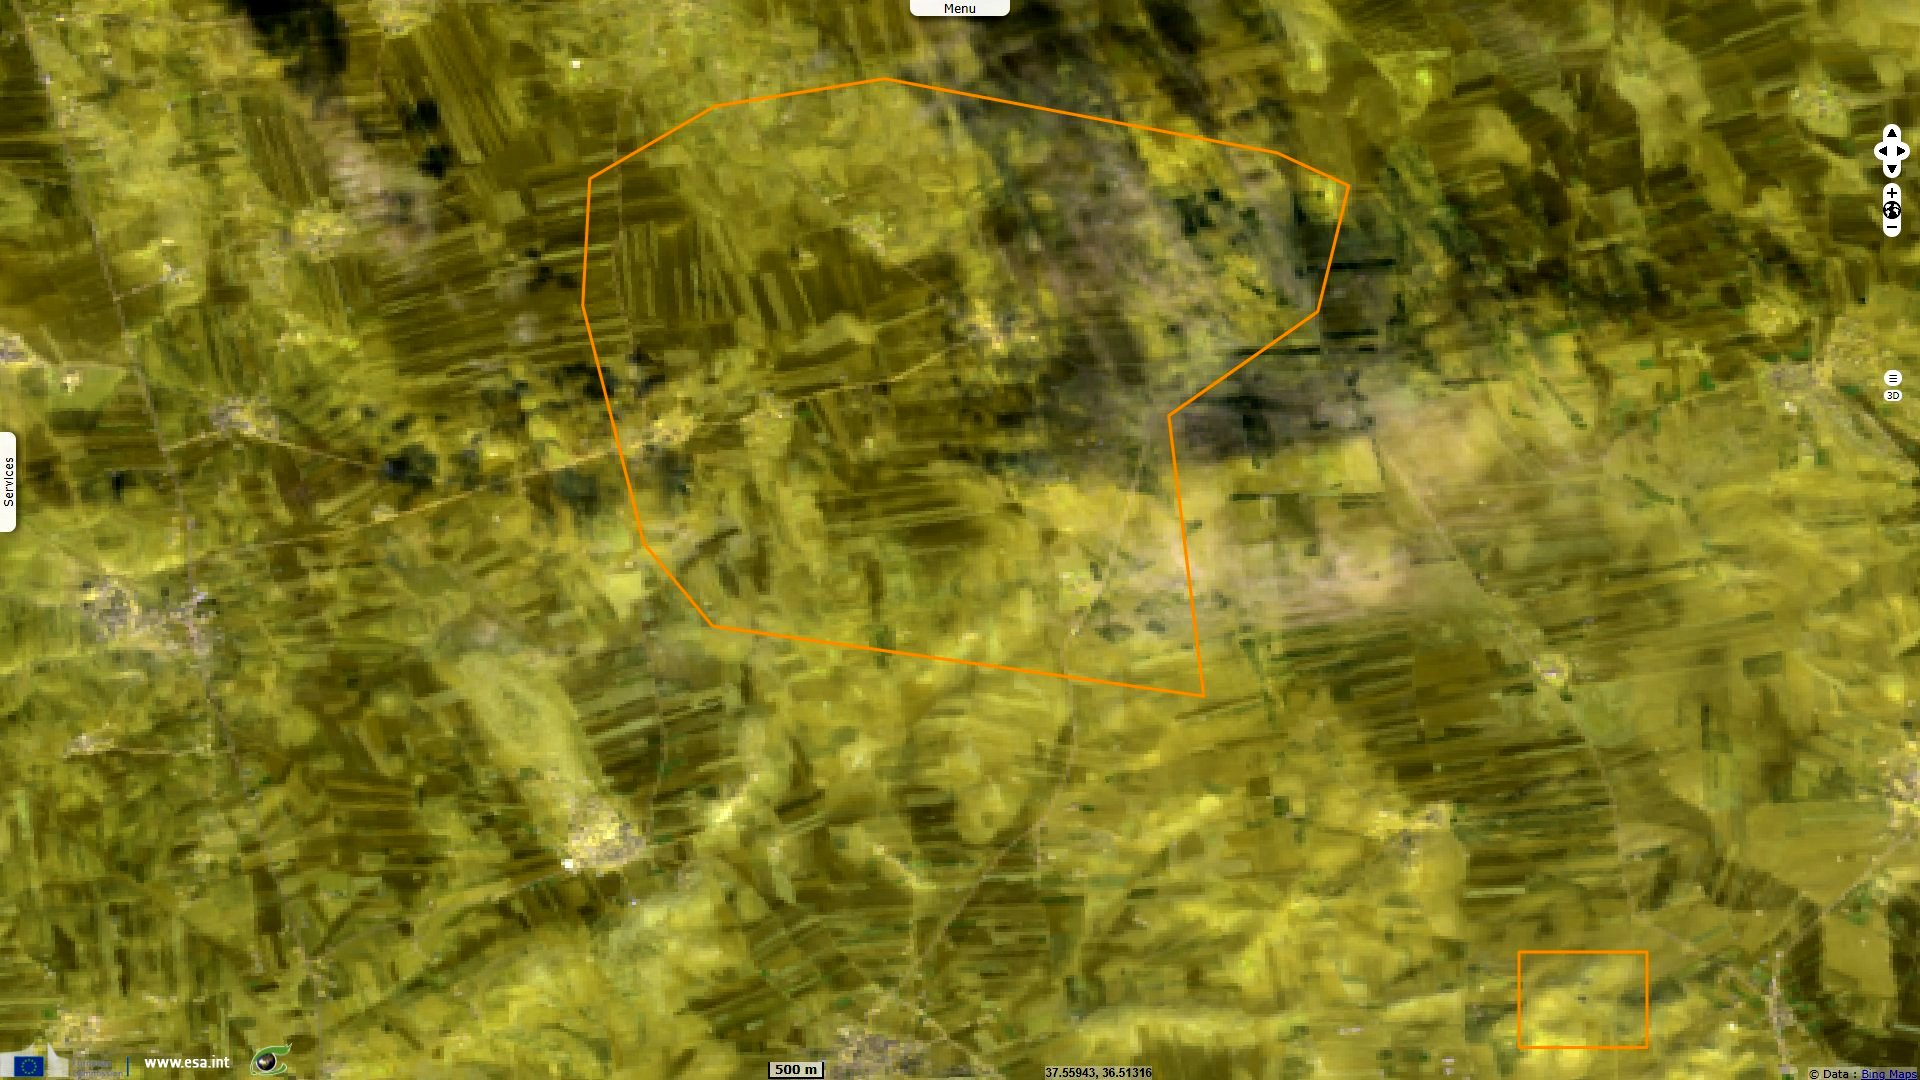
View of an area 50 km north-east of Aleppo in 2013, before the appearance of illegal refineries.
The Business Online, a Tatarstan-based Russian newspaper, reports economic and environmental consequences of the production of oil by rebel groups: "The price of oil in Deir ez-Zur is very low - up to $5 per barrel. Locals resell it to neighboring provinces for $14 a barrel. Syria is suffering huge financial losses due to the loss of control over the oil industry. This is not only about direct budget losses, but also about the fact that oil, which previously came from Syrian sources, has to be bought on the external market - from Iran and Venezuela, and then sold on the domestic market.
Primitive oil refineries produce extremely low-quality fuel. This means double pollution of the environment - during production and during use. The oilfield areas are constantly covered with clouds of thick black smoke. Not only the atmosphere is polluted, but also water sources."
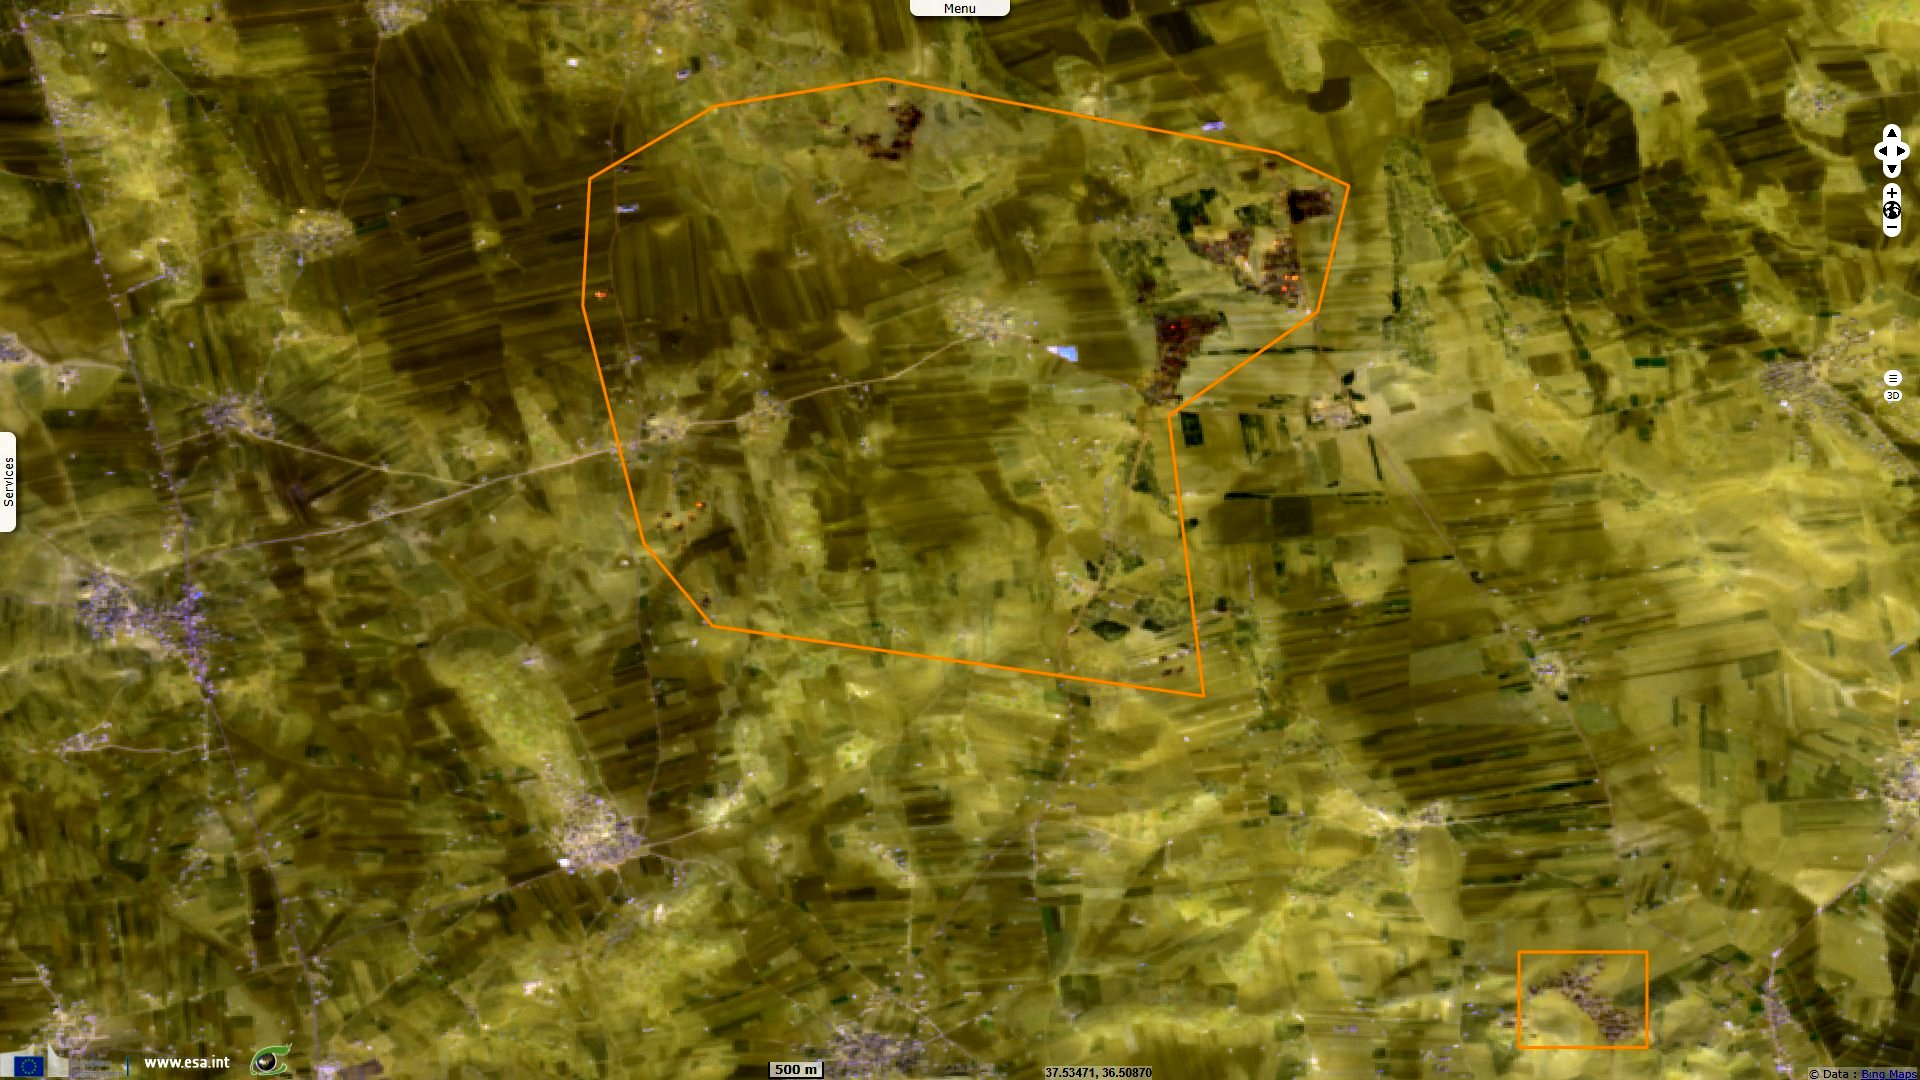
Samira Mobaied concludes: "Illegal refineries have also been observed in north-western Syria, an area that has been under the control of armed groups and militias. There are no drilling facilities in the area; crude oil is supplied from north-eastern Syria via a smuggling network. Refined products are one of the main sources of funding for armed groups. The illegal refineries in the north-west are located in the middle of agricultural areas and appear to be better structured than those we observed in the desert regions."
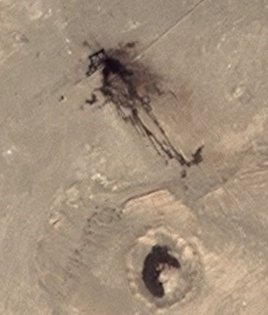
This image was acquired in 2017 after the appearance of illegal refineries. These are detectable as they were in Figures 3 and 4 for several reasons:
- "The distillation vessels are heated to about 400 degrees Celsius. The corresponding hot spots appear on the Sentinel-2 images with brightly coloured pixels when using the mid-infrared channels 1.6 µm and 2.2 µm,
- The dark smoke emitted is visible in these Sentinel-2 images as dark, elongated clouds,"
- Some burnt areas are often found near these dots.
The views expressed herein can in no way be taken to reflect the official opinion of the European Space Agency or the European Union.
Contains modified Copernicus Sentinel data 2026, processed by VisioTerra.
Contains modified Copernicus Sentinel data 2026, processed by VisioTerra.
| More on European Commission space: |  |
 |
 |
||||
| More on ESA: | |
|
|
S-1 website | S-2 website | S-3 website | |
| More on Copernicus program: | |
|
|
Scihub portal | Cophub portal | Inthub portal | Colhub portal |
| More on VisioTerra: | |
|
|
Sentinel Vision Portal | Envisat+ERS portal | Swarm+GOCE portal | CryoSat portal |