Sanchi oil spill seen by Sentinel-1 / 2 / 3
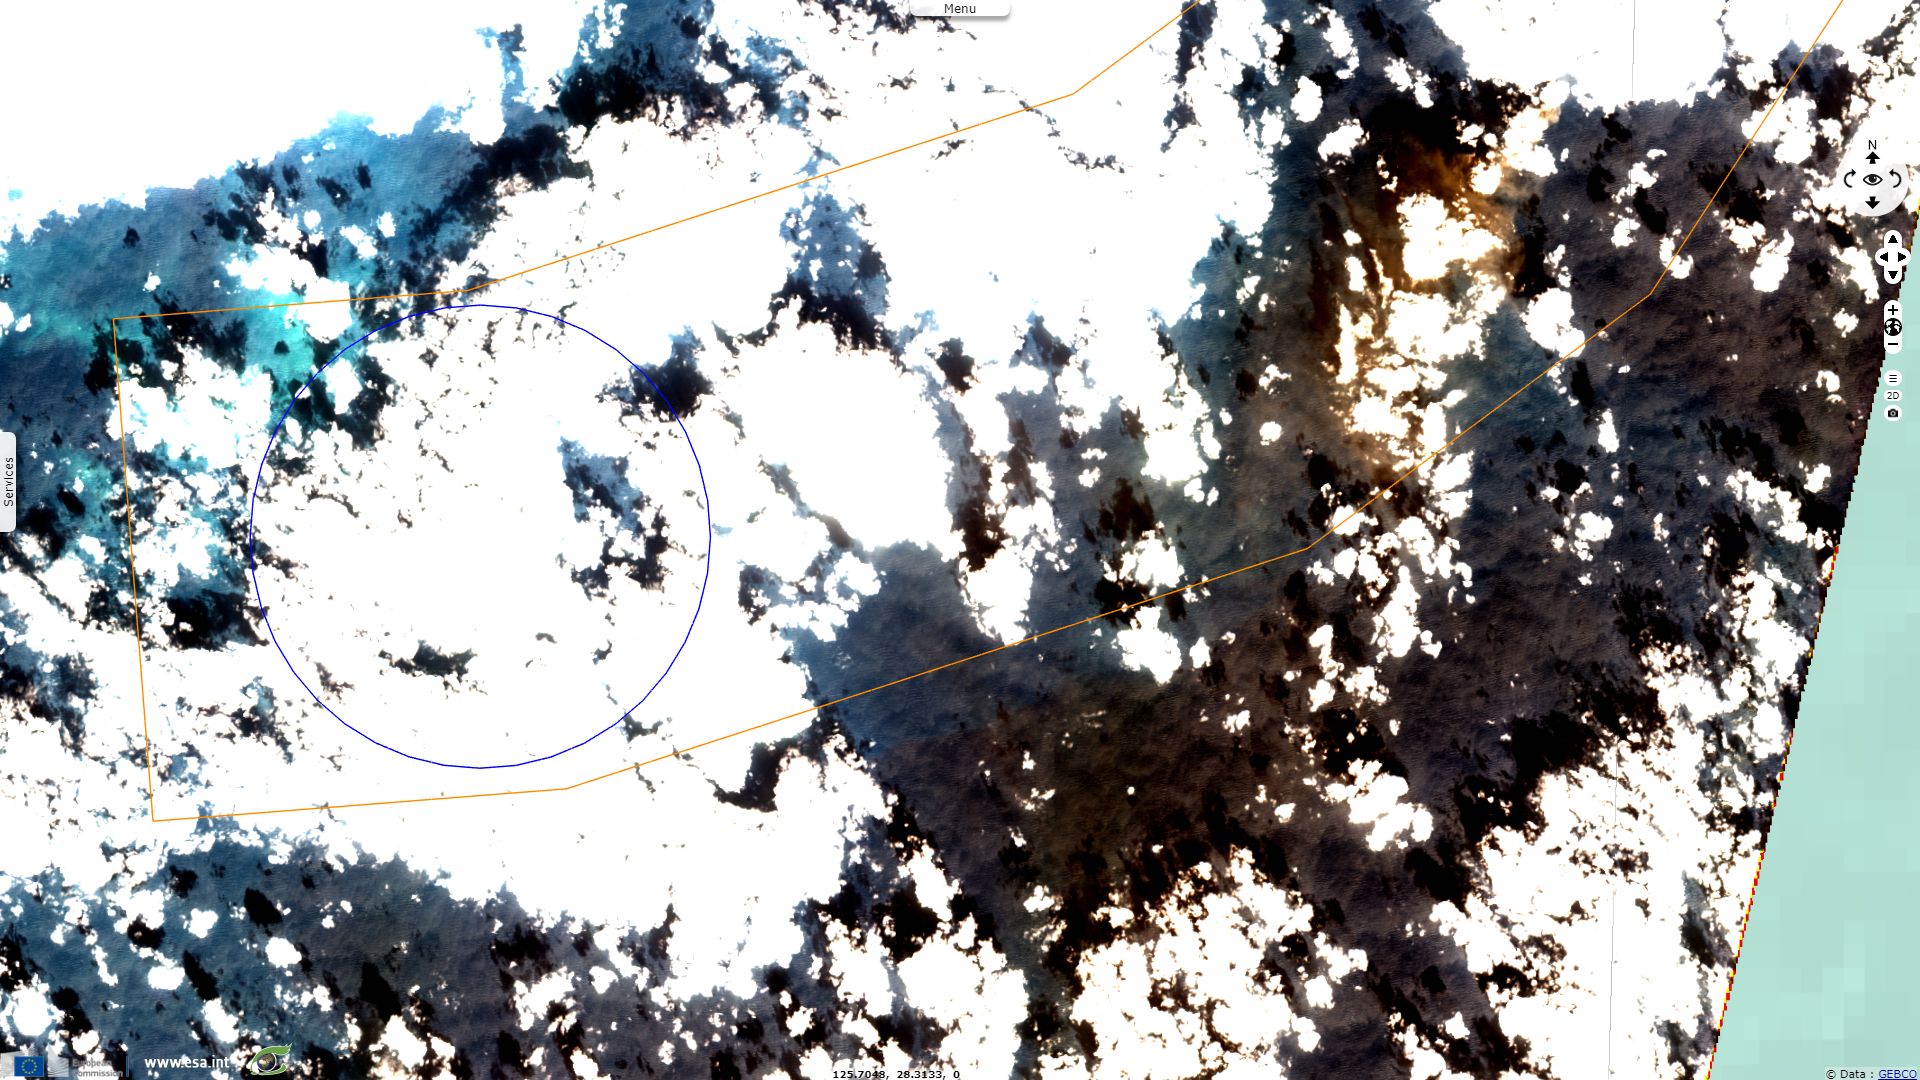
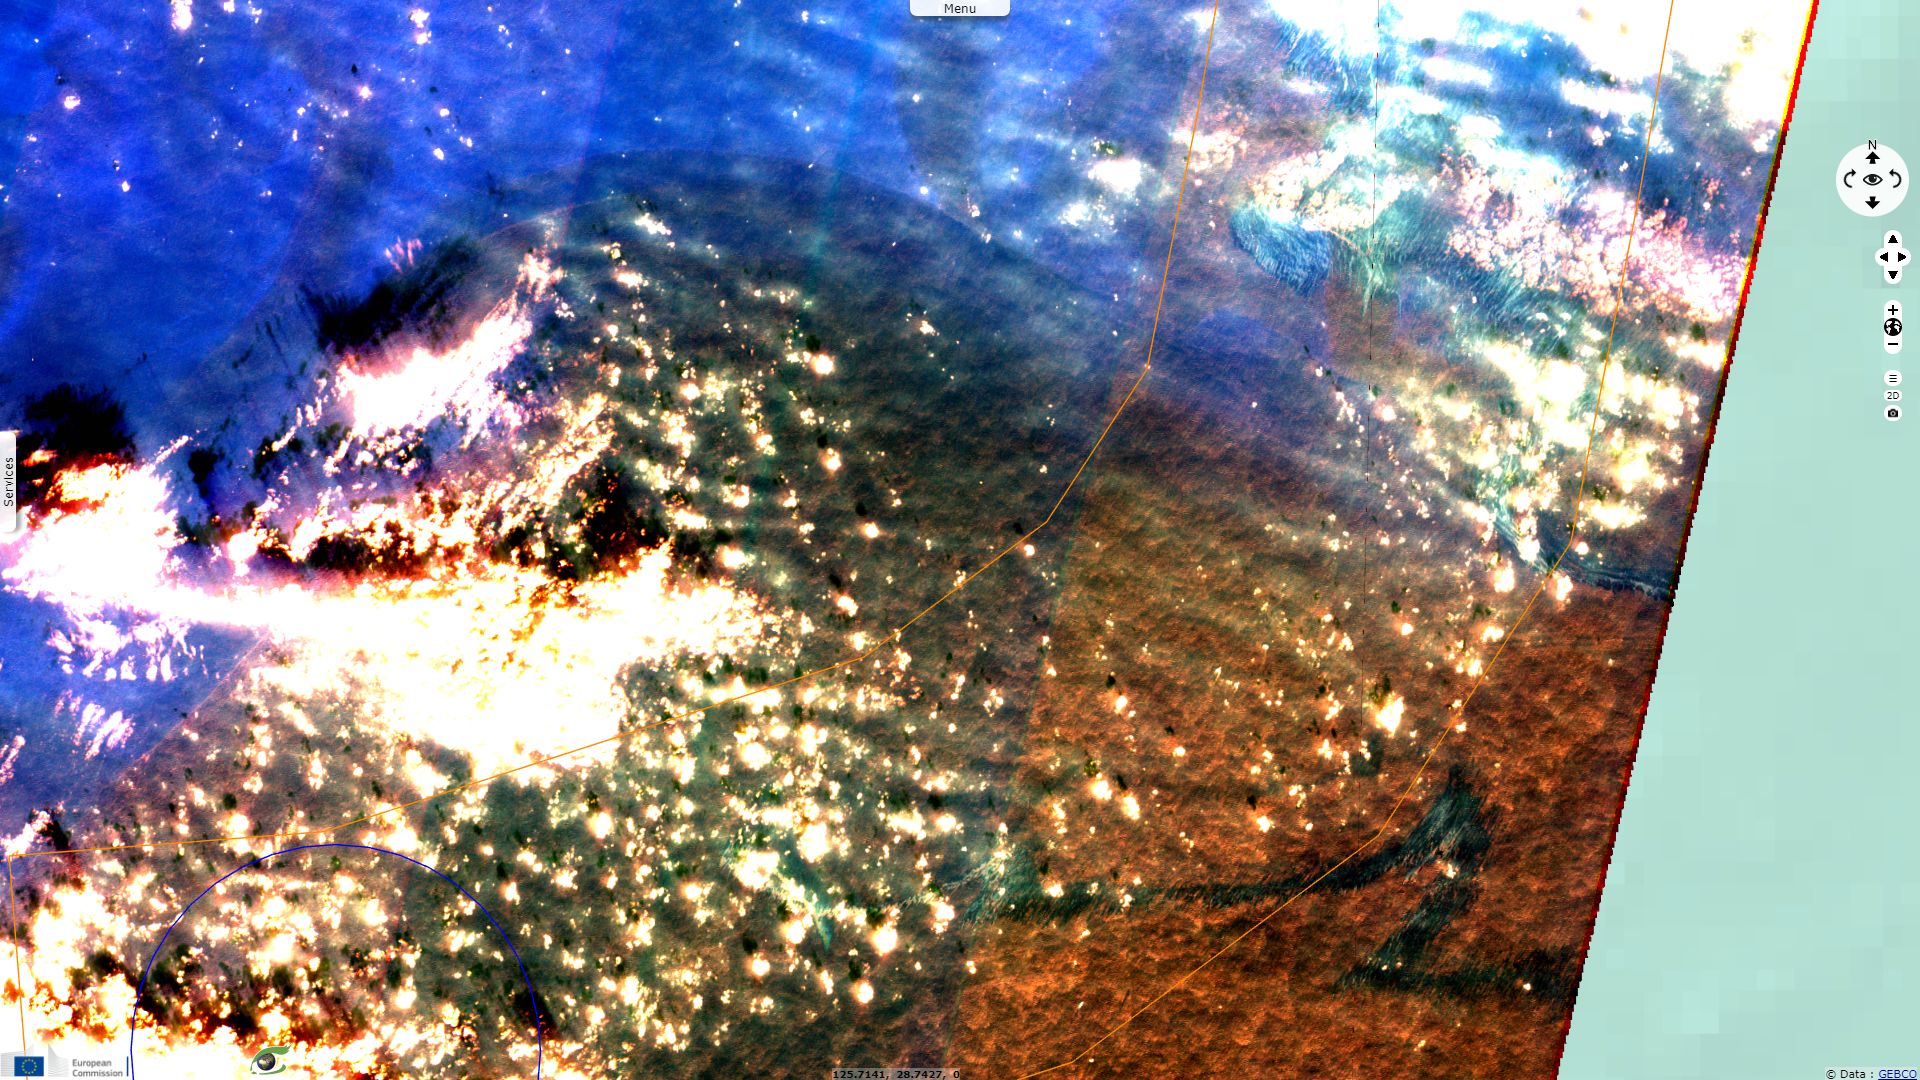
Sentinel-2 MSI acquired on 13 January 2018 at 02:20:39 UTC
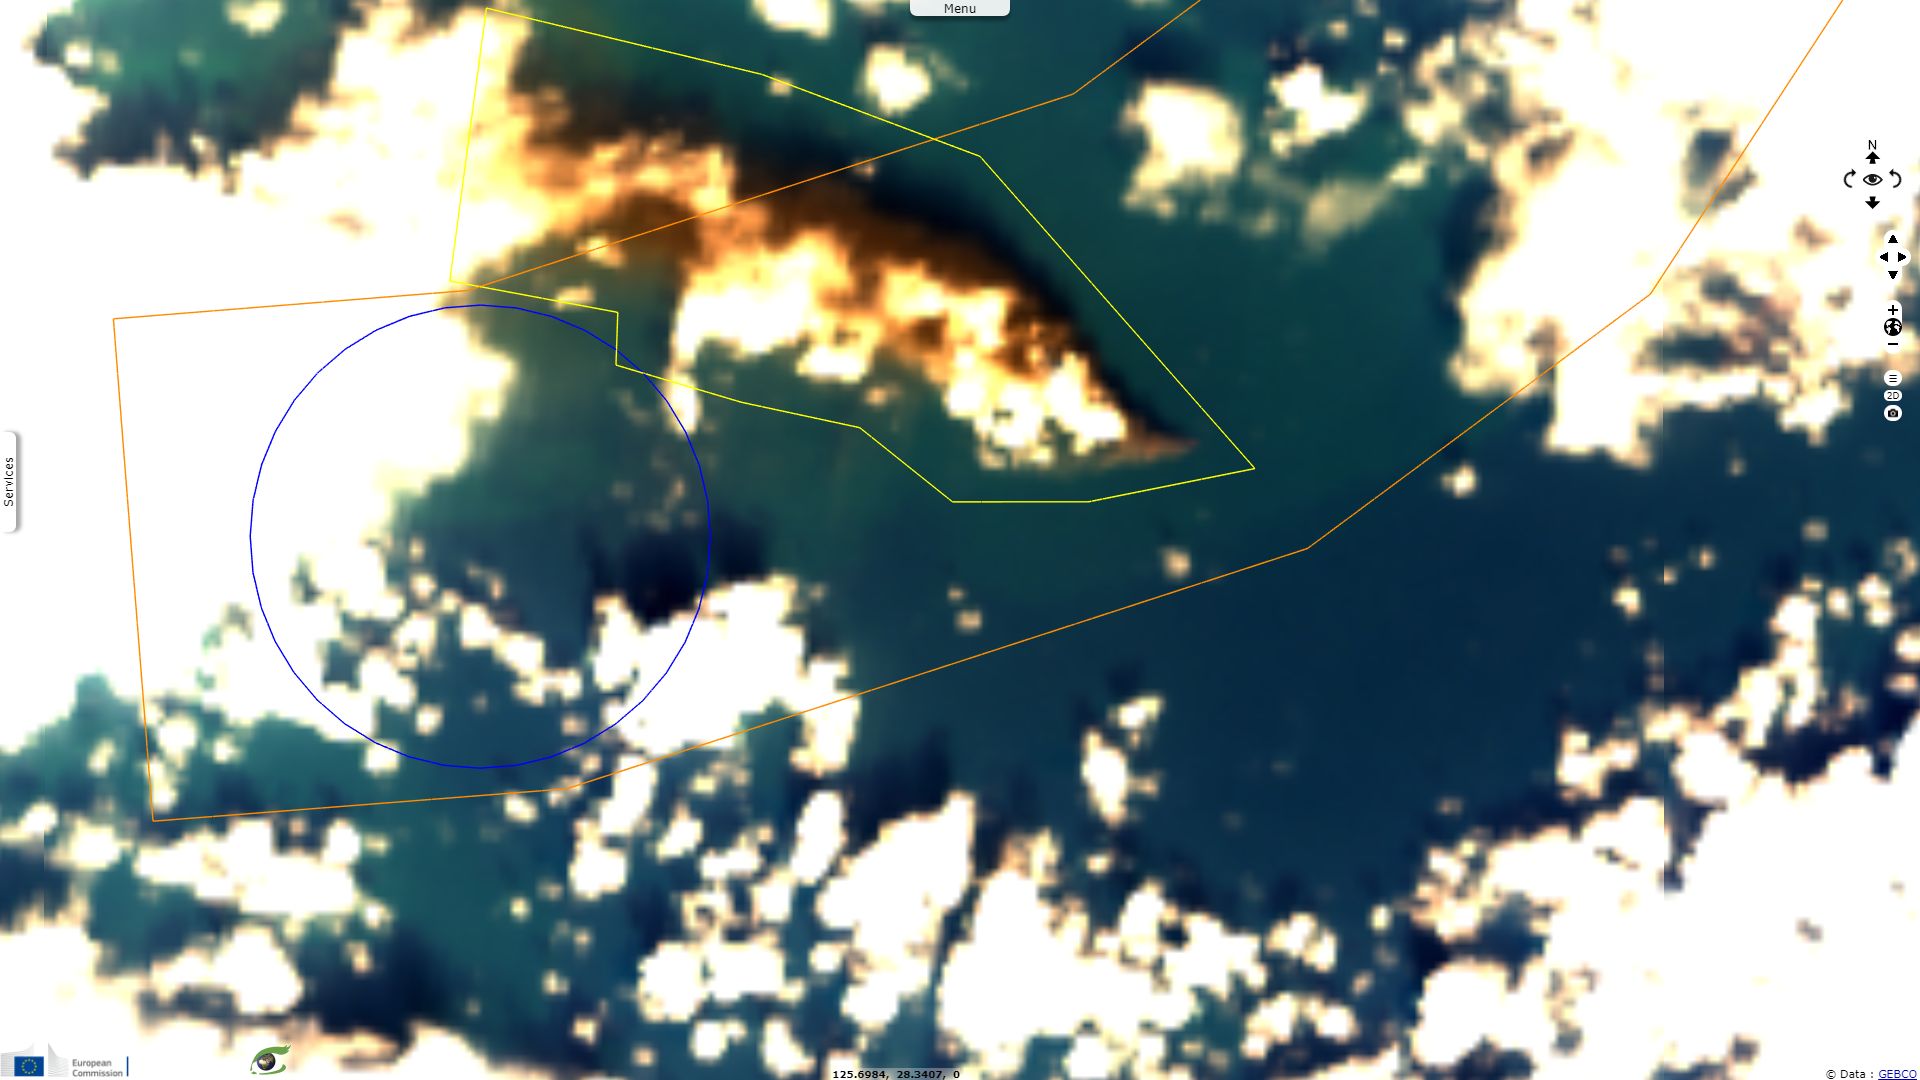
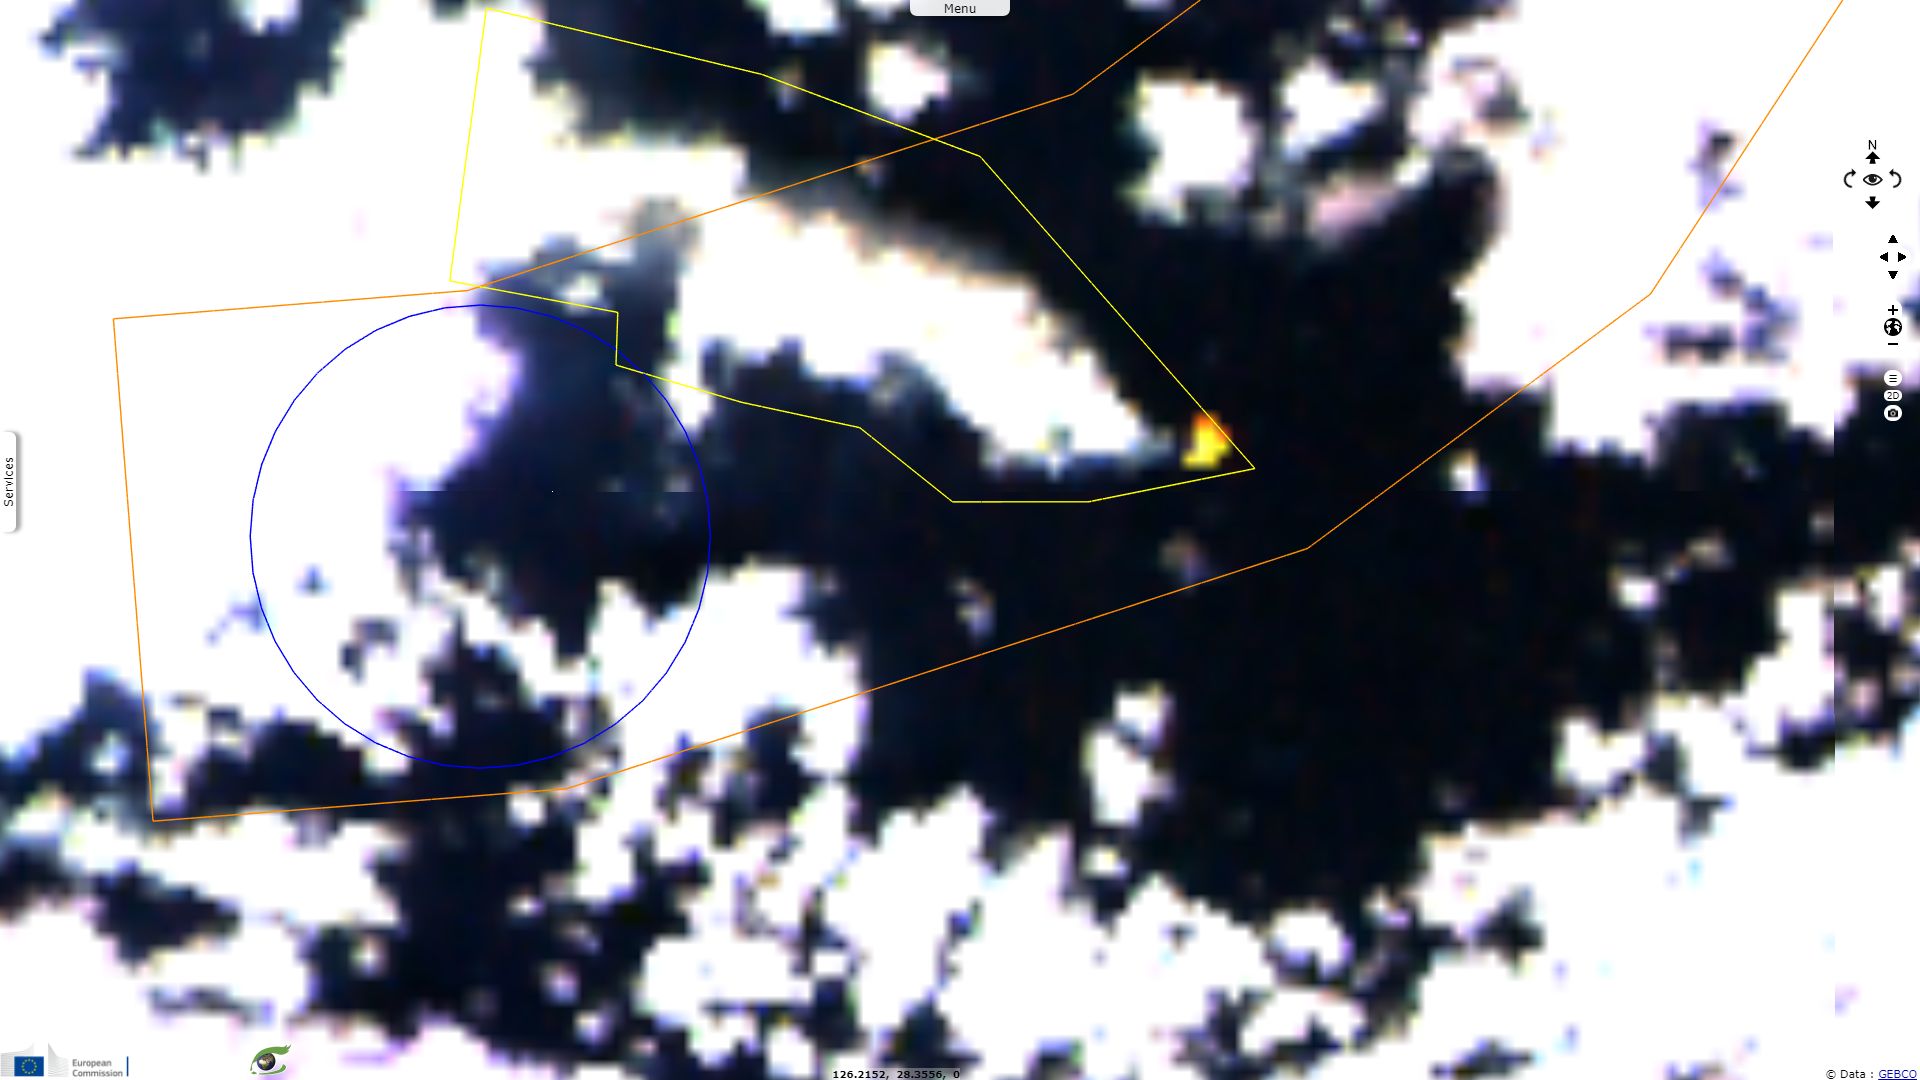
Sentinel-3 OLCI FR & SLSTR RBT acquired on 14 January 2018 at 01:38:58 UTC
Sentinel-2 MSI acquired on 18 January 2018 at 02:20:21 UTC
Sentinel-2 MSI acquired on 20 January 2018 at 02:10:09 UTC
Sentinel-1 CSAR IW acquired on 20 January 2018 at 09:28:53 & 21:33:37 UTC
Sentinel-3 OLCI FR & SLSTR RBT acquired on 14 January 2018 at 01:38:58 UTC
Sentinel-2 MSI acquired on 18 January 2018 at 02:20:21 UTC
Sentinel-2 MSI acquired on 20 January 2018 at 02:10:09 UTC
Sentinel-1 CSAR IW acquired on 20 January 2018 at 09:28:53 & 21:33:37 UTC
Keyword(s): ocean monitoring, coastal, environment, disaster, pollution, oil spill, Iran, China, Japan, Korea
According to Reuters: "The worst tanker oil spill in decades is unfolding 260km (160 miles) off Shanghai after an Iranian oil tanker carrying [136,000] tonnes of toxic oil collided with a freighter and exploded, killing all 32 crew onboard."
On 6th January, the 274 meters long Sanchi oil tanker collided with the smaller Hong Kong-flagged bulker CF Crystal. The BBC relates that "After the collision the Sanchi drifted at about 2.2km/h (1.4mph), south-eastwards towards the Japanese island of Amami Oshima". Reuters continues: "The ship burned, spewing its cargo, for more than a week before sinking in the waters between China, Japan and South Korea." It now lies 115 metres below sea level.
On 16.01.2018, World Maritime News collected the comments of China’s Oceanic Administration which informed: "There is an 18.5 km long, 1.85-7.4 km wide condensate leak zone around the area"".
World Maritime News relayed information : "Shanghai Maritime Search and Rescue Center officials informed that the flames reached 800 to 1,000 meters high at the time, while oil spills from the ship continued burning in the area where the ship went down.".
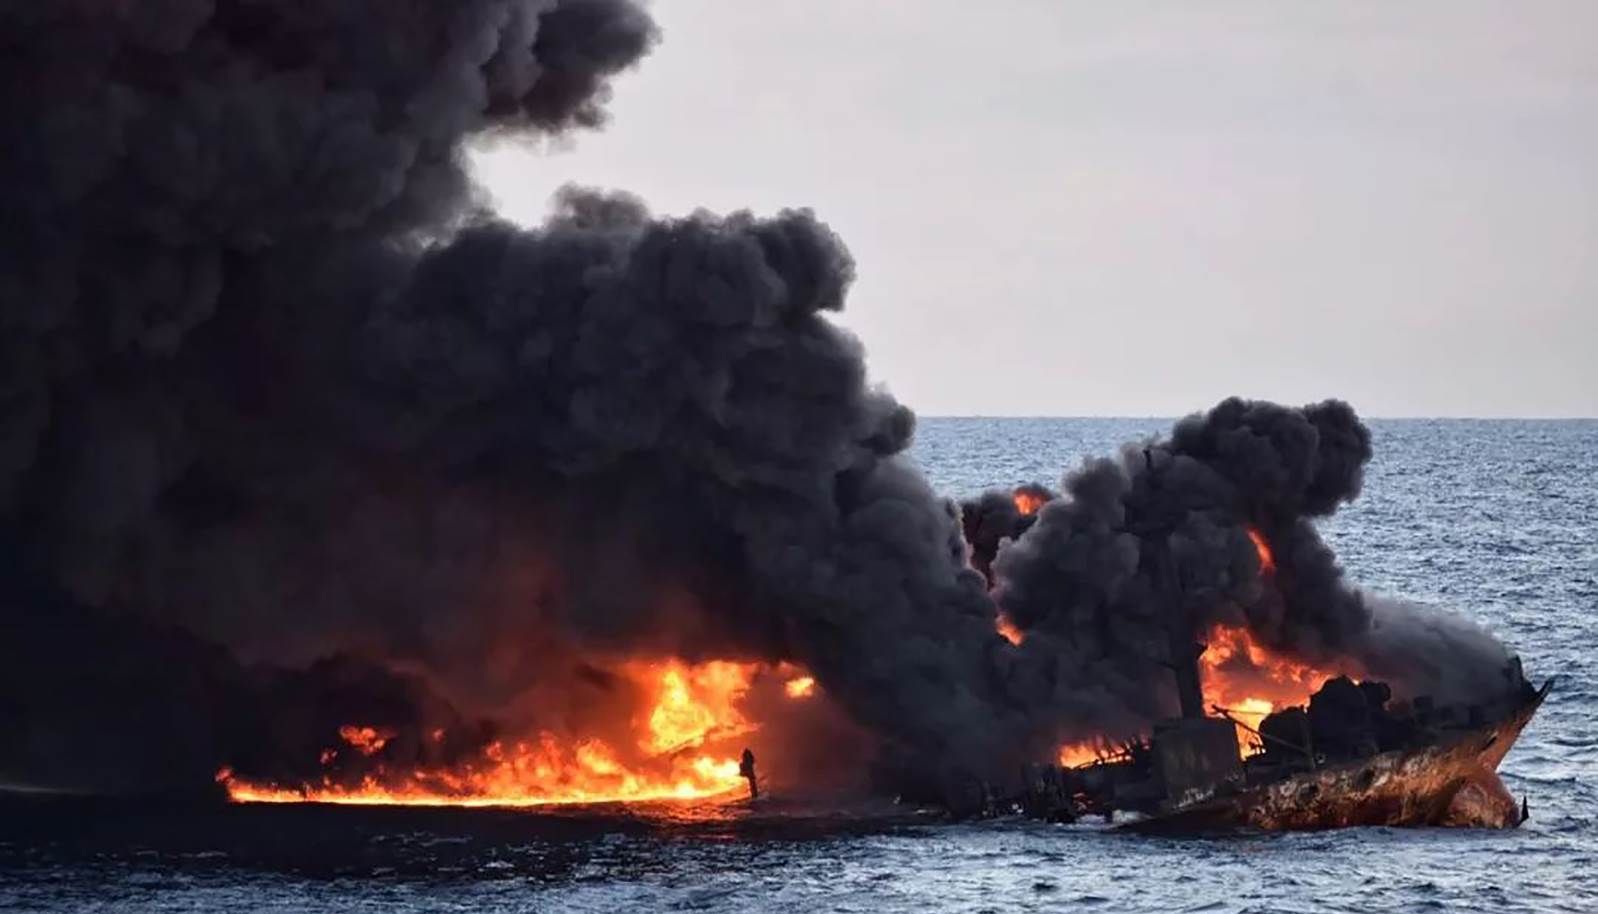
Image of the burning Sanchi as it was sinking to the sea on 14 January 2018 - source
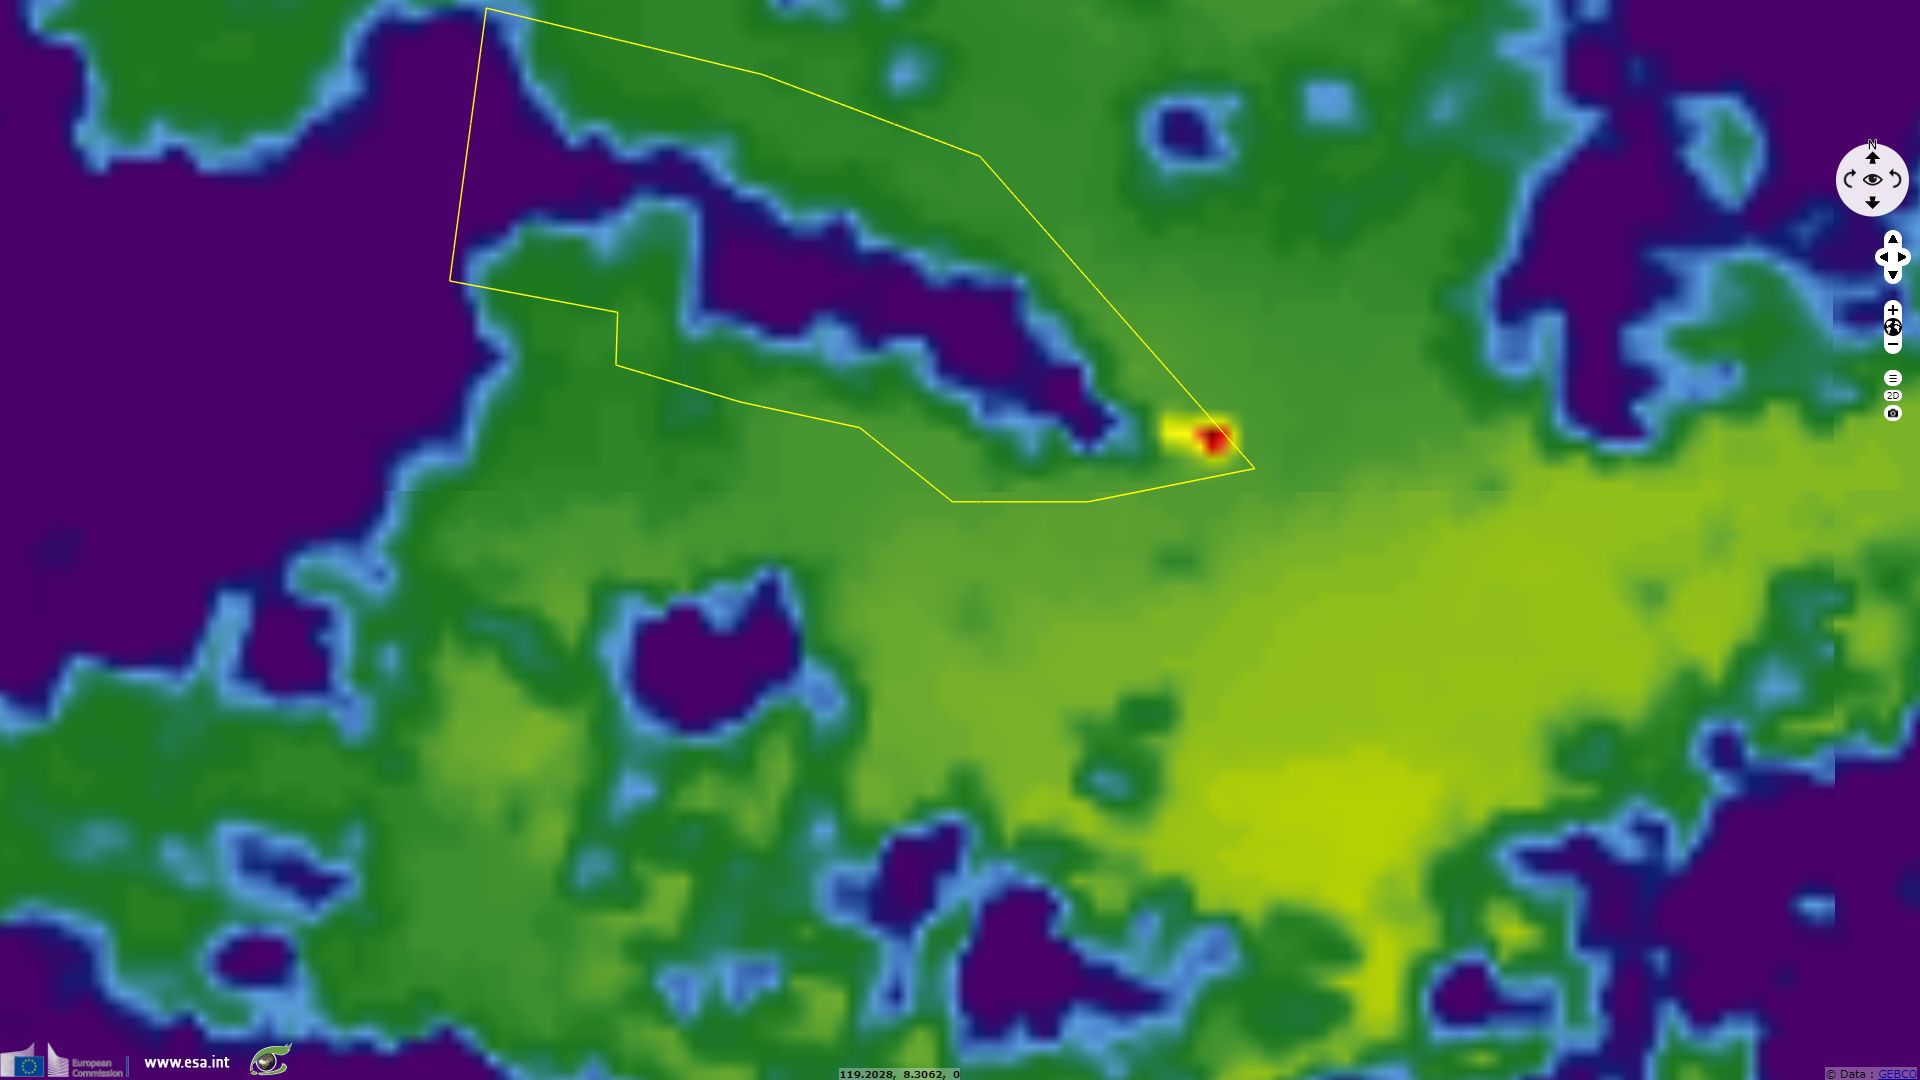
On the sea warm waters (light green), the fire can be identified as the hottest element (red). The hot smoke (yellow) drifts west until it is hidden by a cold opaque cloud above (purple).
Reuters details: "The Panama-registered Sanchi was carrying the equivalent of nearly 1 million barrels of ultra-light crude, plus its own fuel, to South Korea. According to the International Tanker Owners Pollution Federation, the collision led to the worst tanker spill in 35 years. Authorities have had trouble pinning down how big the spill is, as it changes by the day amid strong ocean currents. But concerns are growing about the potential impact to key fishing grounds and sensitive marine ecosystems off Japan and South Korea, which lie in the projected path of the oil, according to Britain's National Oceanography Centre.".
In its article published a week before the vessel sank, the BBC reported: "Condensate is certainly toxic. It is much lighter in colour and odour than heavy crudes, potentially making it a lot harder to detect and contain.
Simon Boxall, of the National Oceanography Centre at the University of Southampton, told the BBC there was another difference: 'It's not like crude, which does break down under natural microbial action; this stuff actually kills the microbes that break the oil down.' It cannot be picked off the surface like heavy crude. Dr Boxall said the best hope was to put out the fire and stop the ship from sinking. 'If she sinks with a lot of cargo intact, then you have a time bomb on the sea bed which will slowly release the condensate.' He added: 'There could be a long-term exclusion of fishing for many hundreds of kilometres in this area.'".
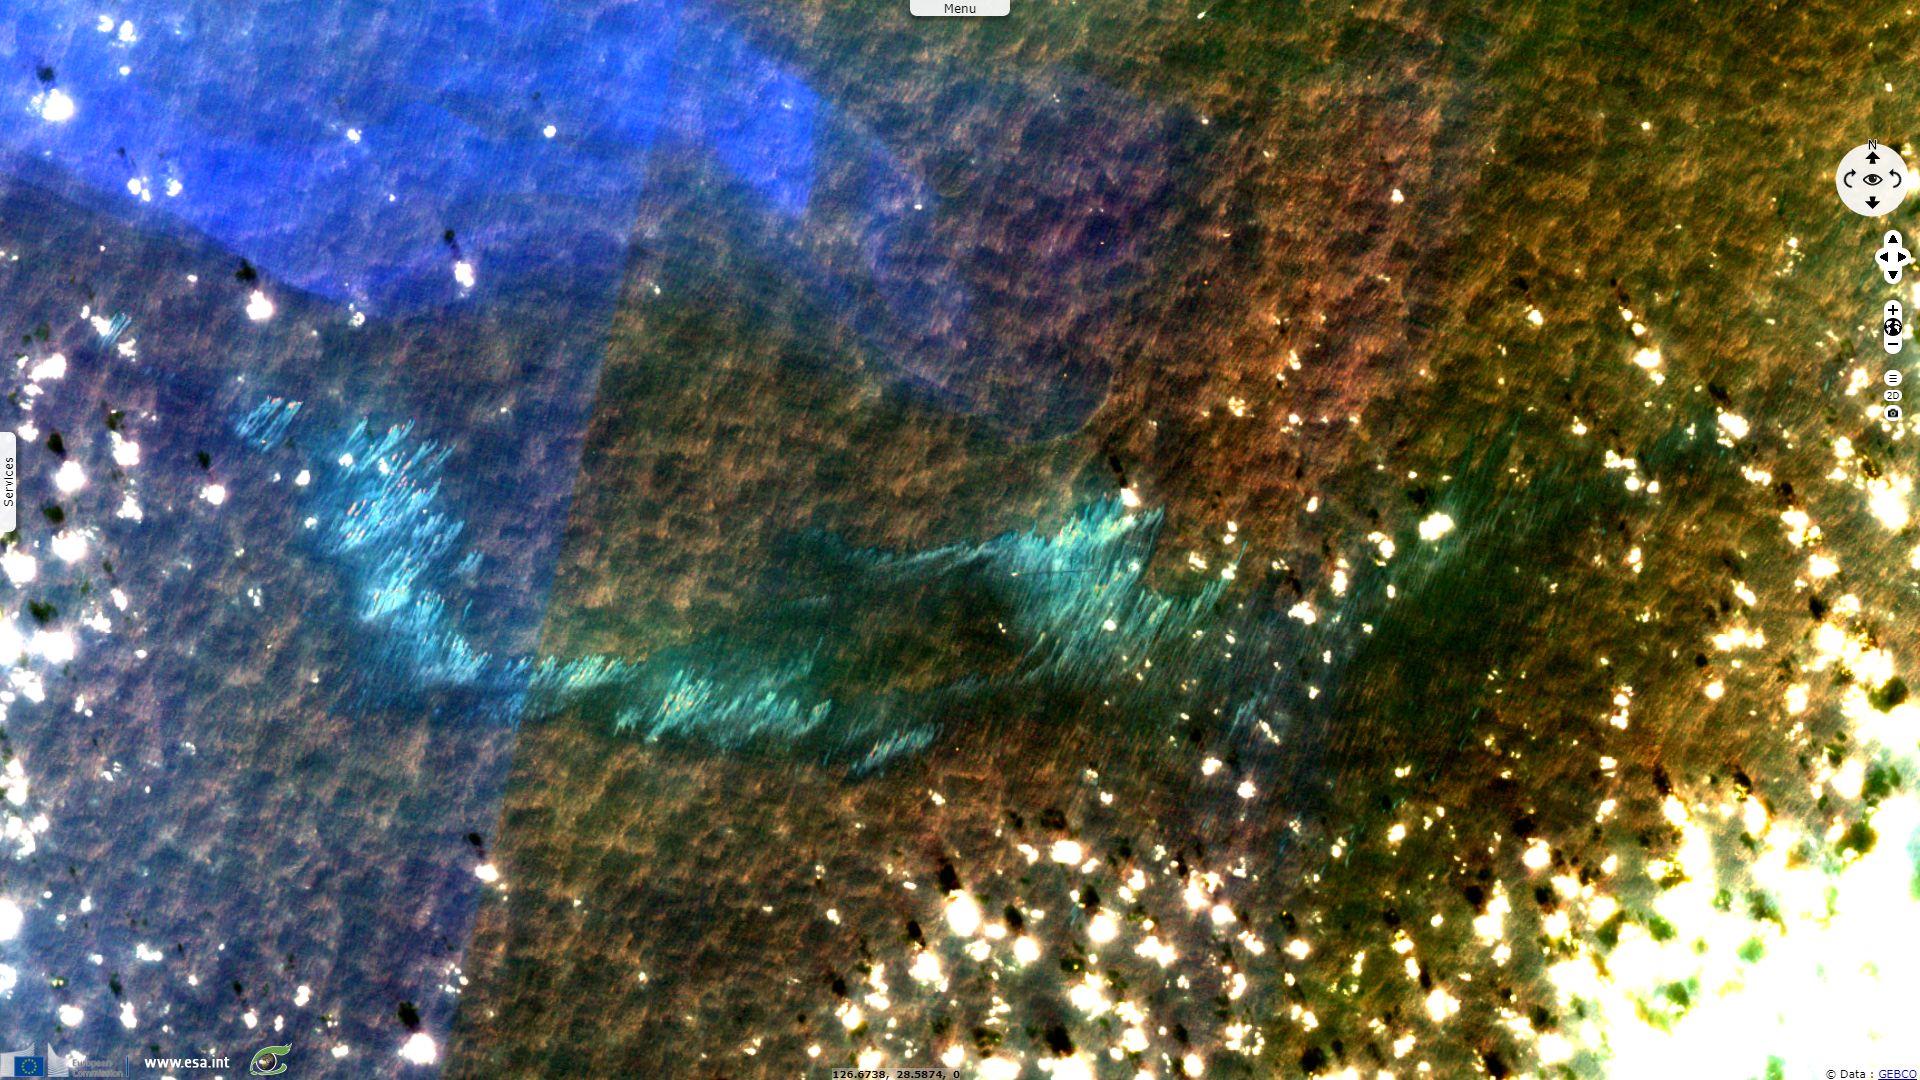
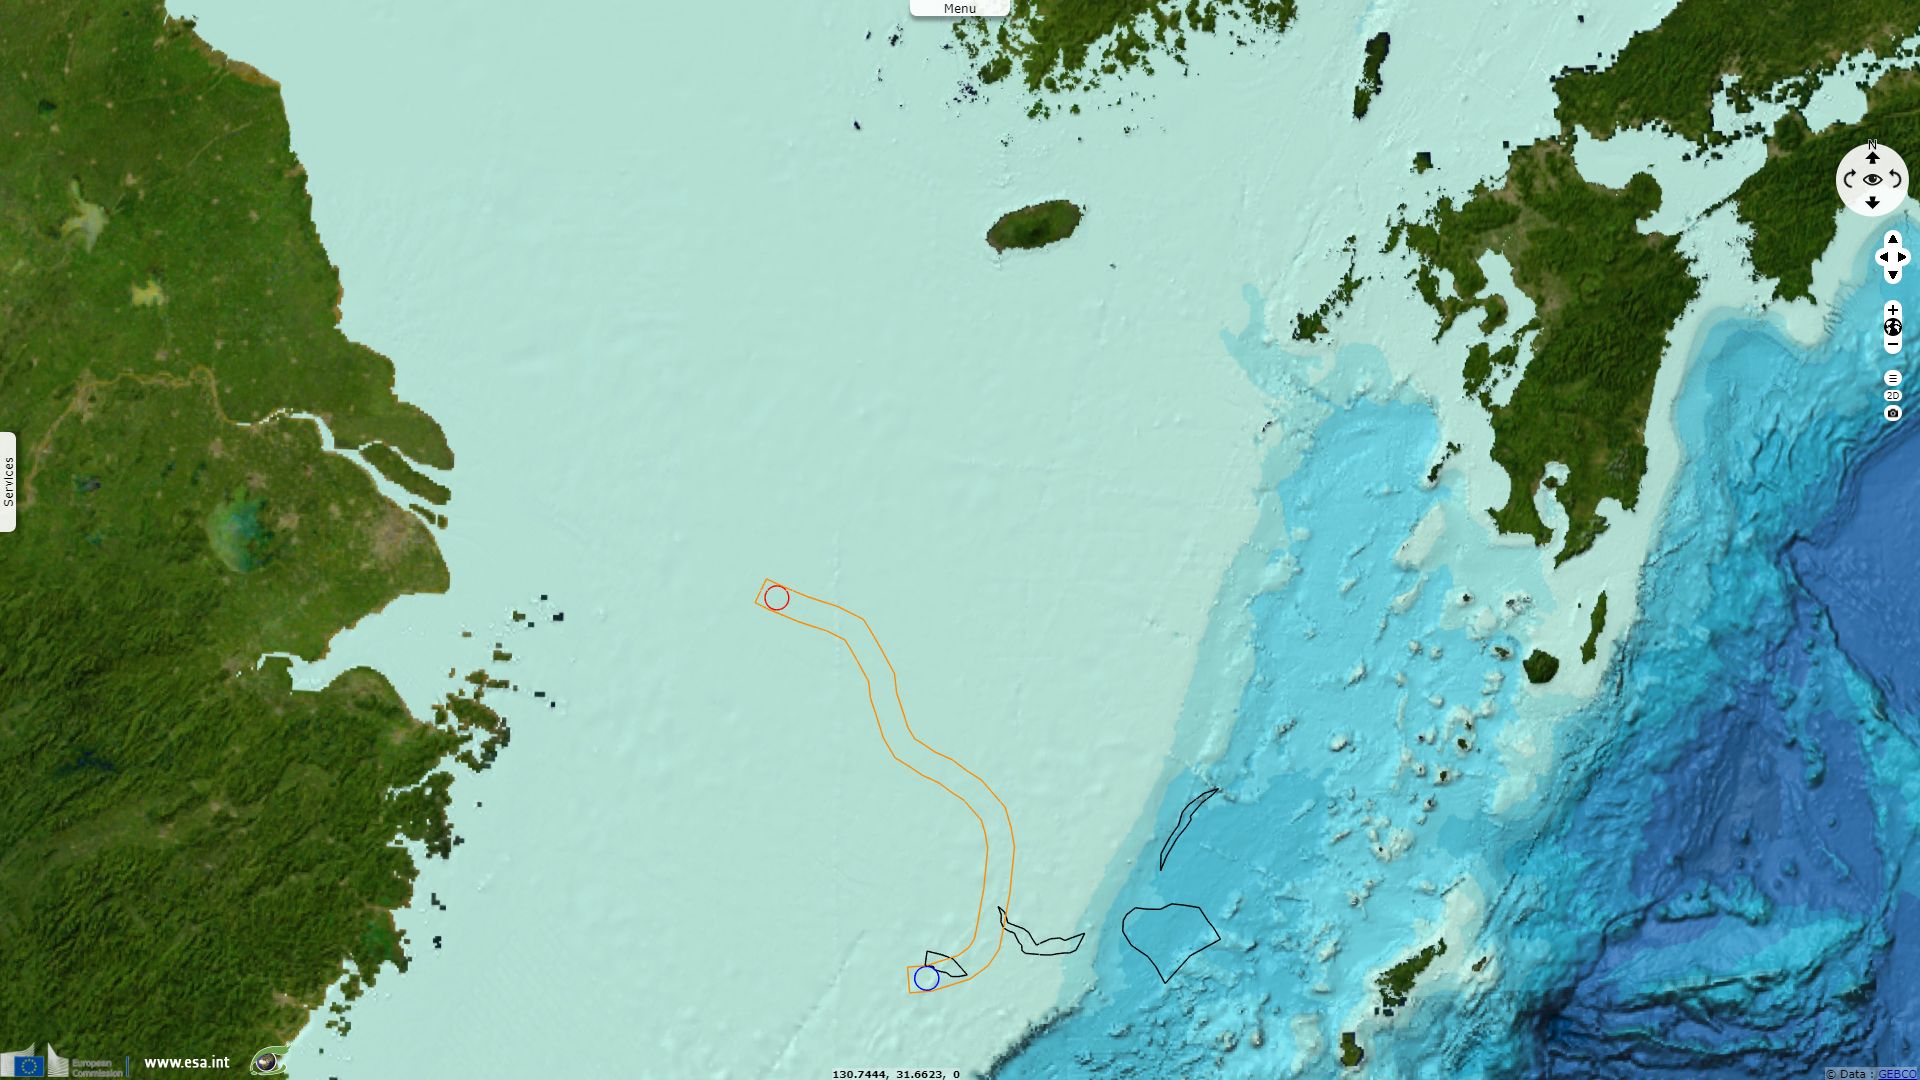
As evidenced by Najoui & al., oil drifts first from its underwater source and then from its surface outbreaks under the influence of water currents.
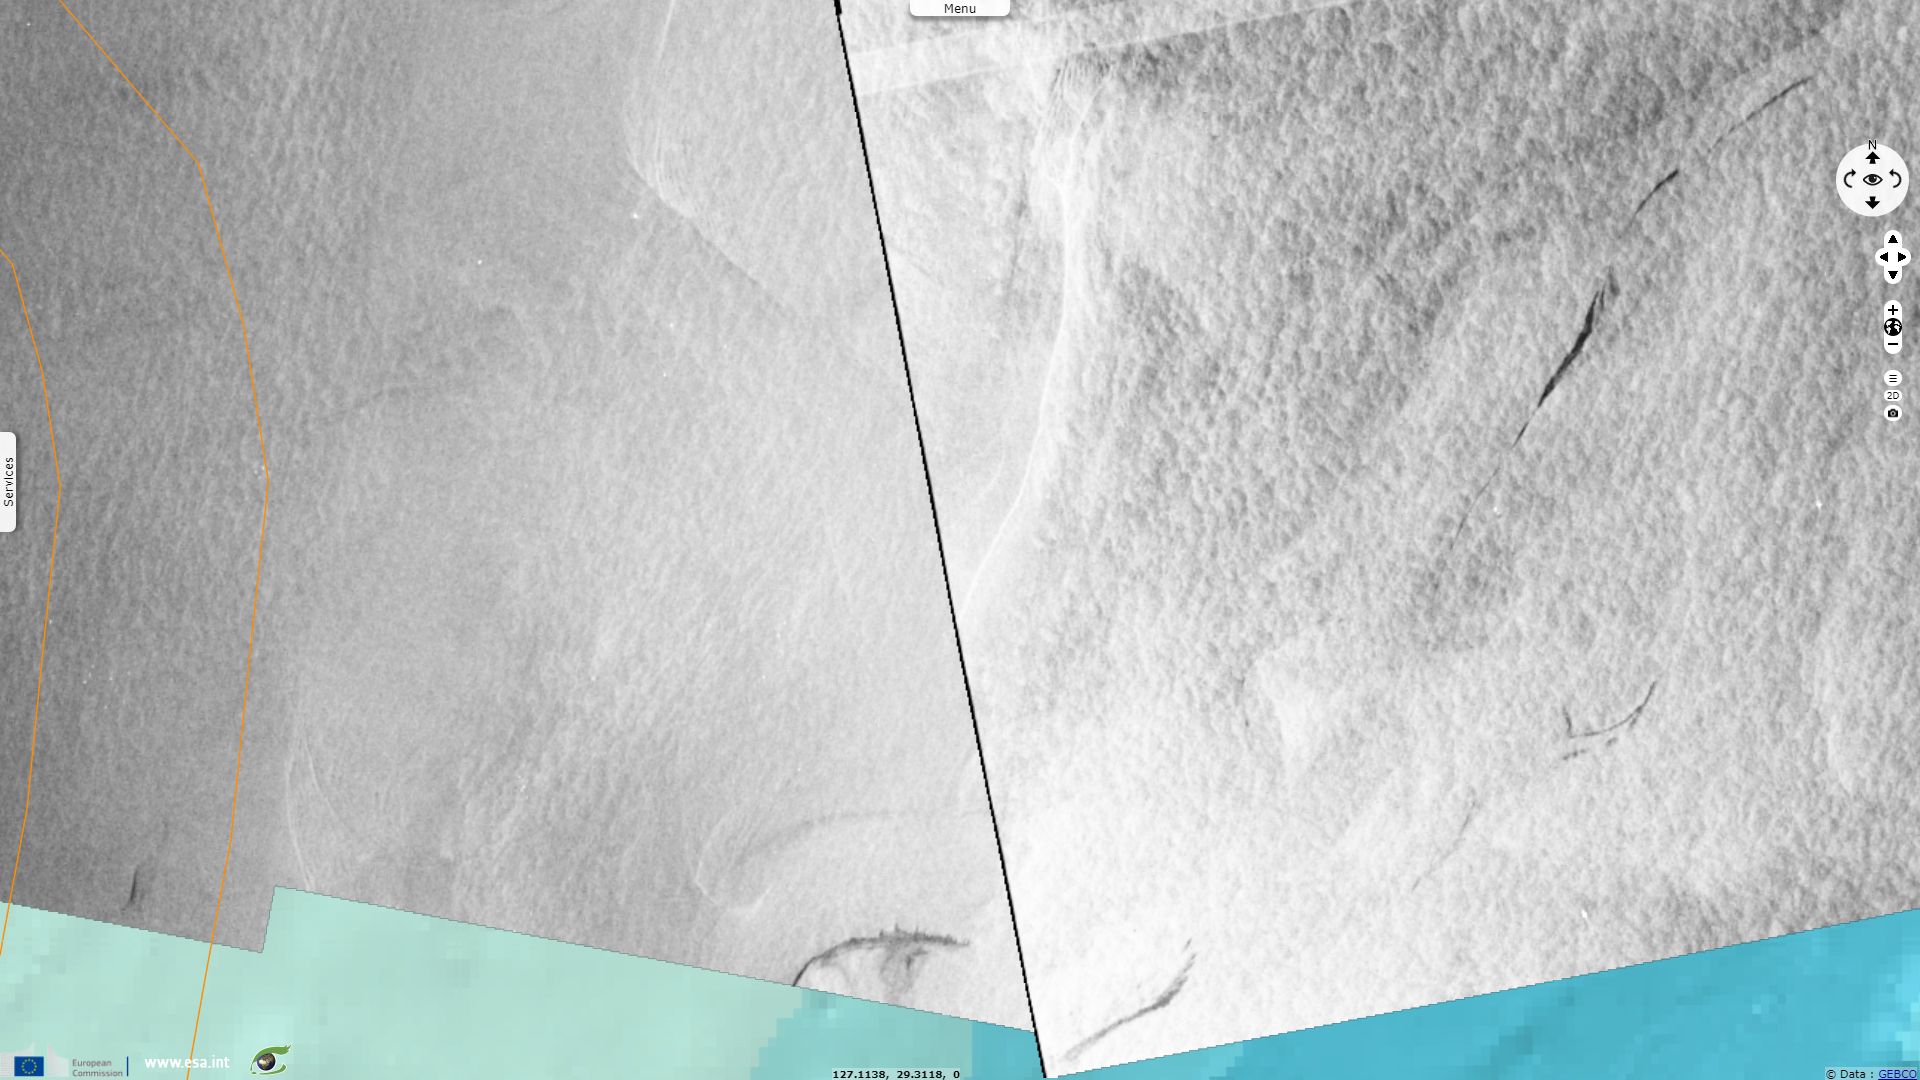
Radar are usually the most relevant remote sensing sensors to monitor oil spills. The surface tension induced by the oil film breaks the wavelets produced by the wind. The backscattered signal returns to the radar instrument with less intensity leading to significantly darker spots in the radar image. However, all black spots in the radar image do not indicate the presence of oil slicks.
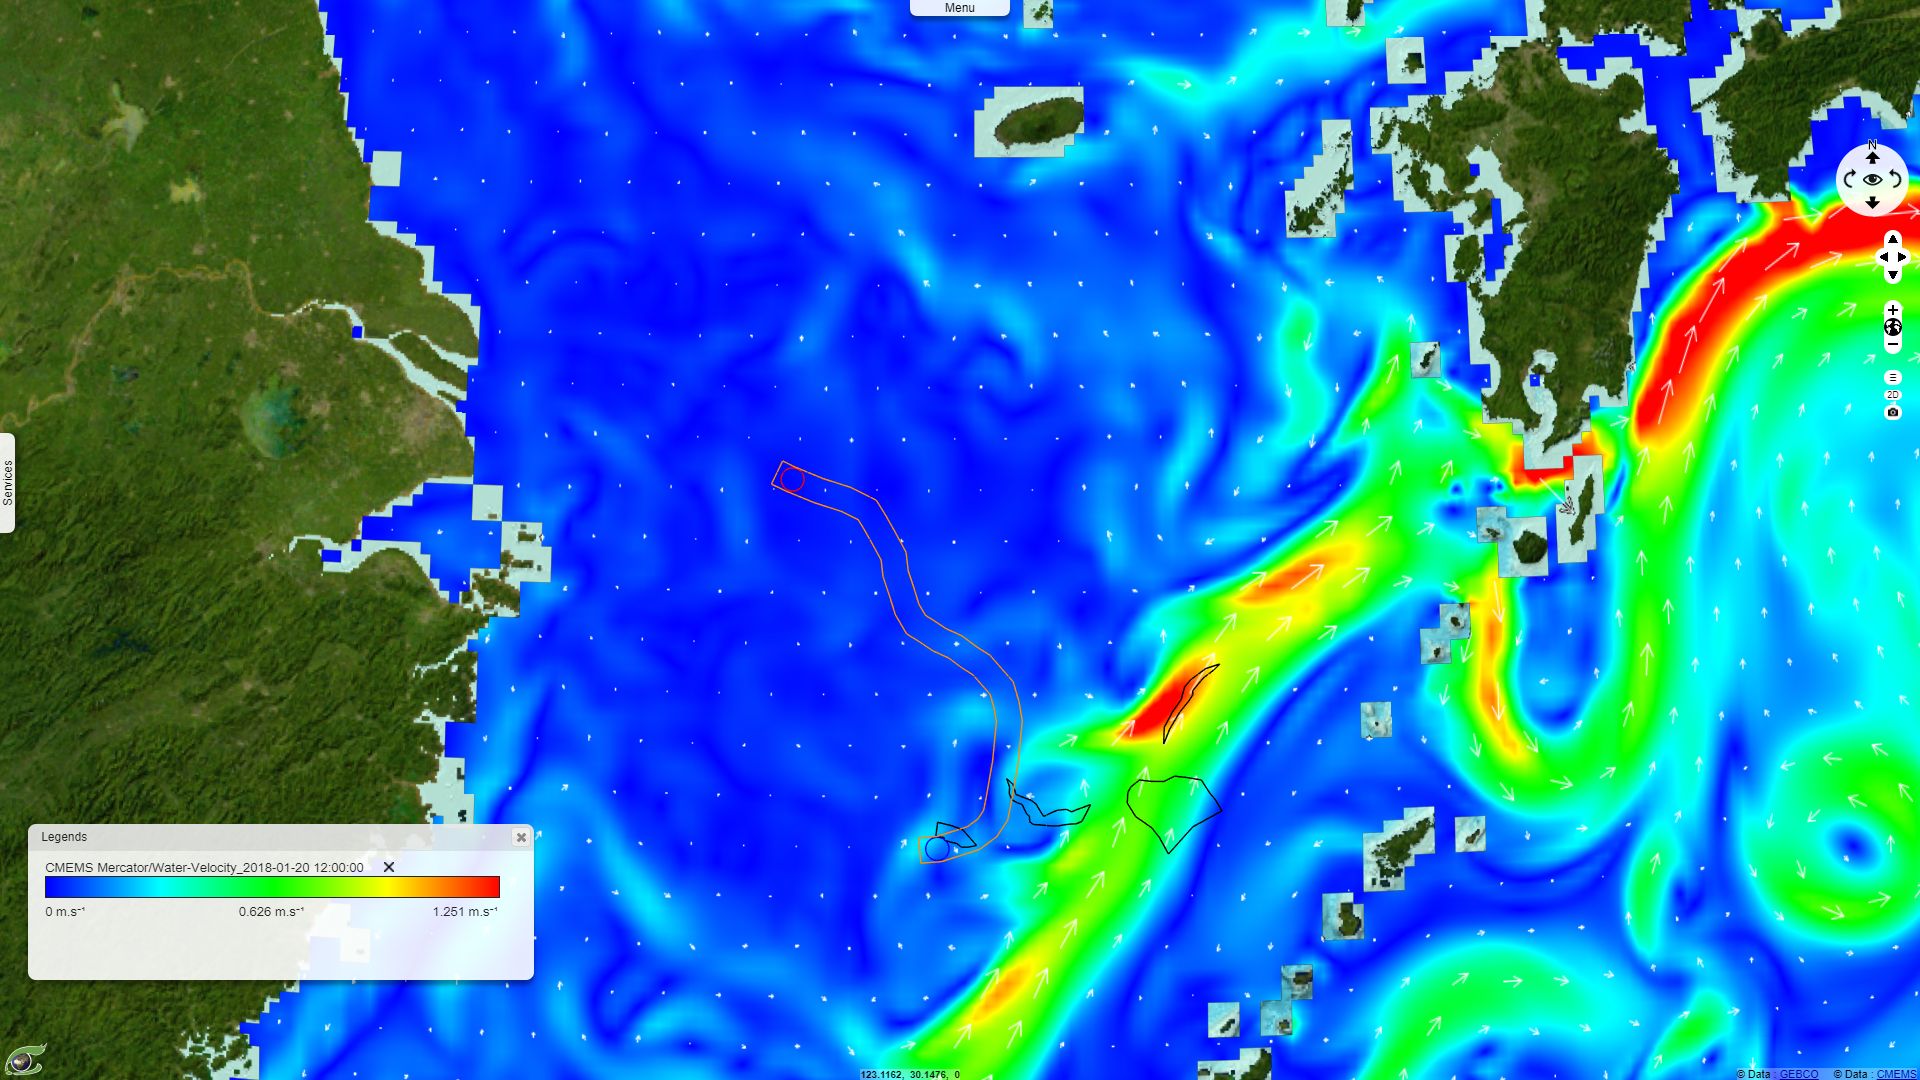
CMEMS Mercator water velocity layer with intensity highlighted by a look up table and direction shown with vectors - hyperlook
As highlighted by the sea currents shown above, this area is crossed by the powerful "Kuroshio Current" which produces a dominant north-eastward drift. Six days after the sinking, the Kuroshio Current continues to drag oil spills toward the Japanese islands.
The views expressed herein can in no way be taken to reflect the official opinion of the European Space Agency or the European Union.
Contains modified Copernicus Sentinel data 2026, processed by VisioTerra.
Contains modified Copernicus Sentinel data 2026, processed by VisioTerra.
| More on European Commission space: |  |
 |
 |
||||
| More on ESA: | |
|
|
S-1 website | S-2 website | S-3 website | |
| More on Copernicus program: | |
|
|
Scihub portal | Cophub portal | Inthub portal | Colhub portal |
| More on VisioTerra: | |
|
|
Sentinel Vision Portal | Envisat+ERS portal | Swarm+GOCE portal | CryoSat portal |