Environmental & political impact of Bougainville mine
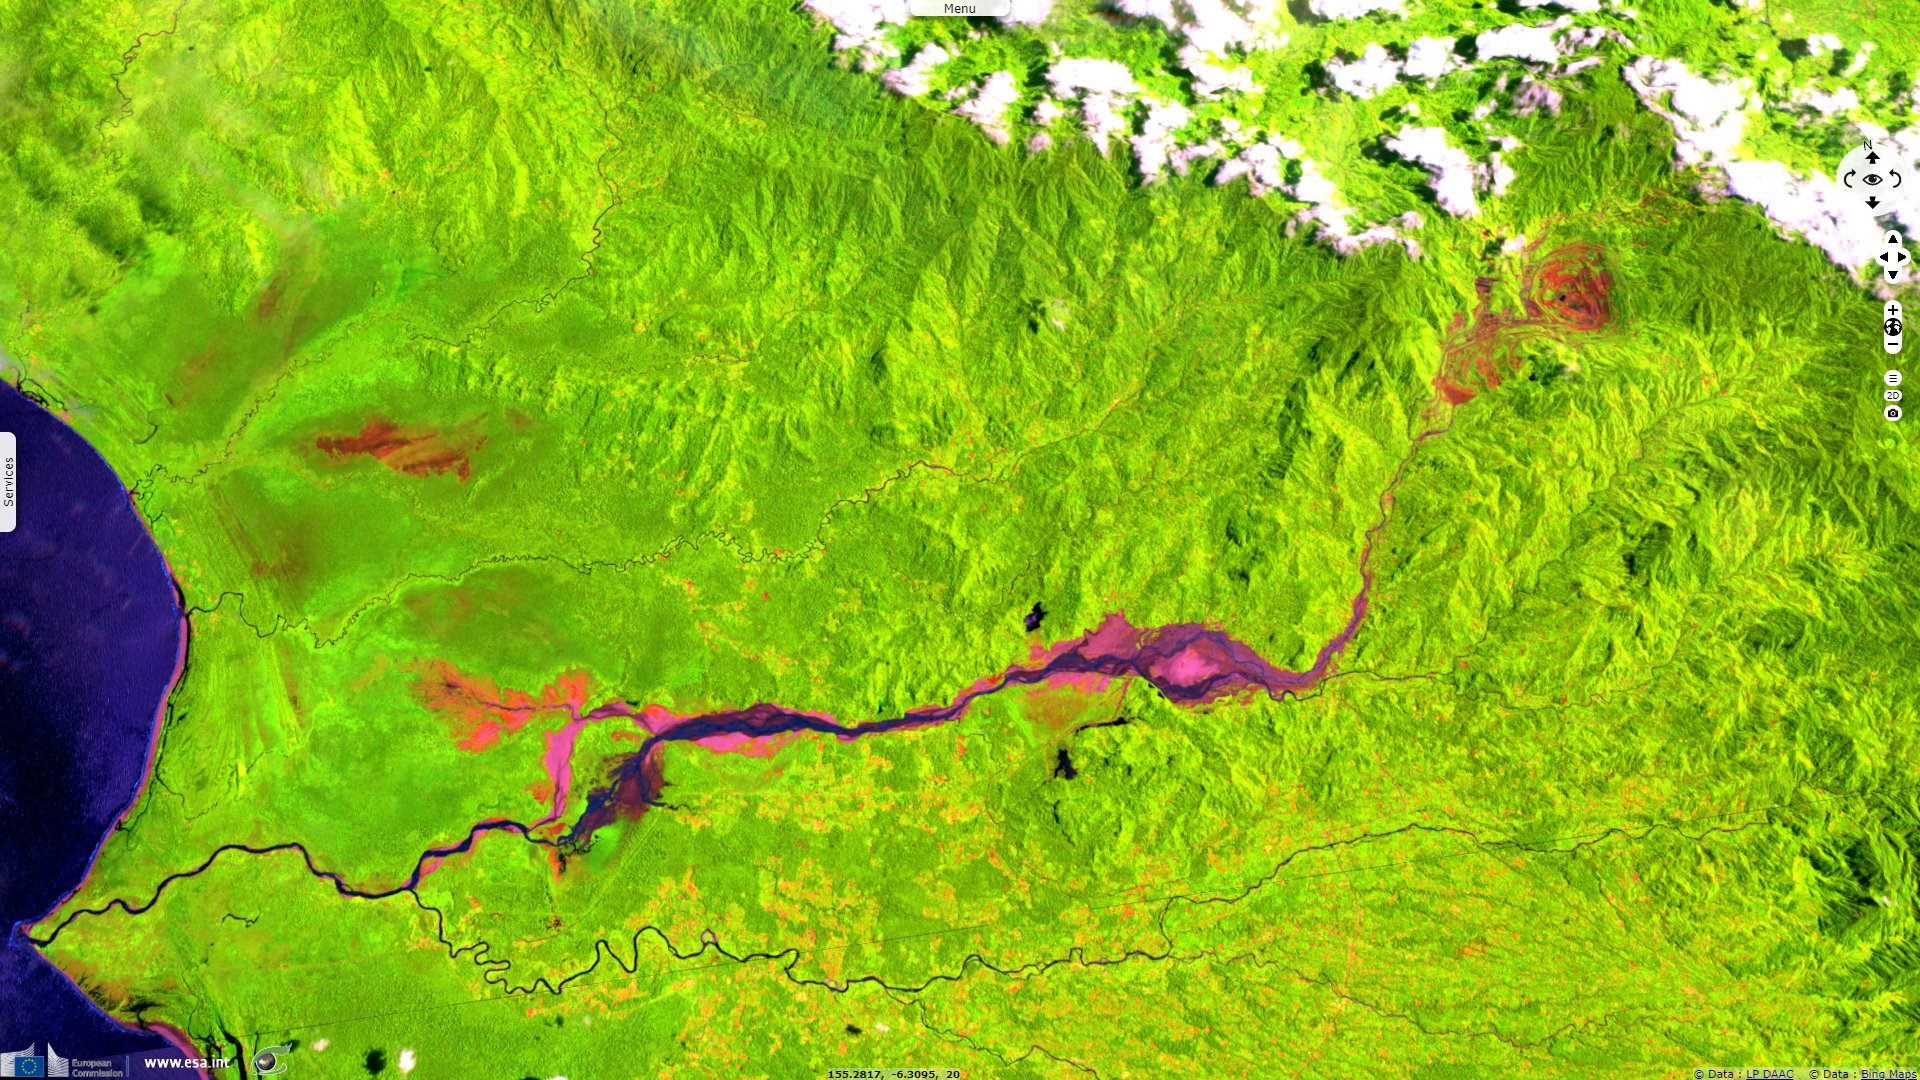
Sentinel-2 MSI acquired on 15 November 2015 at 00:07:42 UTC
...
Sentinel-1 CSAR IW acquired on 12 February 2020 from 08:05:47 to 08:06:16 UTC
Sentinel-1 CSAR IW acquired on 13 February 2020 from 07:56:46 to 07:57:11 UTC
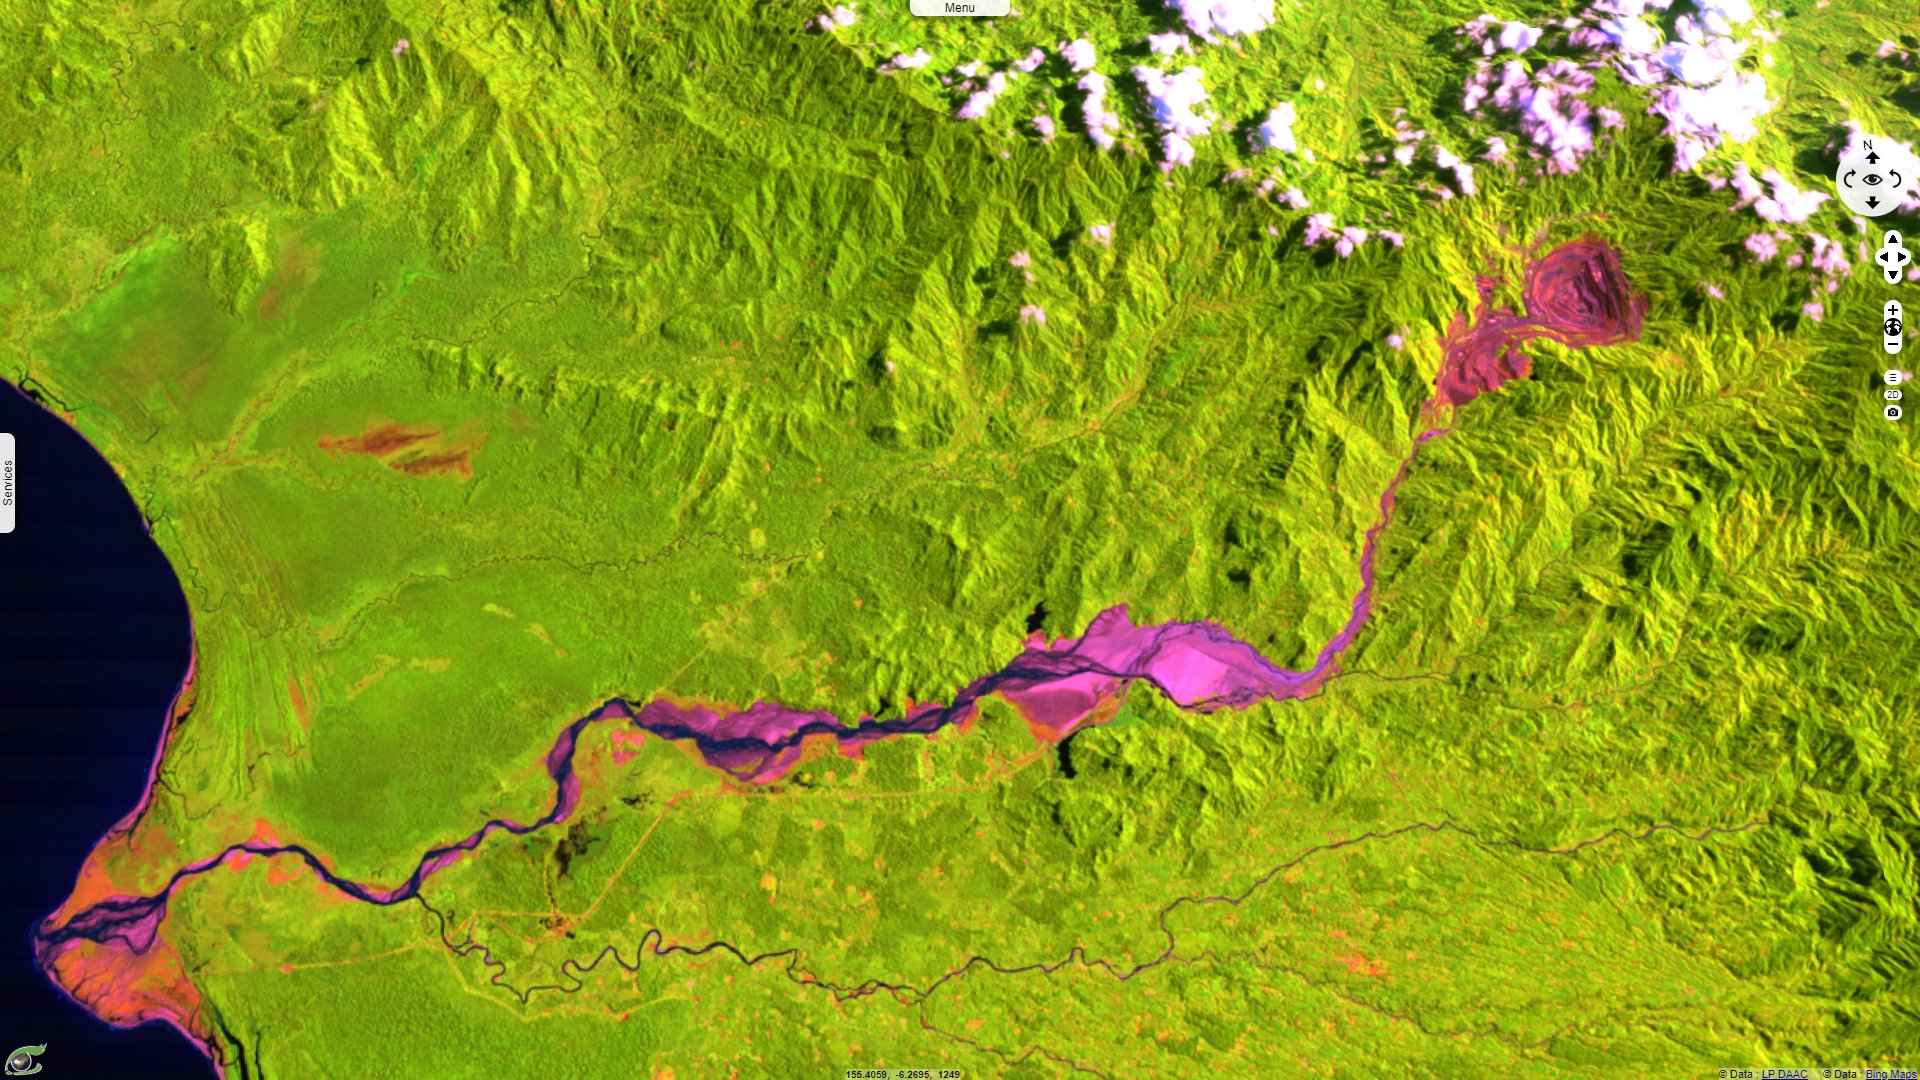
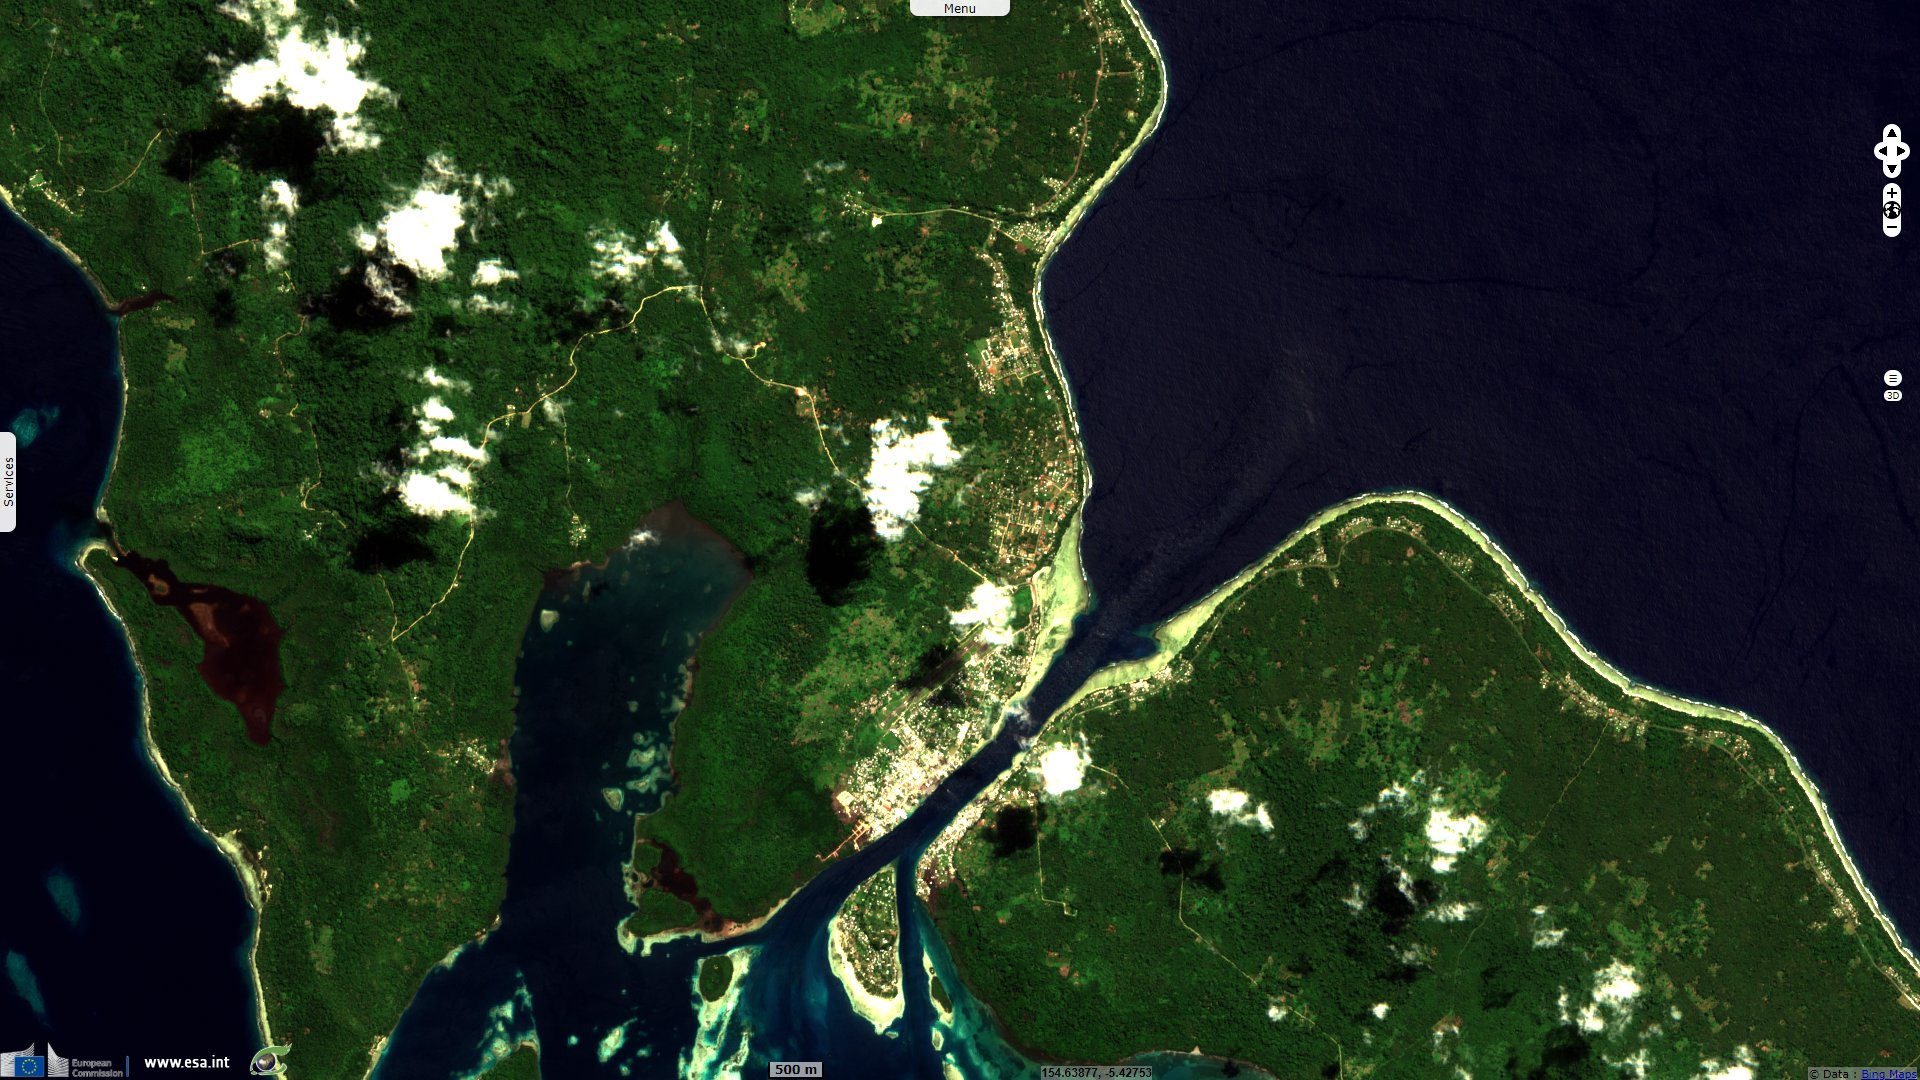
Sentinel-2 MSI acquired on 13 March 2020 at 00:07:31 UTC
...
Sentinel-1 CSAR IW acquired on 12 February 2020 from 08:05:47 to 08:06:16 UTC
Sentinel-1 CSAR IW acquired on 13 February 2020 from 07:56:46 to 07:57:11 UTC
Sentinel-2 MSI acquired on 13 March 2020 at 00:07:31 UTC
Keyword(s): Island, coastal, delta, hydrology, mine, natural ressources, pollution, security, urban, forestry, Papua New Guinea
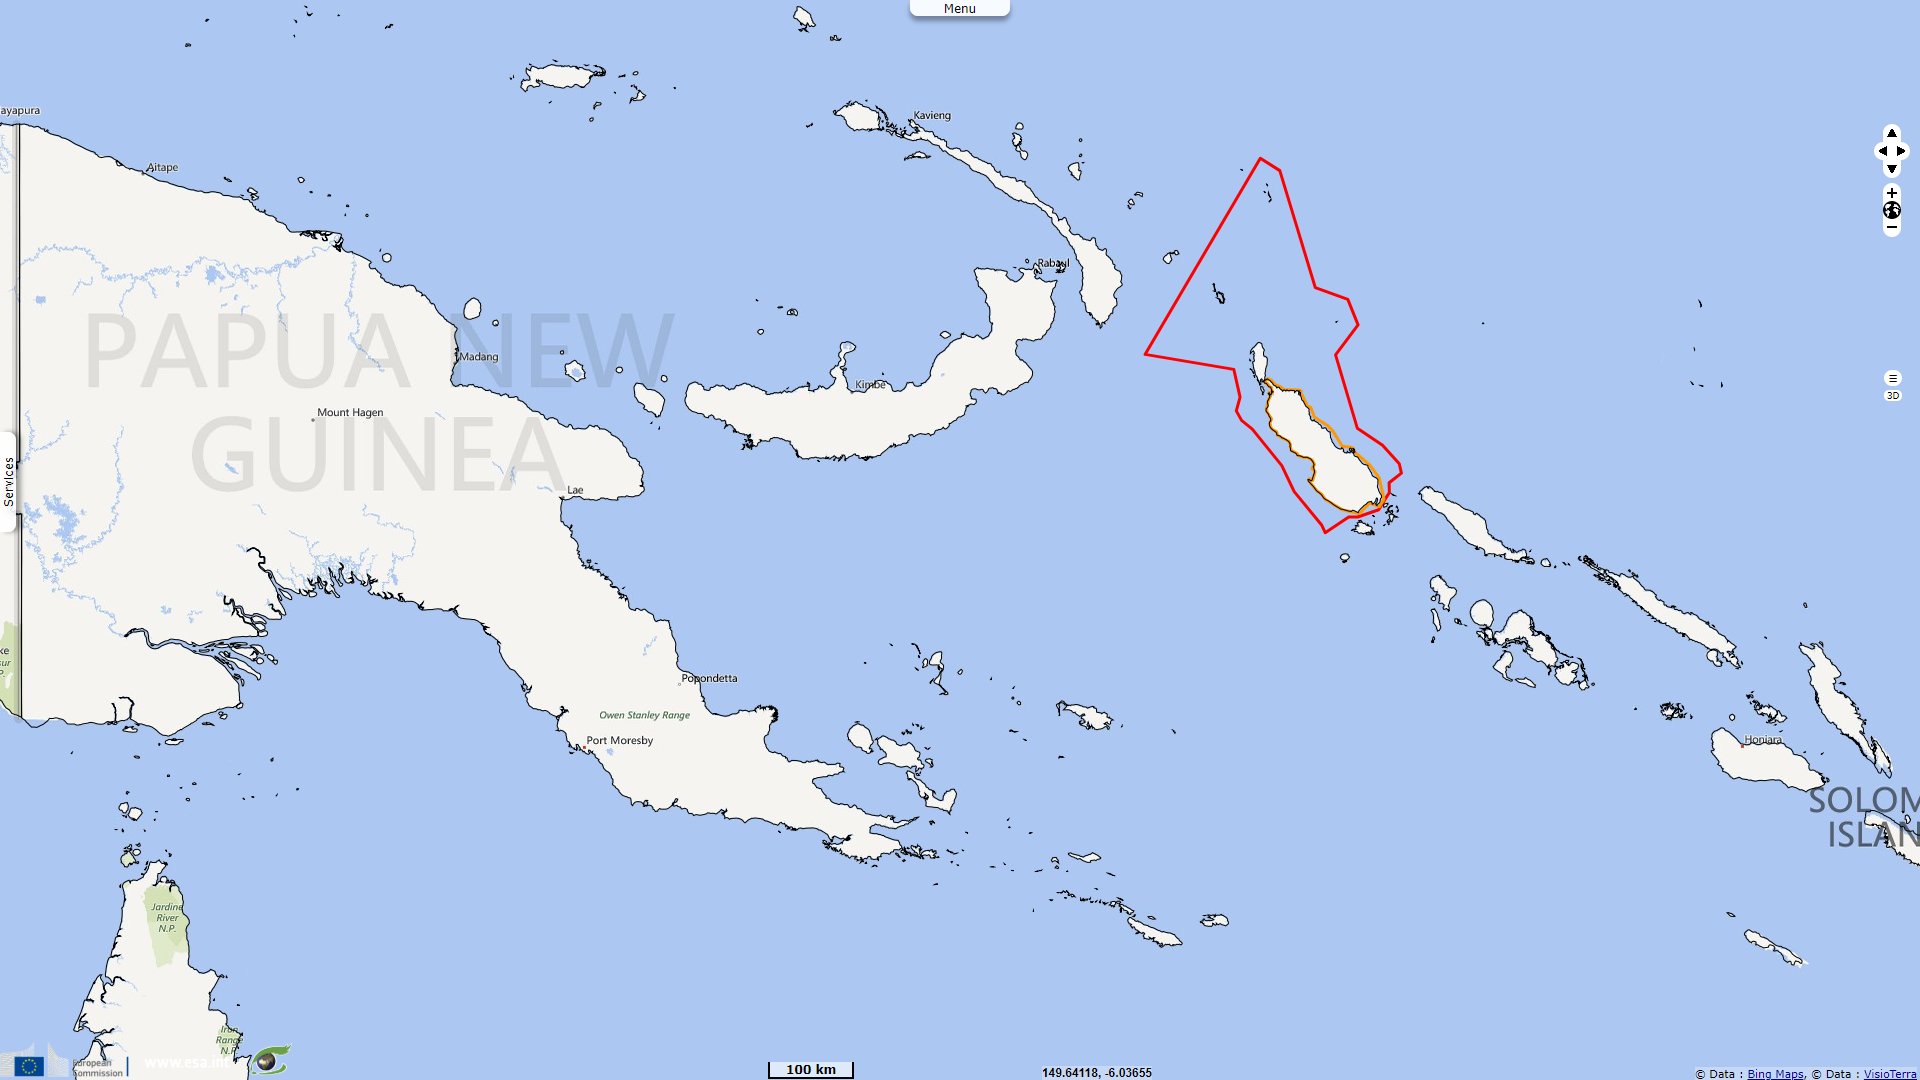
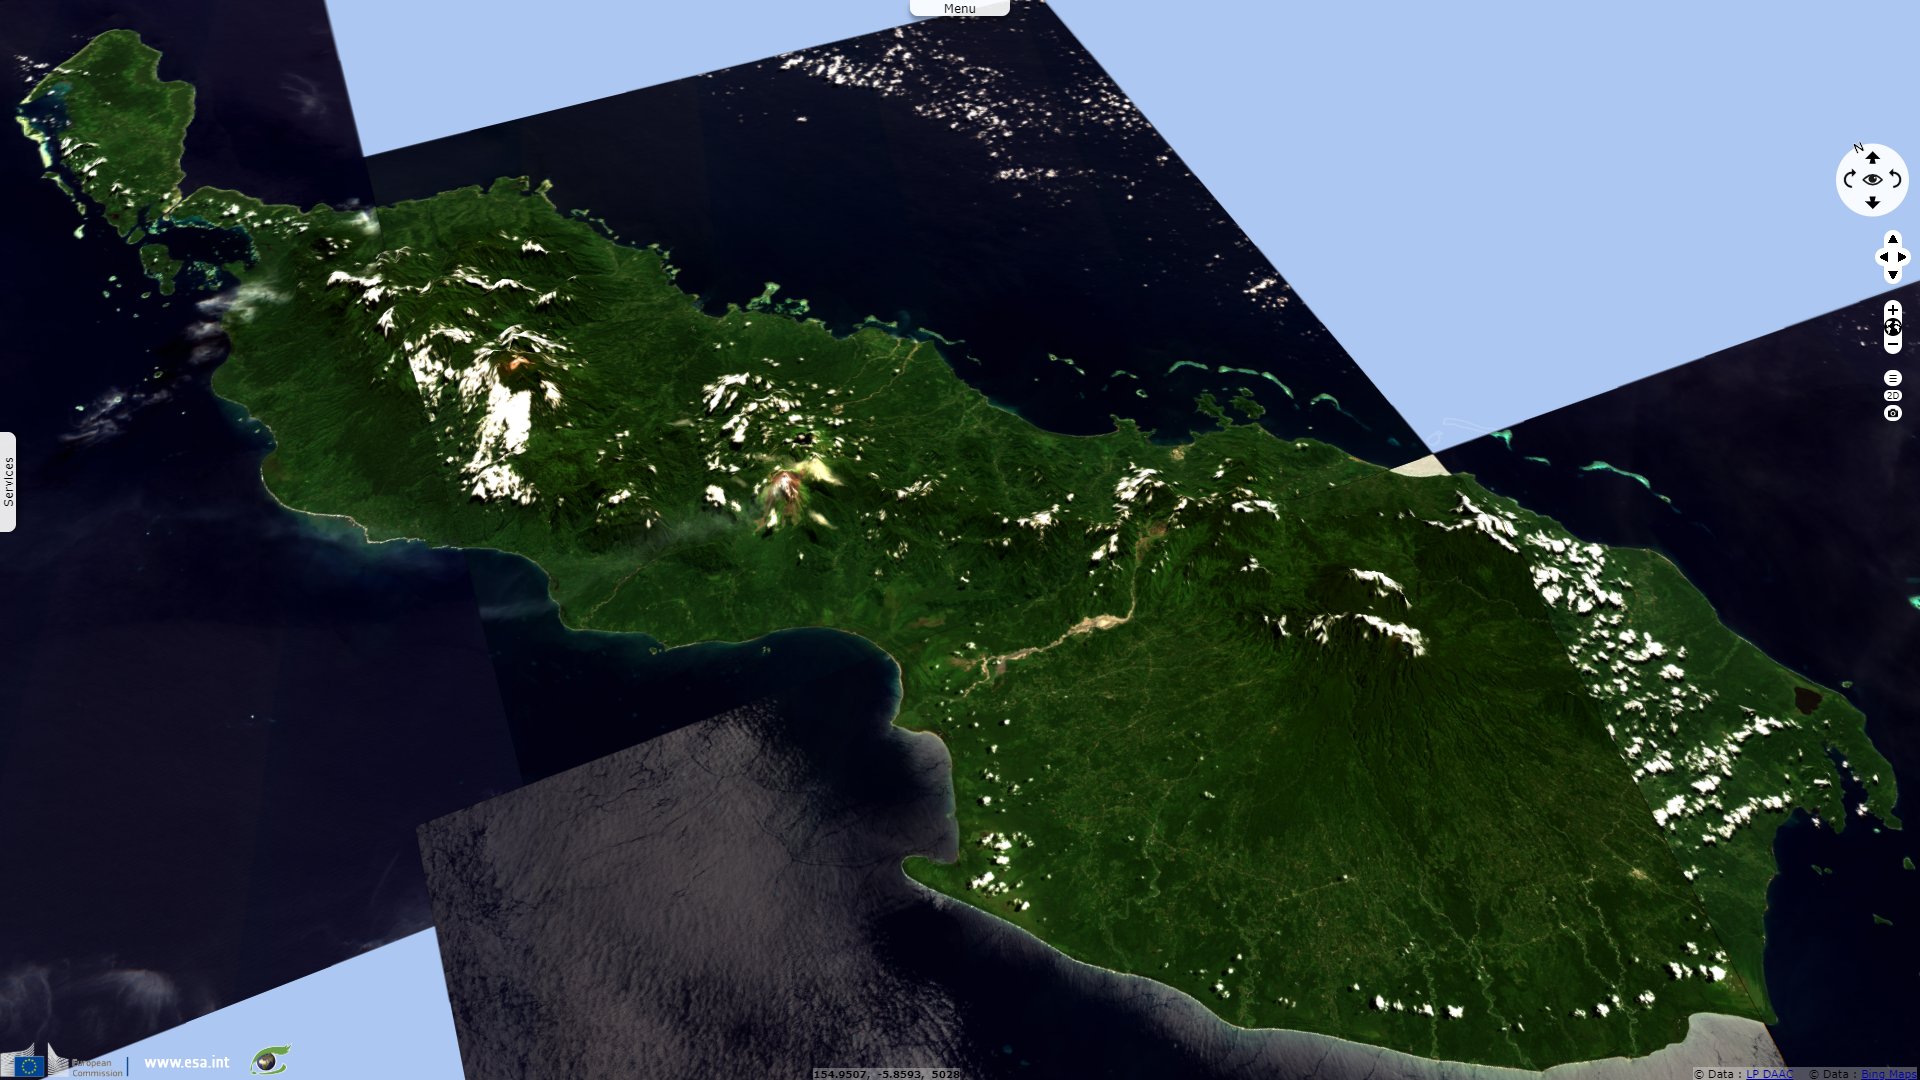
The exploitation of a copper mine in Bougainville Island had large environmental consequences, which led to extreme political outcomes. Doctor Christian Depraetere, researcher at French National Reseach Institute for Sustainable Development (Institut de Recherche pour le Développement, IRD), develops the repercussions of this exploitation: "Located East of New Guinea, Bougainville Island was encompassed within the Independent State of Papua New Guinea until November 2019 but it should declare its independence as a result of an overwhelmingly positive official referendum. It owes its name to the French navigator Louis Antoine de Bougainville who was the first European to discover it in 1768. It is the westernmost and the largest of Salomon Islands with 8762 km², a size similar to Puerto Rico or Corsica. Its population is estimated at 266 200 inhabitants, mostly of Melanesian culture."
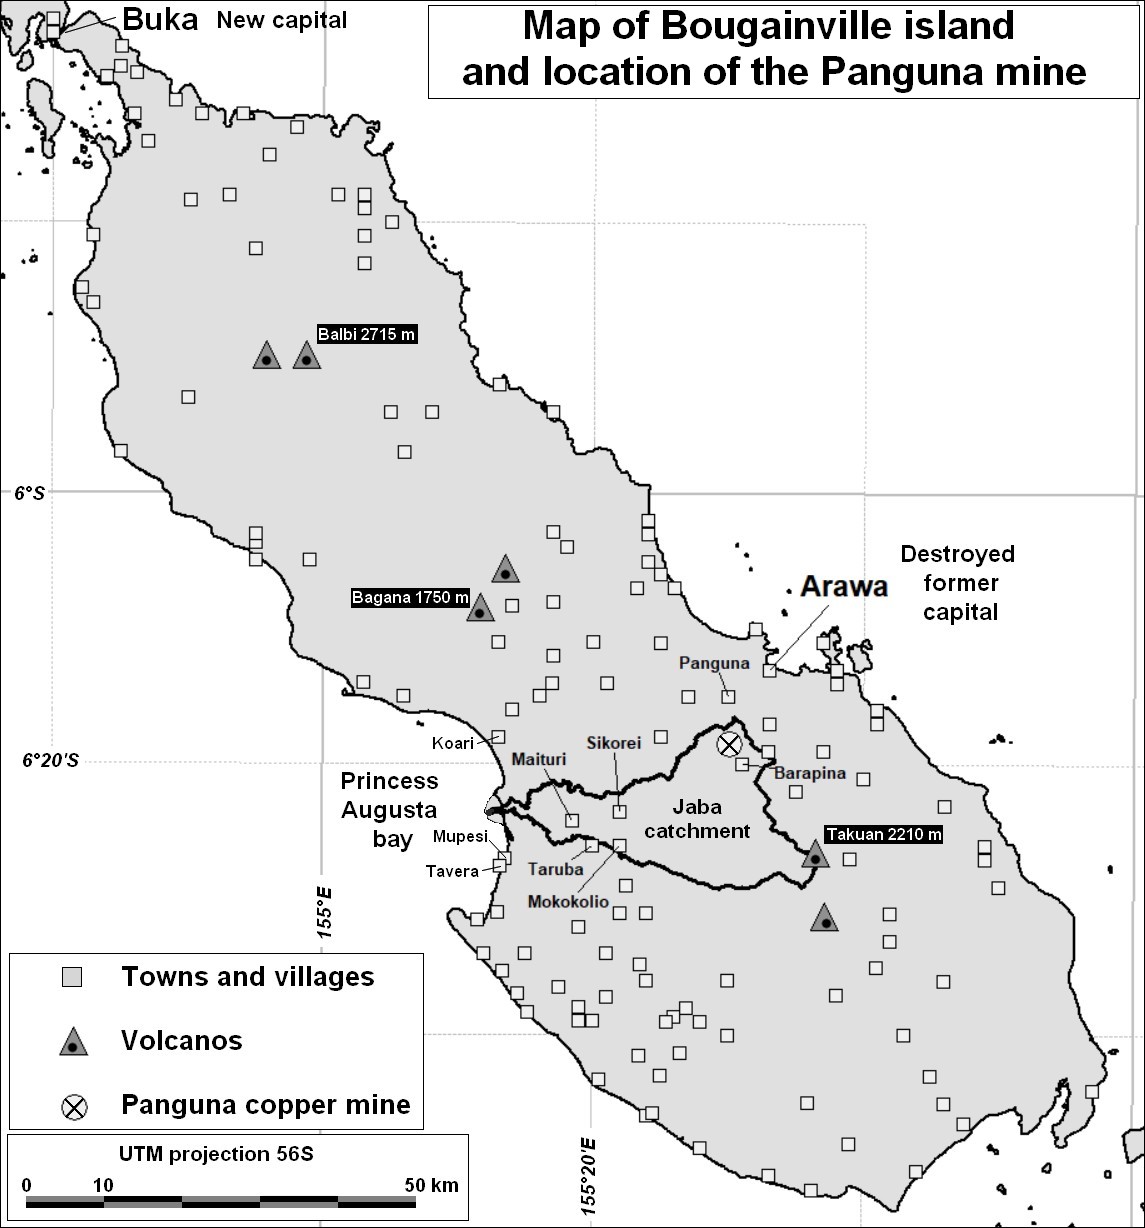
Map of the Bougainville island and location of the Panguna mine - Source: Base données Insulaires Mondiale (BIM) version 3, DATAsud, IRD
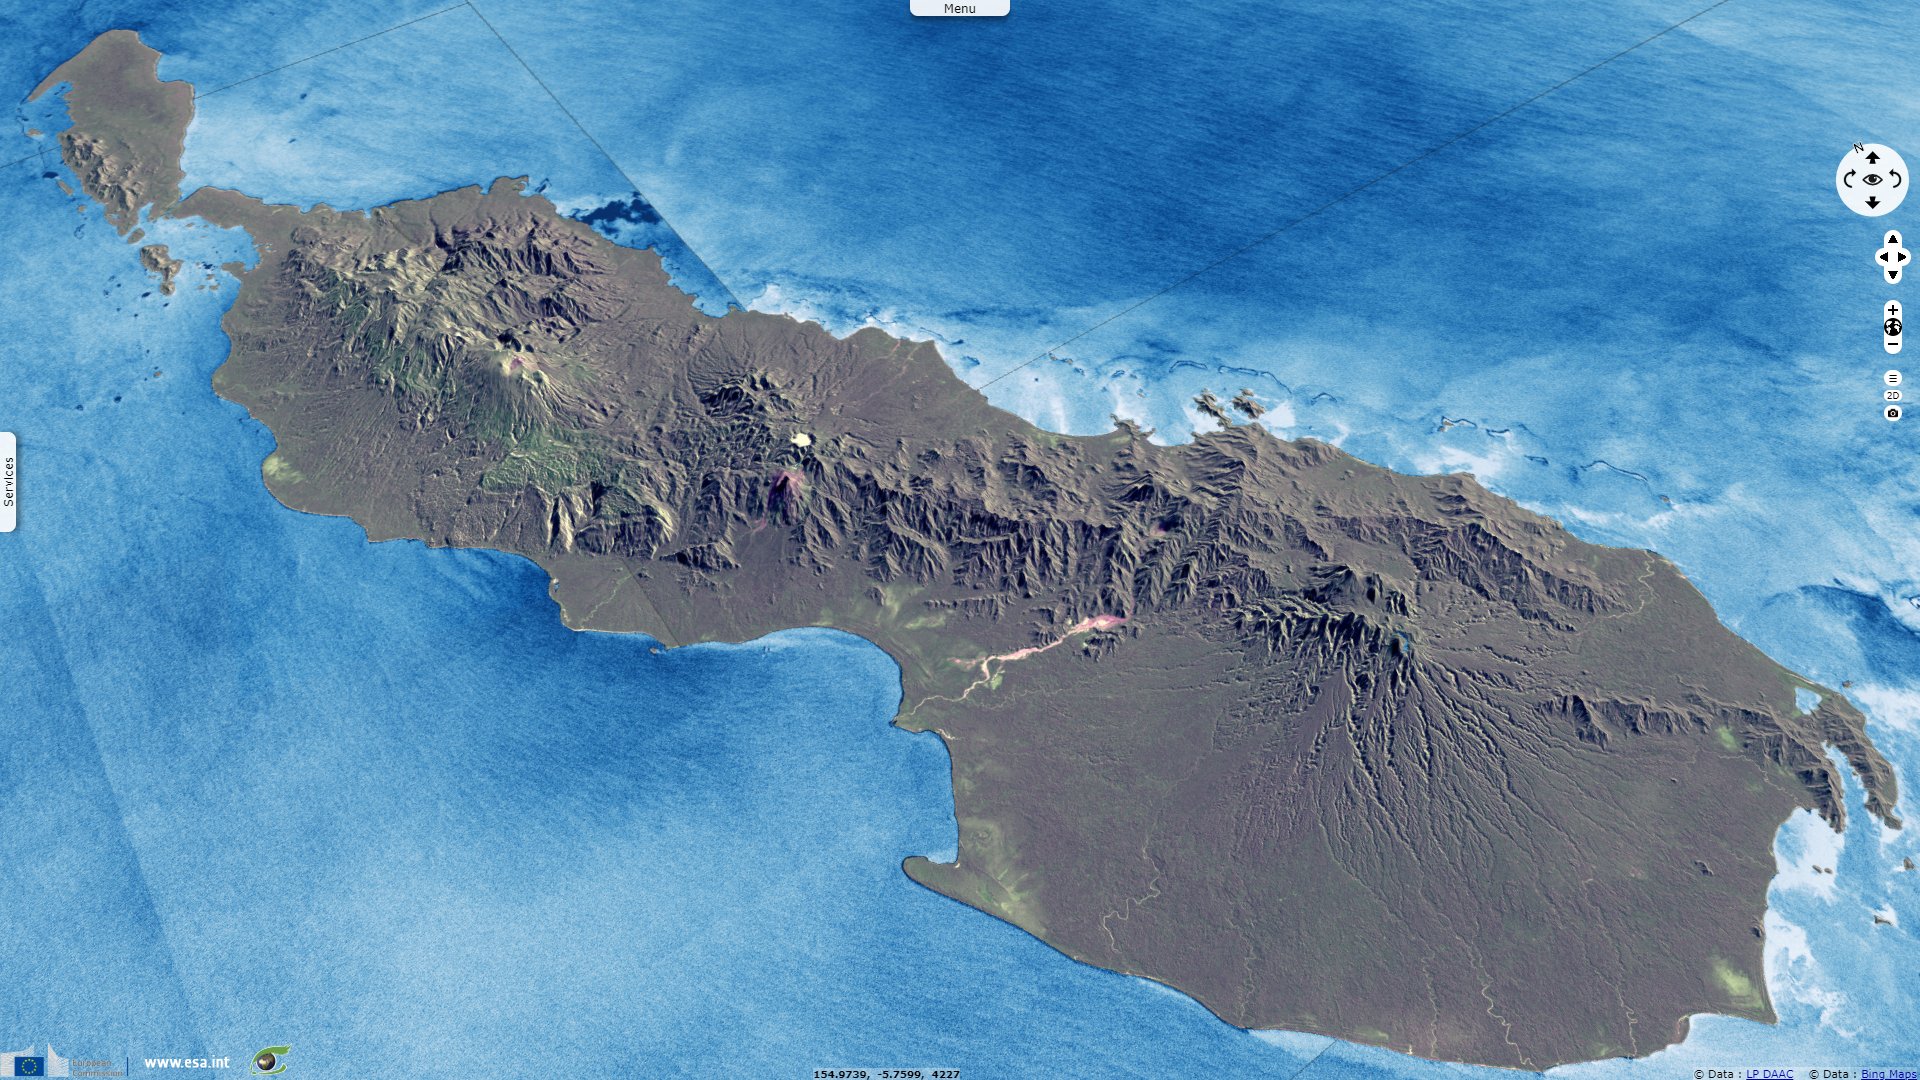
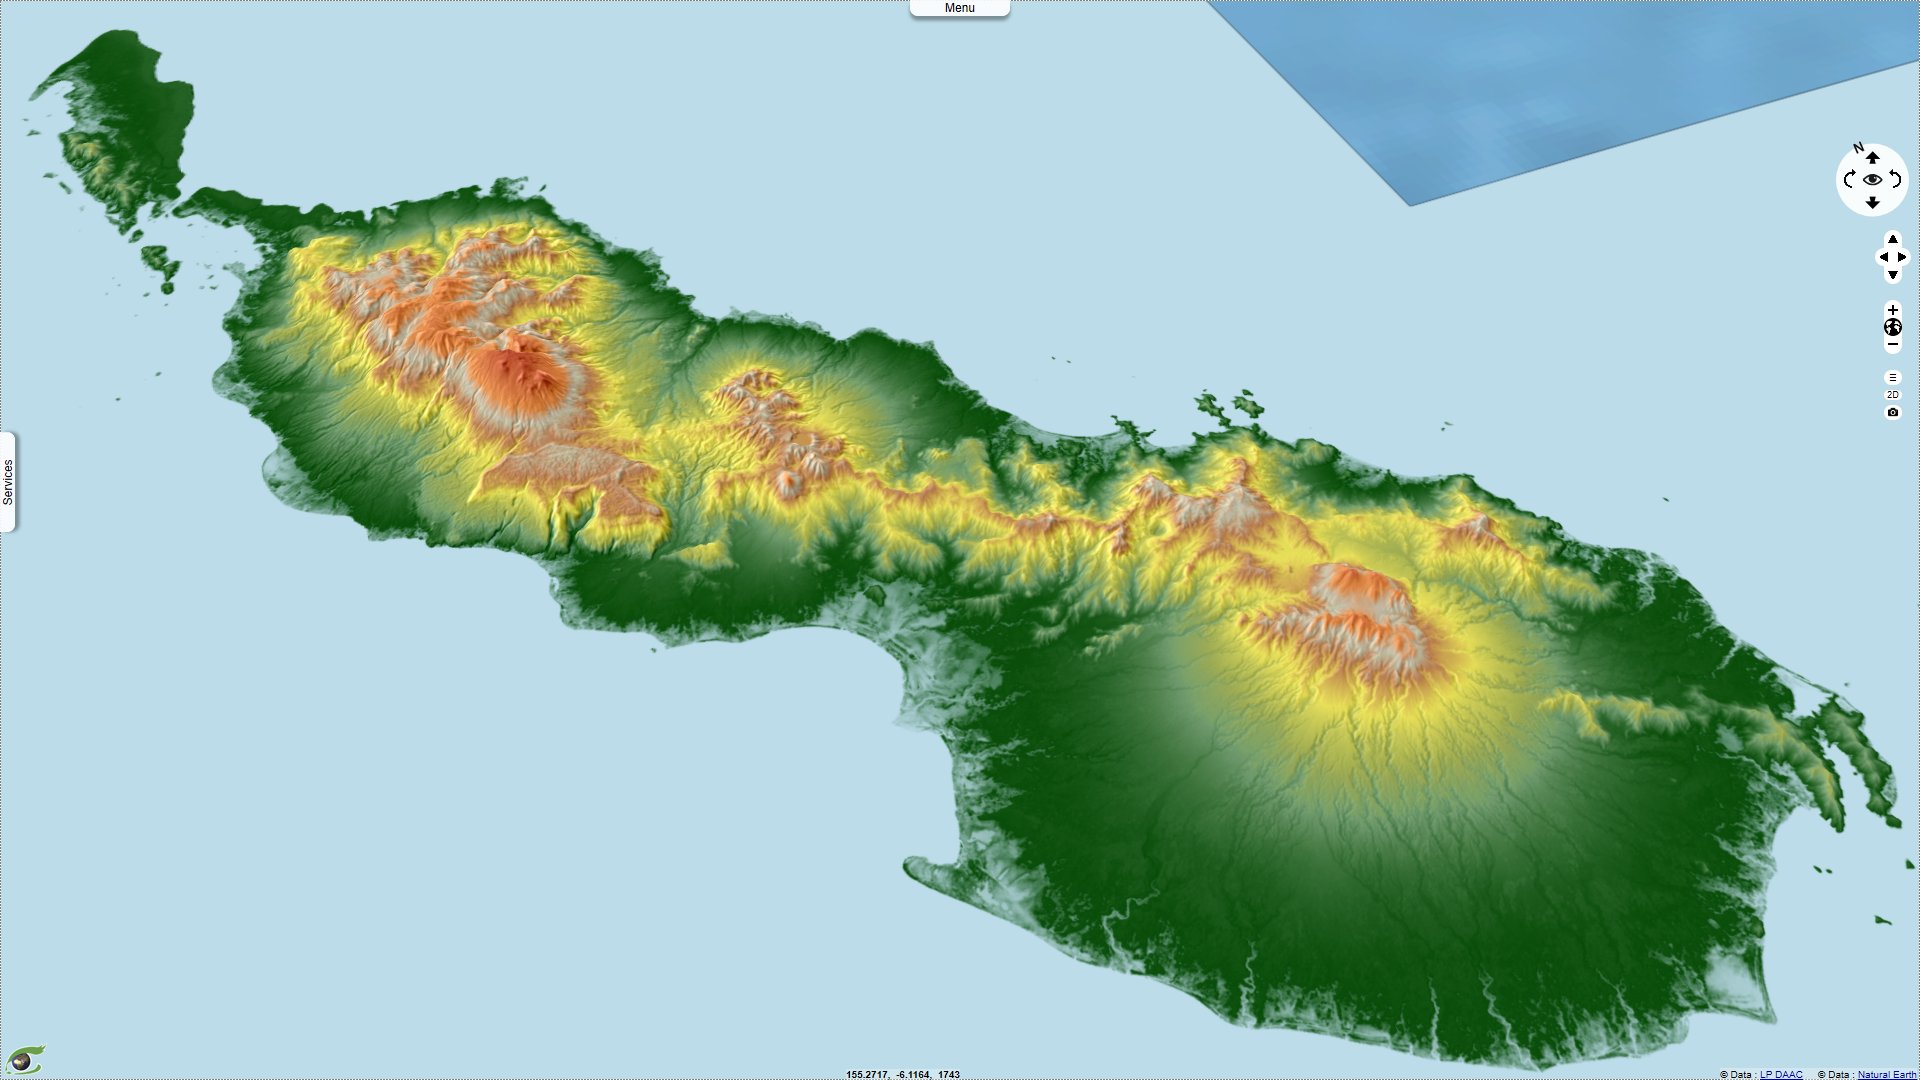
"The relief of the island is dominated by three volcanic massifs separated by large saddle points while the coasts are fringed by coral reefs."
"The climate is typically equatorial with low seasonality of temperature and precipitations. At higher elevation along the slopes of the volcanos, cooler and wetter bioclimates than the coast create a layering of vegetation visible in the Sentinel-2 images."
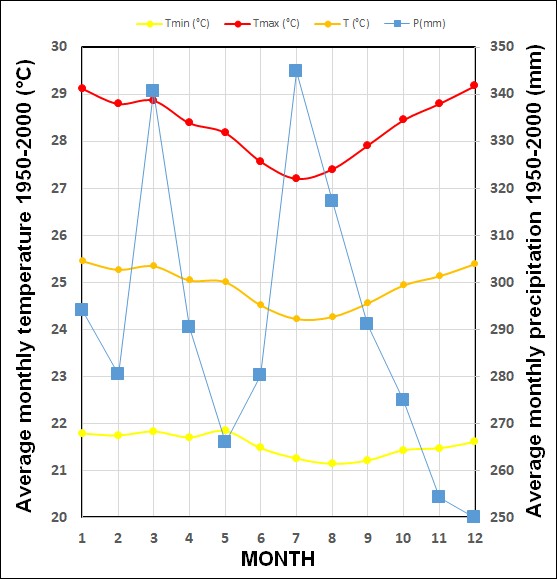
Ombrothemic curve of the Bougainville island - Source: Base données Insulaires Mondiale (BIM) version 3, DATAsud, IRD
"This island was successively colonized or occupied by the Spaniards, the Germans, the Japaneses and the Australians before being integrated to Papua New Guinea at the time of its independence in 1975. The discovery in 1969 of a huge copper deposit changed the history of the island by creating one of the largest open-pit mines in the world, that of Panguna, which was operated from 1972 to 1989."
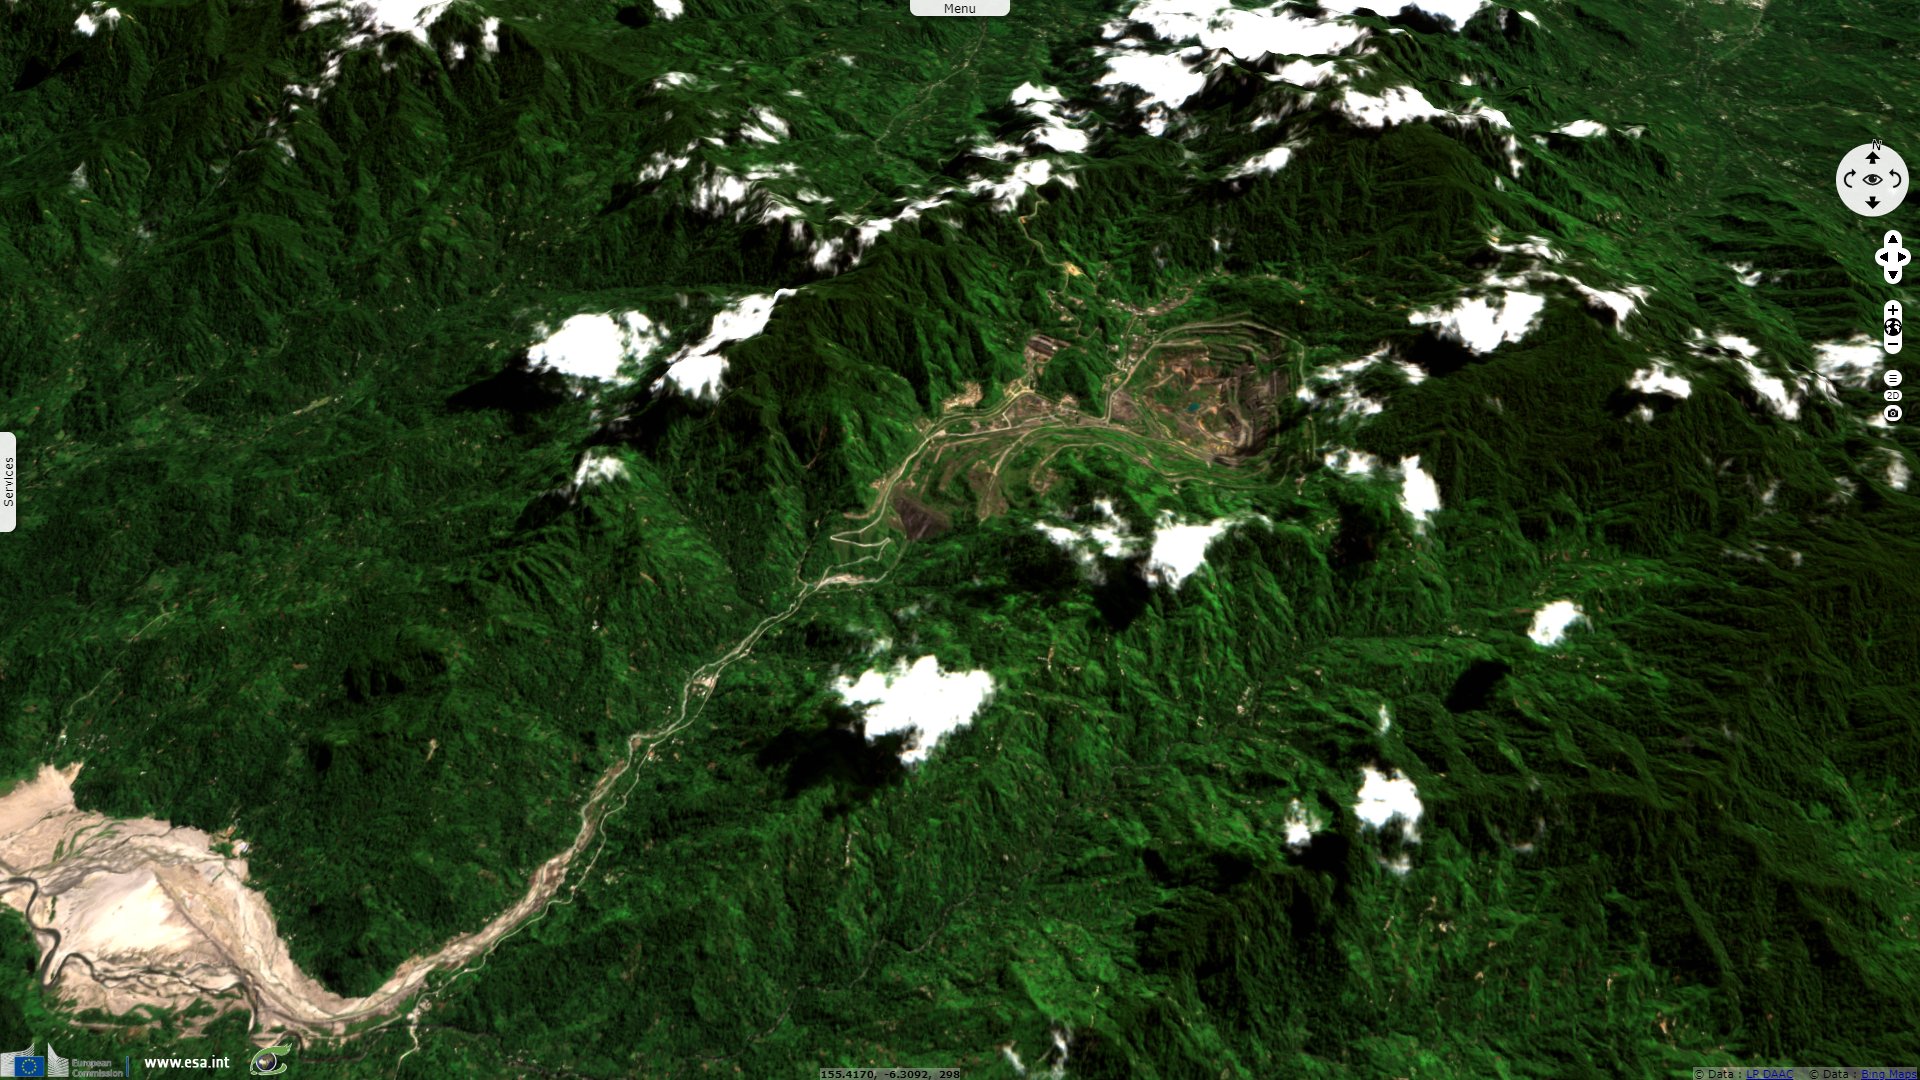
"One billion tonnes of ore, or about 0.4 km³ , will be processed, resulting in the extraction of 28 million tonnes of copper and 284 tonnes of gold. An evidence of this exploitation remains in the landscape: an excavation of 3 km² with a depth of up to 300 metres, significantly modifying the functioning and pollution of the aquifers on the flanks of the volcano."
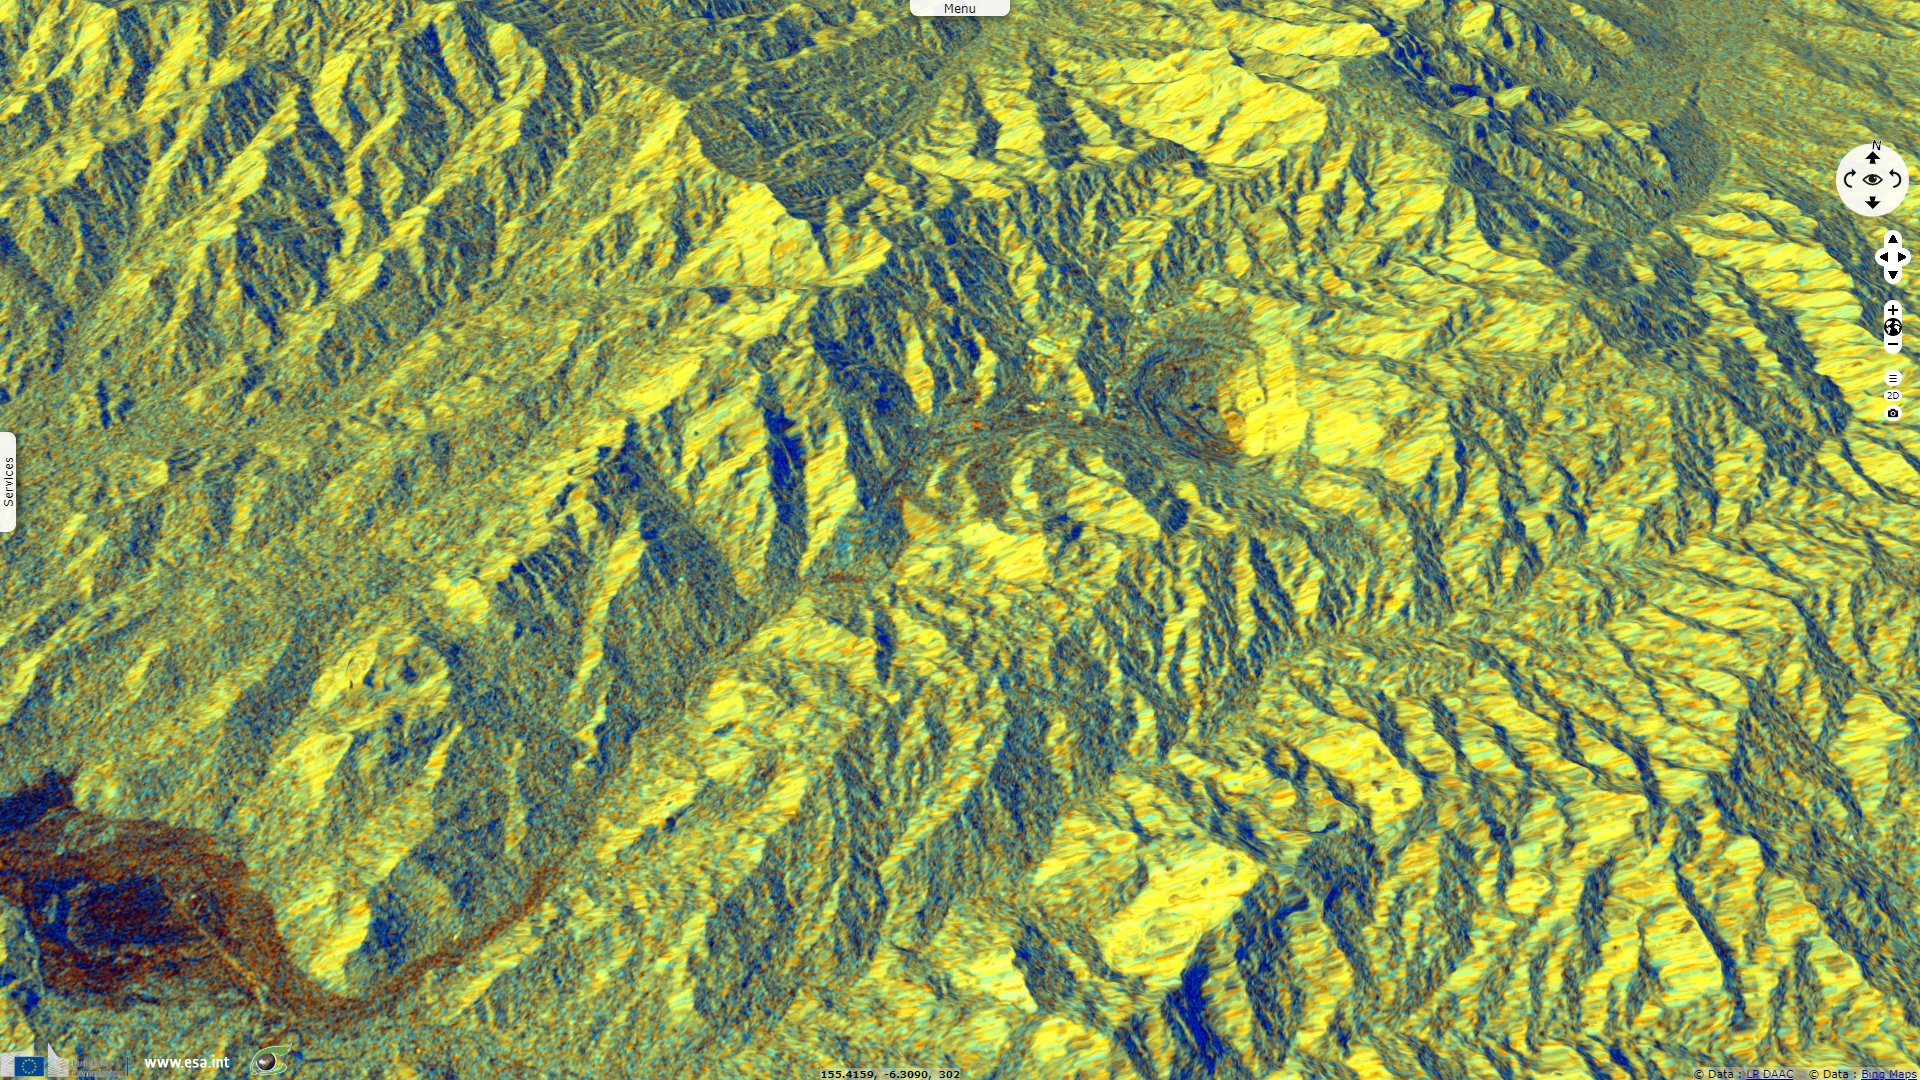
"This gaping hole in the landscape is compounded by the impact on the watershed downstream of the mine. Mining will lead to a total hydrological, geomorphological and ecological disruption of the Jaba River from the mine to the coast and beyond into Princess Augusta Bay."
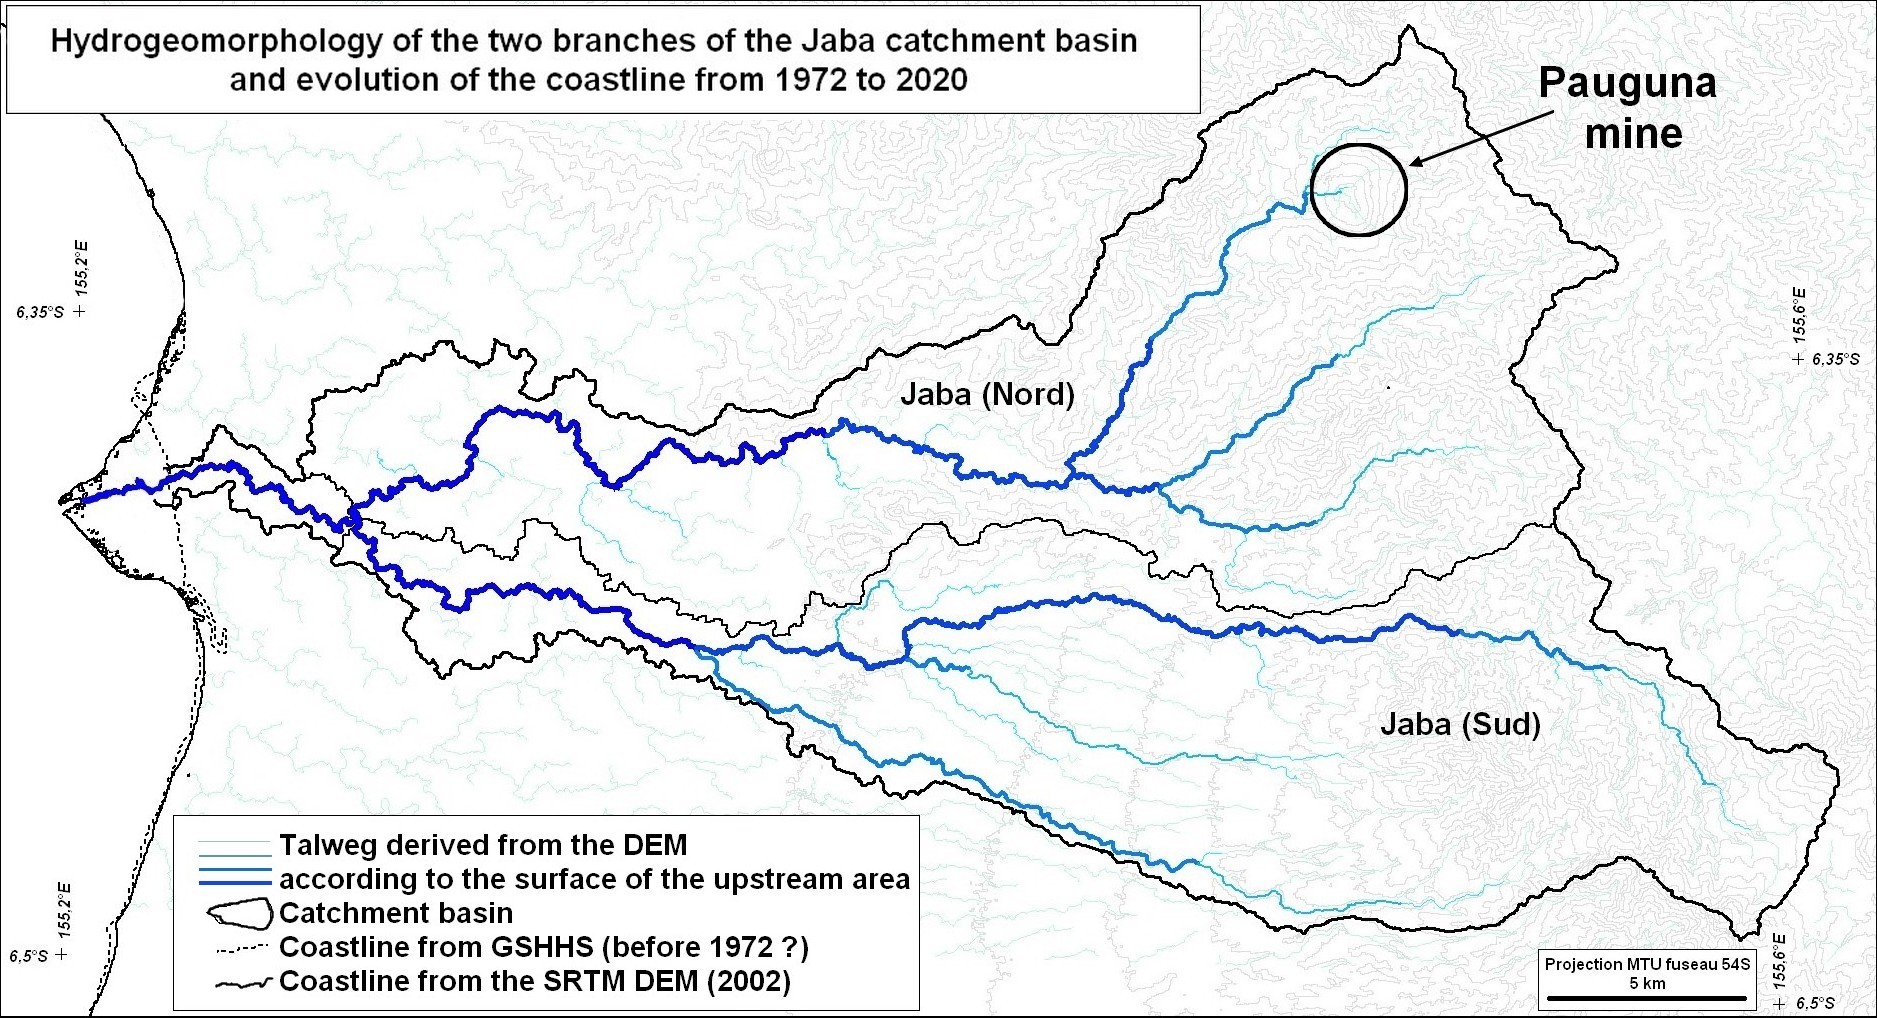
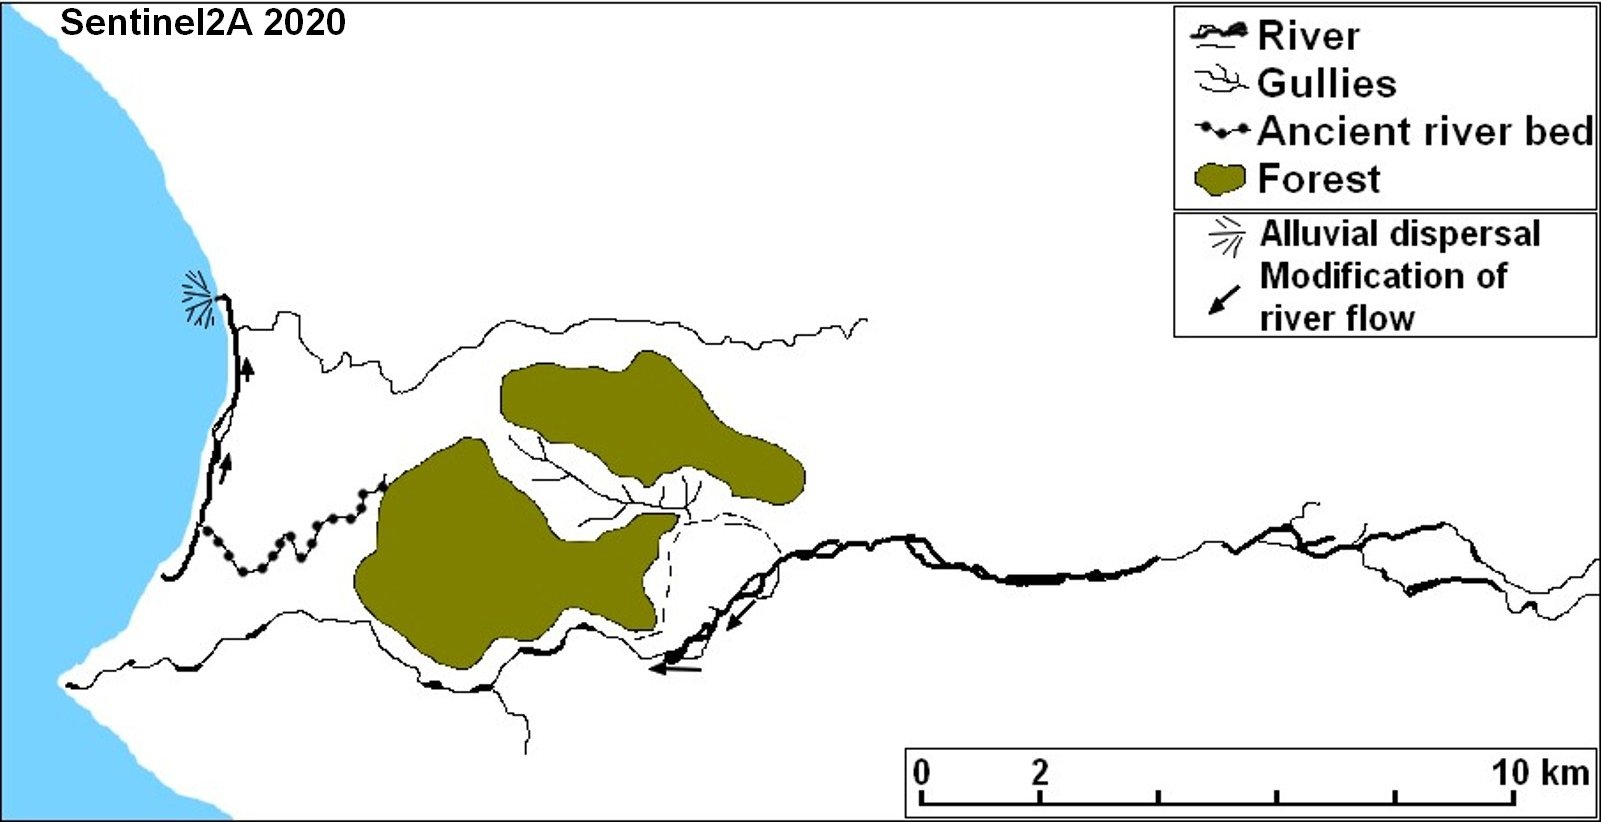
Hydrogeomorphology of the two branches of the Jaba catchment basin and evolution of the coastline from 1972 to 2020 - Source: SRTM DEM, Maison de la Télédétection, Montpellier France.
"A more detailed analysis of the hydrogeomorphological modifications of the watershed visible on remote sensing images deserves to be developed because of the interest of these specific data in the environmental impact assessment of mining activities."
Hydrogeomorphology of the two branches of the Jaba catchment basin and evolution of the coastline from 1972 to 2020 - Source: SRTM DEM, Maison de la Télédétection, Montpellier France.
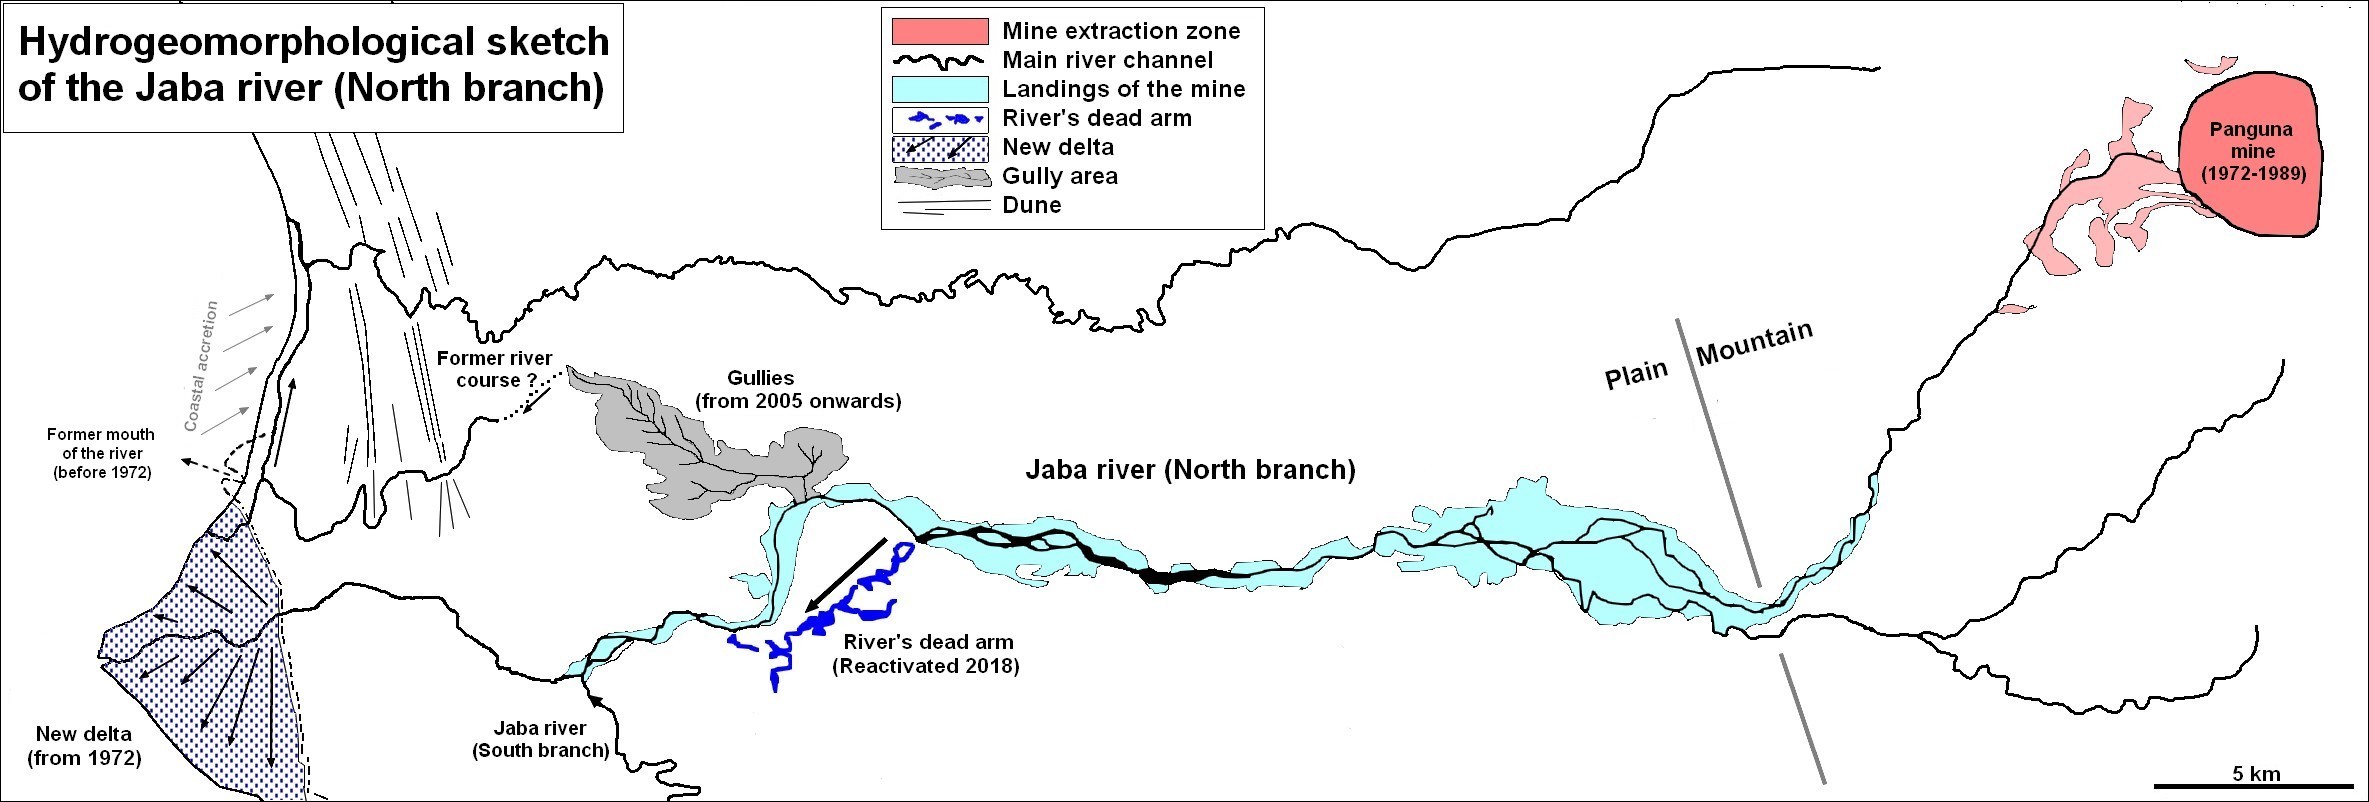
"The hydrogeomorphological diagram above summarises the evolution over the 1972-2020 period, making it possible to define a chronology of impacts during and even after exploitation as indicated by satellite images (1993-2020).
The landings in the riverbed are clearly visible in the Landsat TM image acquired in 1993 with a large 1 km wide deposit at the outlet to the plain, relayed downstream by a braided channel river bed until it reaches the neo delta. Both are probably contemporaneous with the start of mining operations in 1972. It should be noted that the portion downstream of the confluence (155.26°E 6.39°S) with the southern branch of the watershed appears narrower on Landsat-7 ETM+ image acquired in 2010 and Sentinel-2A image acquired in 2020. It is due to the remobilization of alluvial deposits by the waters of the south Jaba tributary that was not affected by the mine and the recolonization and stabilization of the river banks by vegetation."
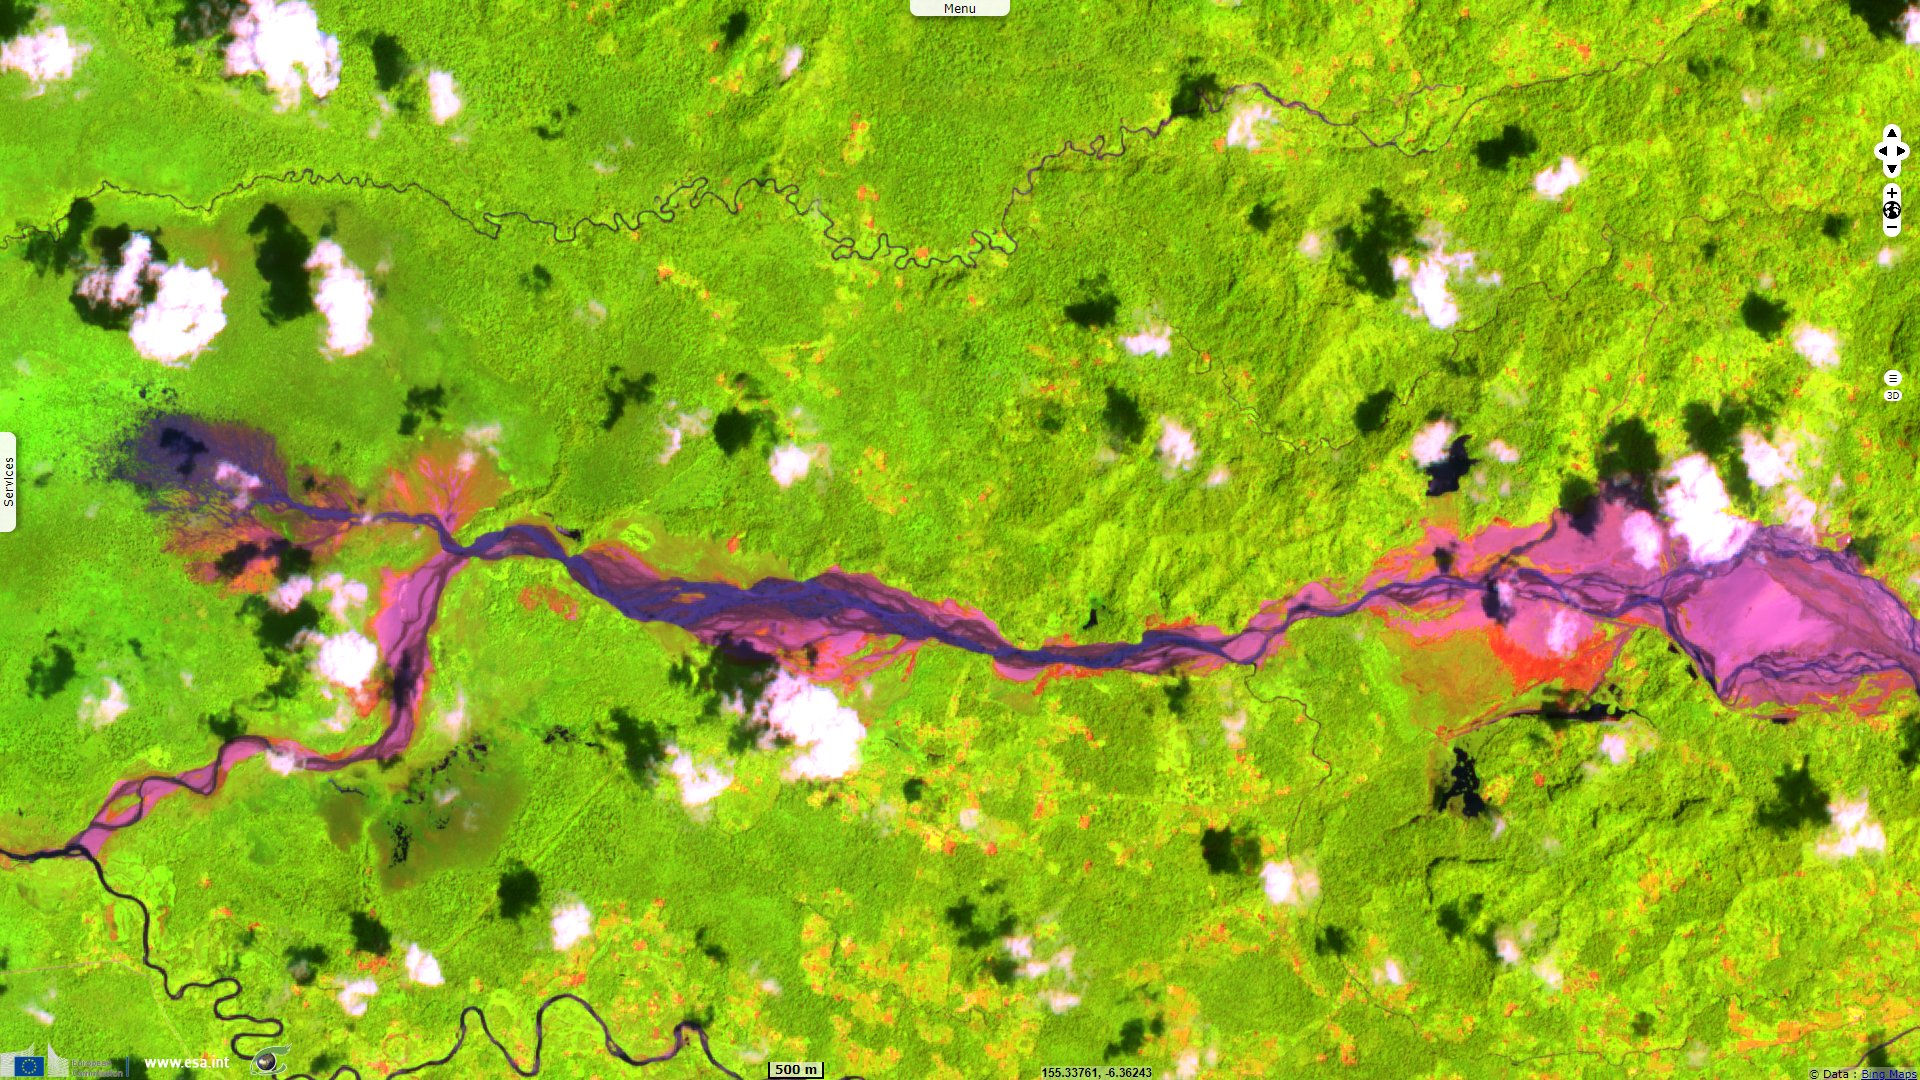
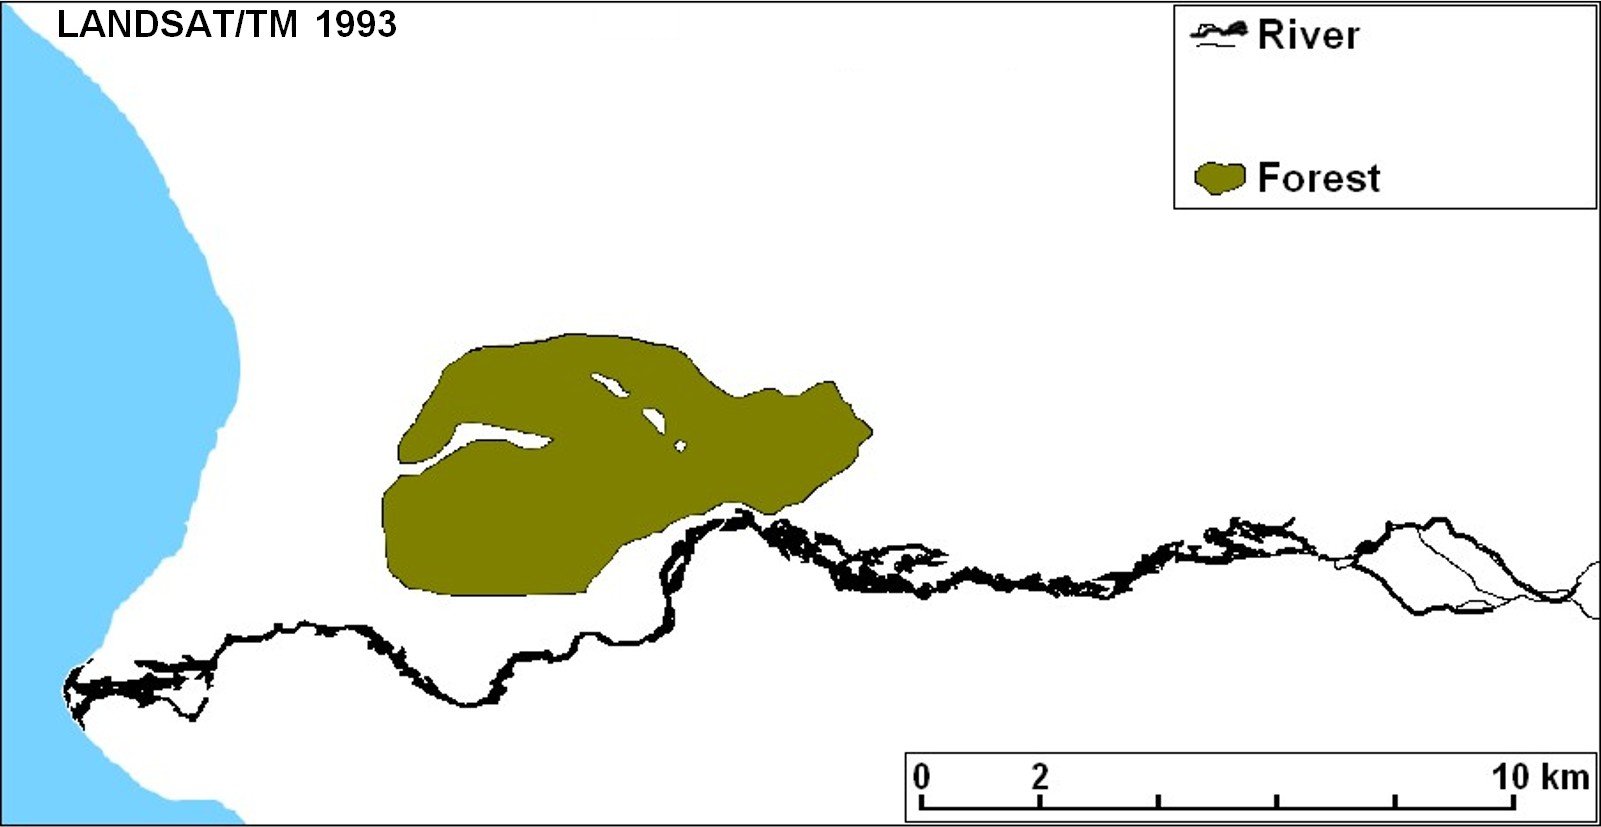
Situation of the Jaba riverbed in 1993 – Source: Christian Depraetere, Maison de la Télédétection, Montpellier
"Between 2001 and 2010, a gully zone (155.29°E 6.36°S) appears on the right bank of the Jaba River (Landsat-7/ETM+ 2010) then develops by regressive erosion to a maximum extent until 2017 (Sentinel-2B/MSI 2017) and then regresses progressively until 2020 (Sentinel-2A/MSI 2020)."
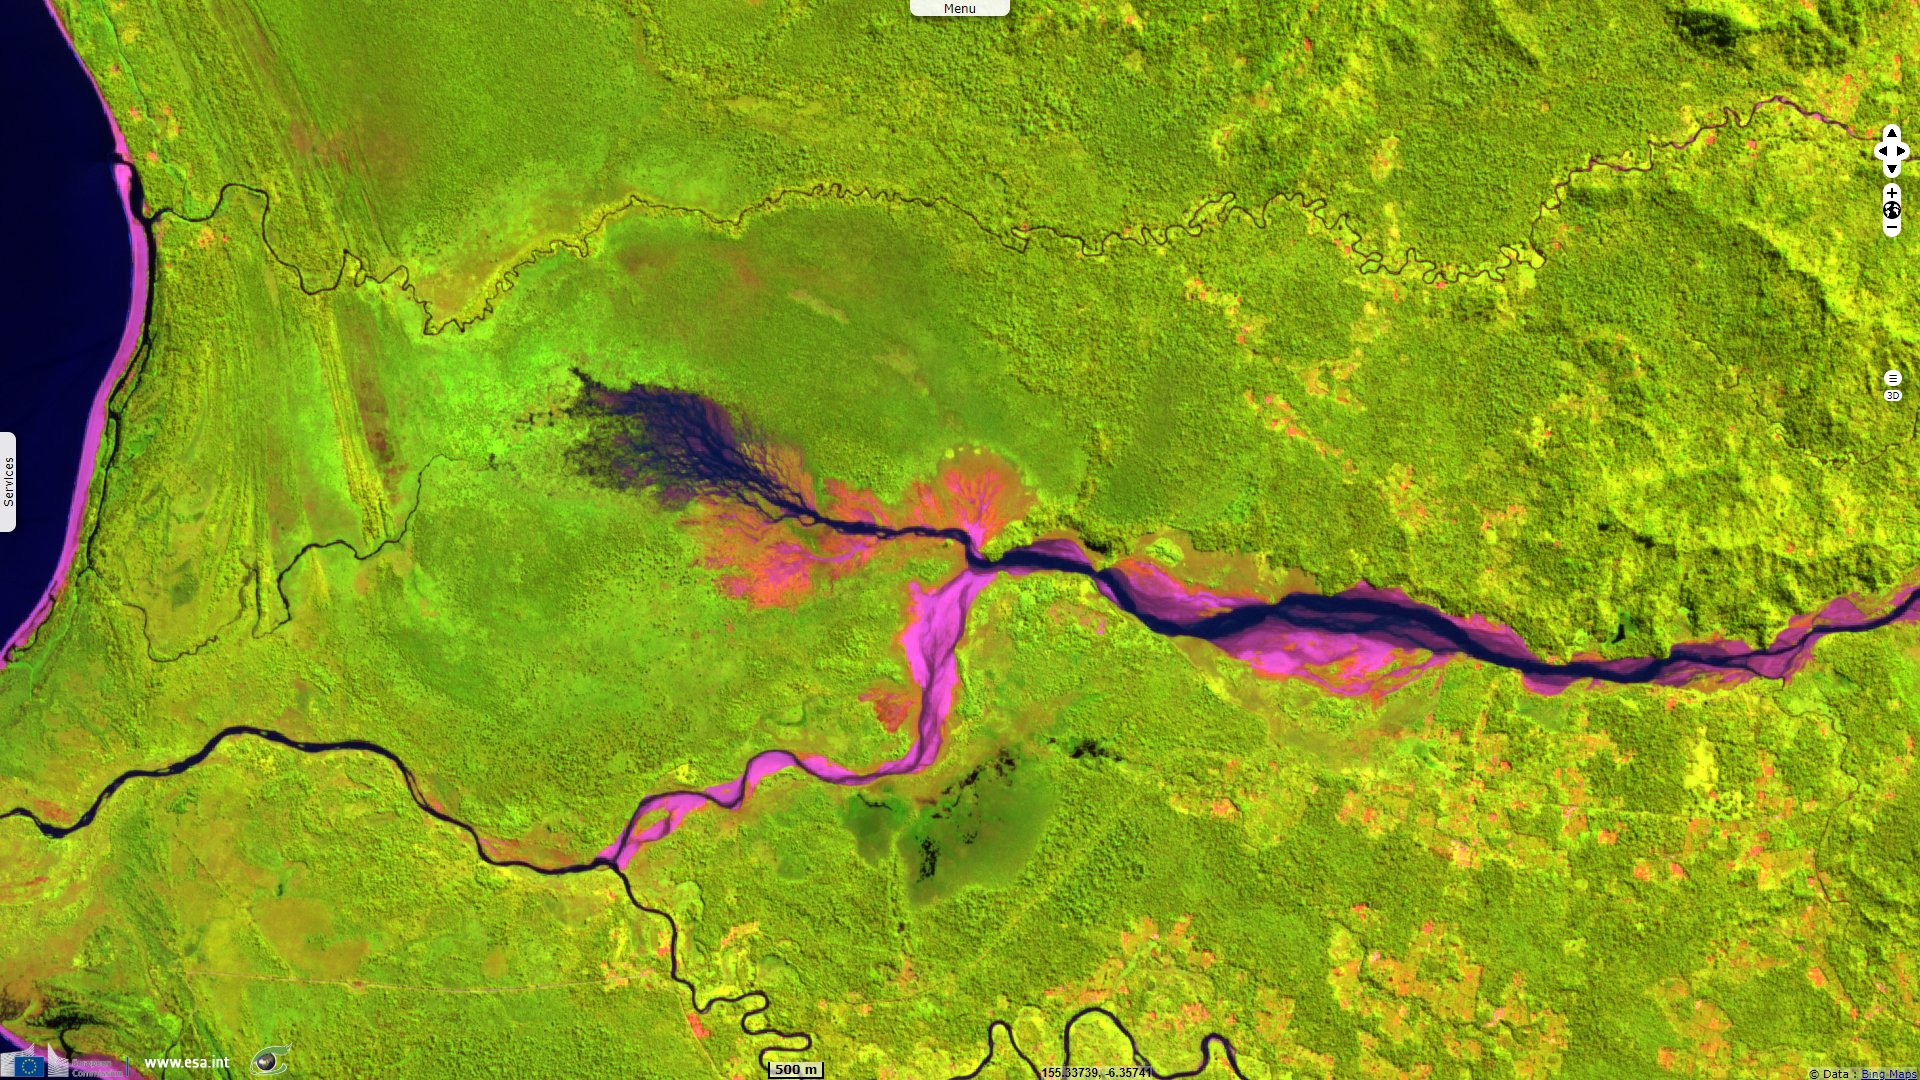
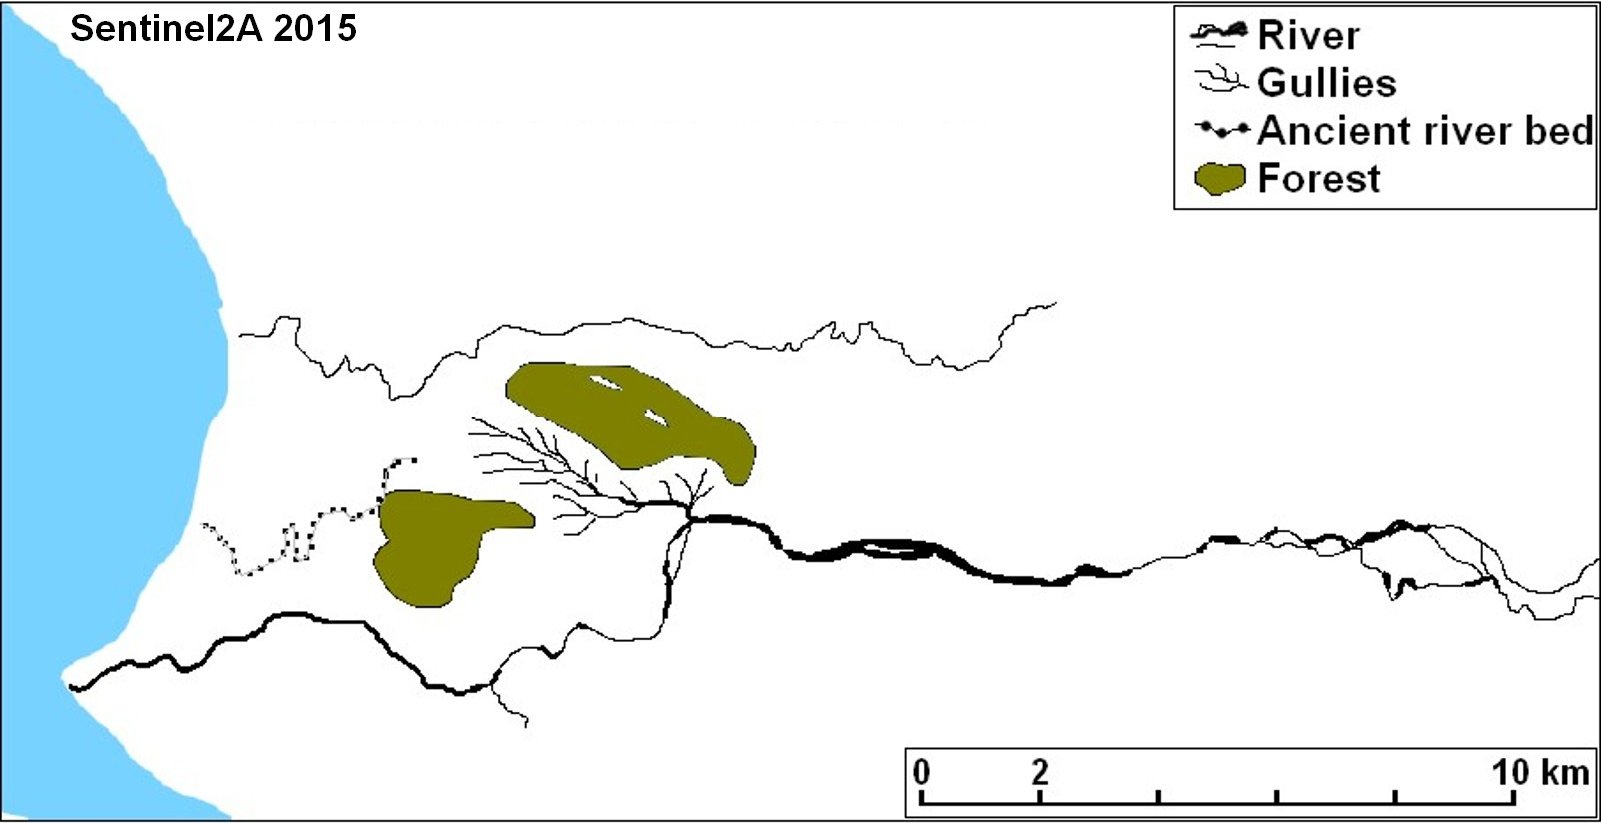
Evolution of the situation of the Jaba riverbed in 2015 – Source: Christian Depraetere, Maison de la Télédétection, Montpellier
"In 2018 (Sentinel-2B/MSI 2018), the bed of the Jaba River begins to reoccupy the old dead arm on the left bank (155.30°E 6.38°S) which becomes the main course of the river again in 2020 (Sentinel-2A/MSI 2020)."
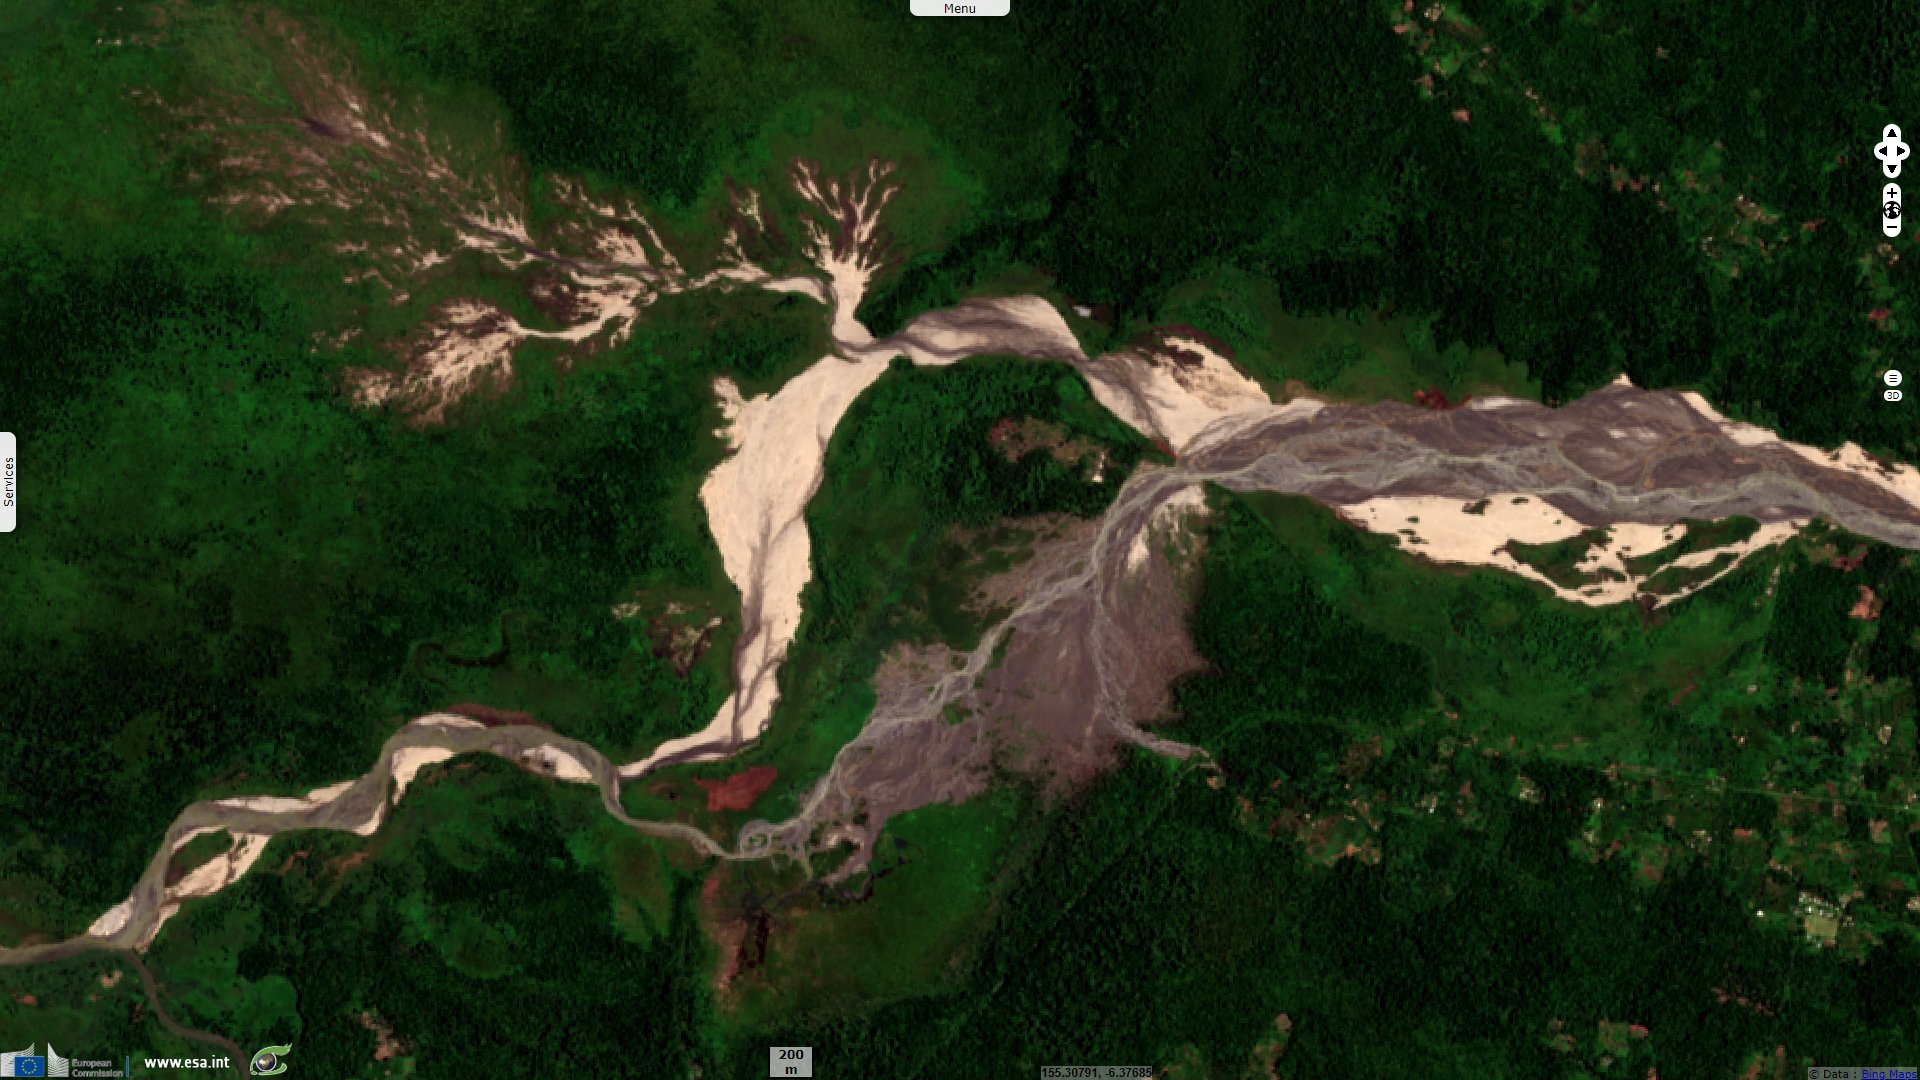
Situation of the Jaba riverbed in 2020 – Source: Christian Depraetere, Maison de la Télédétection, Montpellier
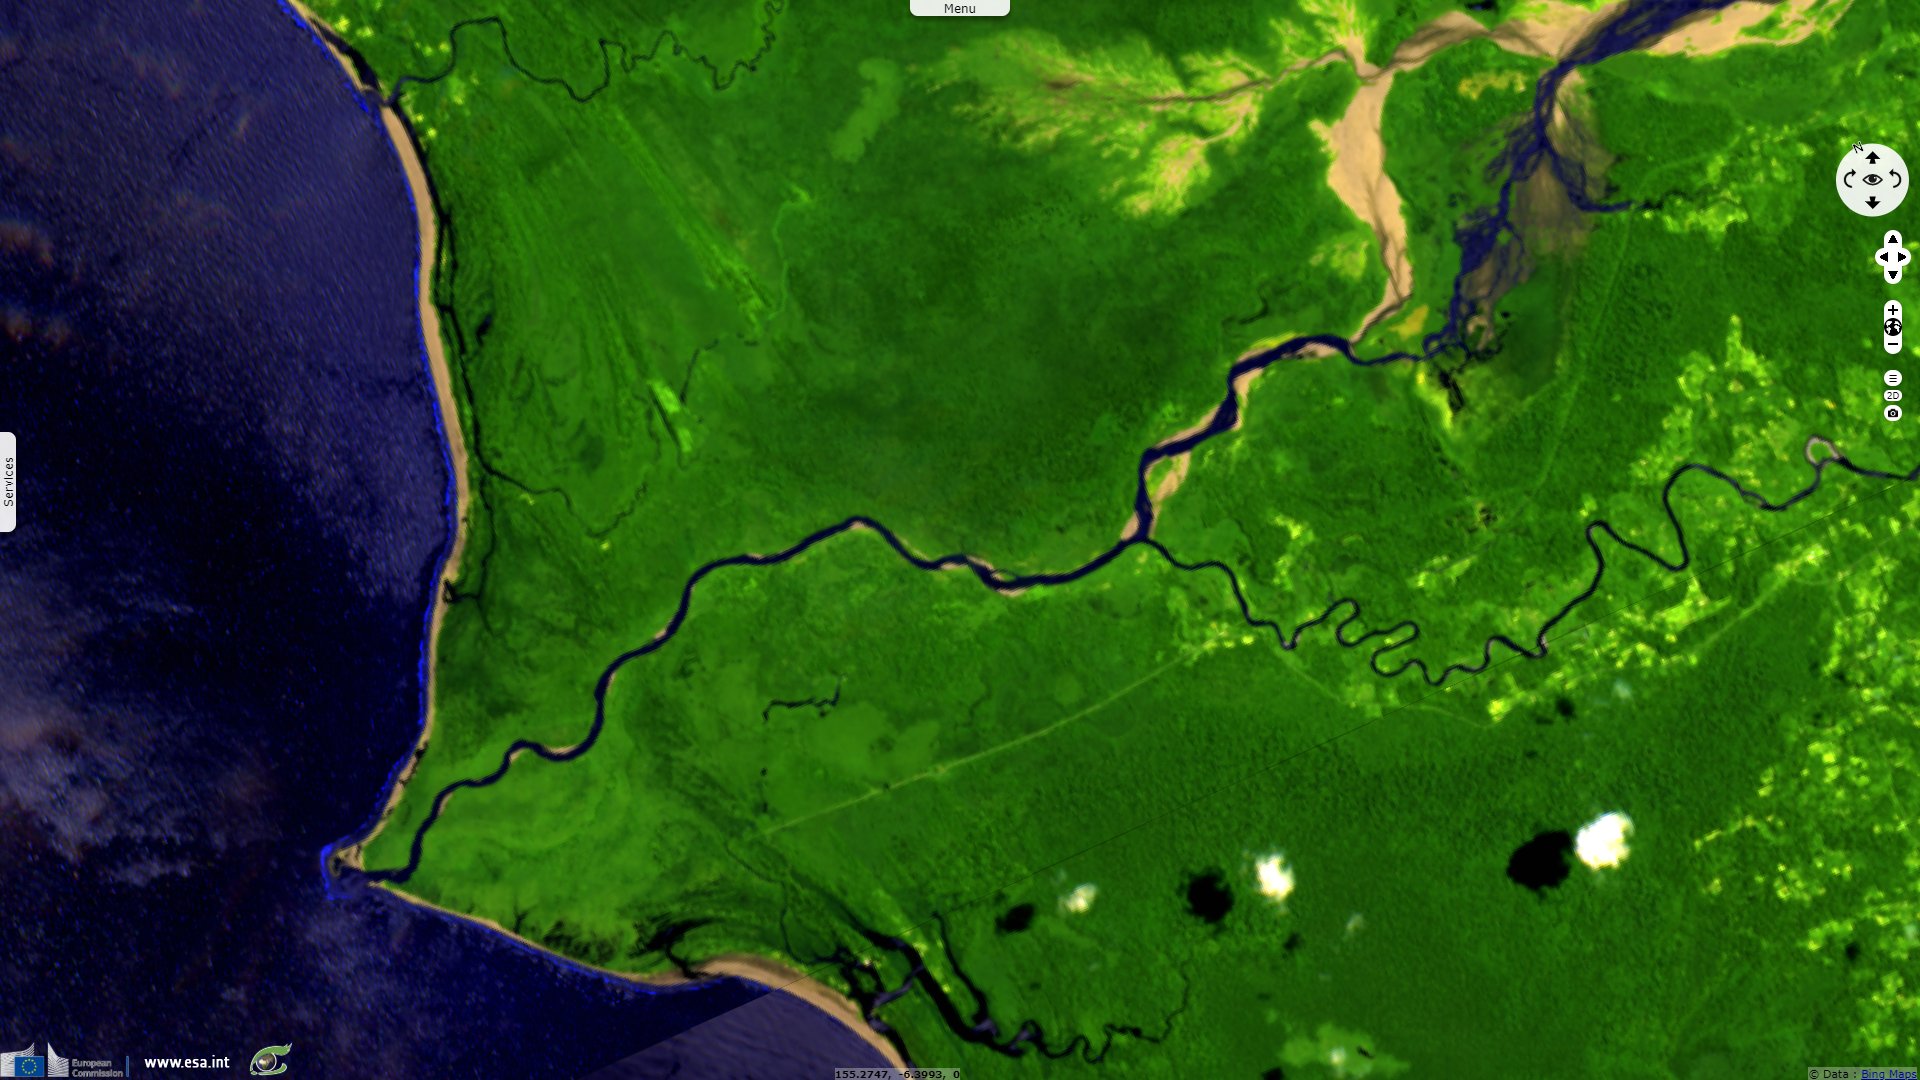
"Prior to 1972, the coast had only a modest mouth further north (155.21°E 6.36°S) based on historical Global Self-consistent, Hierarchical, High-resolution Shorelines (GSHHG) data. The formation of the neo delta is visible in the Landsat TM 1993 image with a semi-circular shape. While retaining a surface area of 8 km² of the same order, it takes on a triangular shape as early as 2001 (Landsat TM 2001) and hardly changes until 2020 (Sentinel-2A MSI 2020)."
"This indicative chronology demonstrates that the hydrogeomorphological dynamics downstream of the mine keeps on going up to the present day, well after its closure. It takes the form of gullies and changes in the course of the river, while the coastal and deltaic zone appears to have stabilized since 2001.
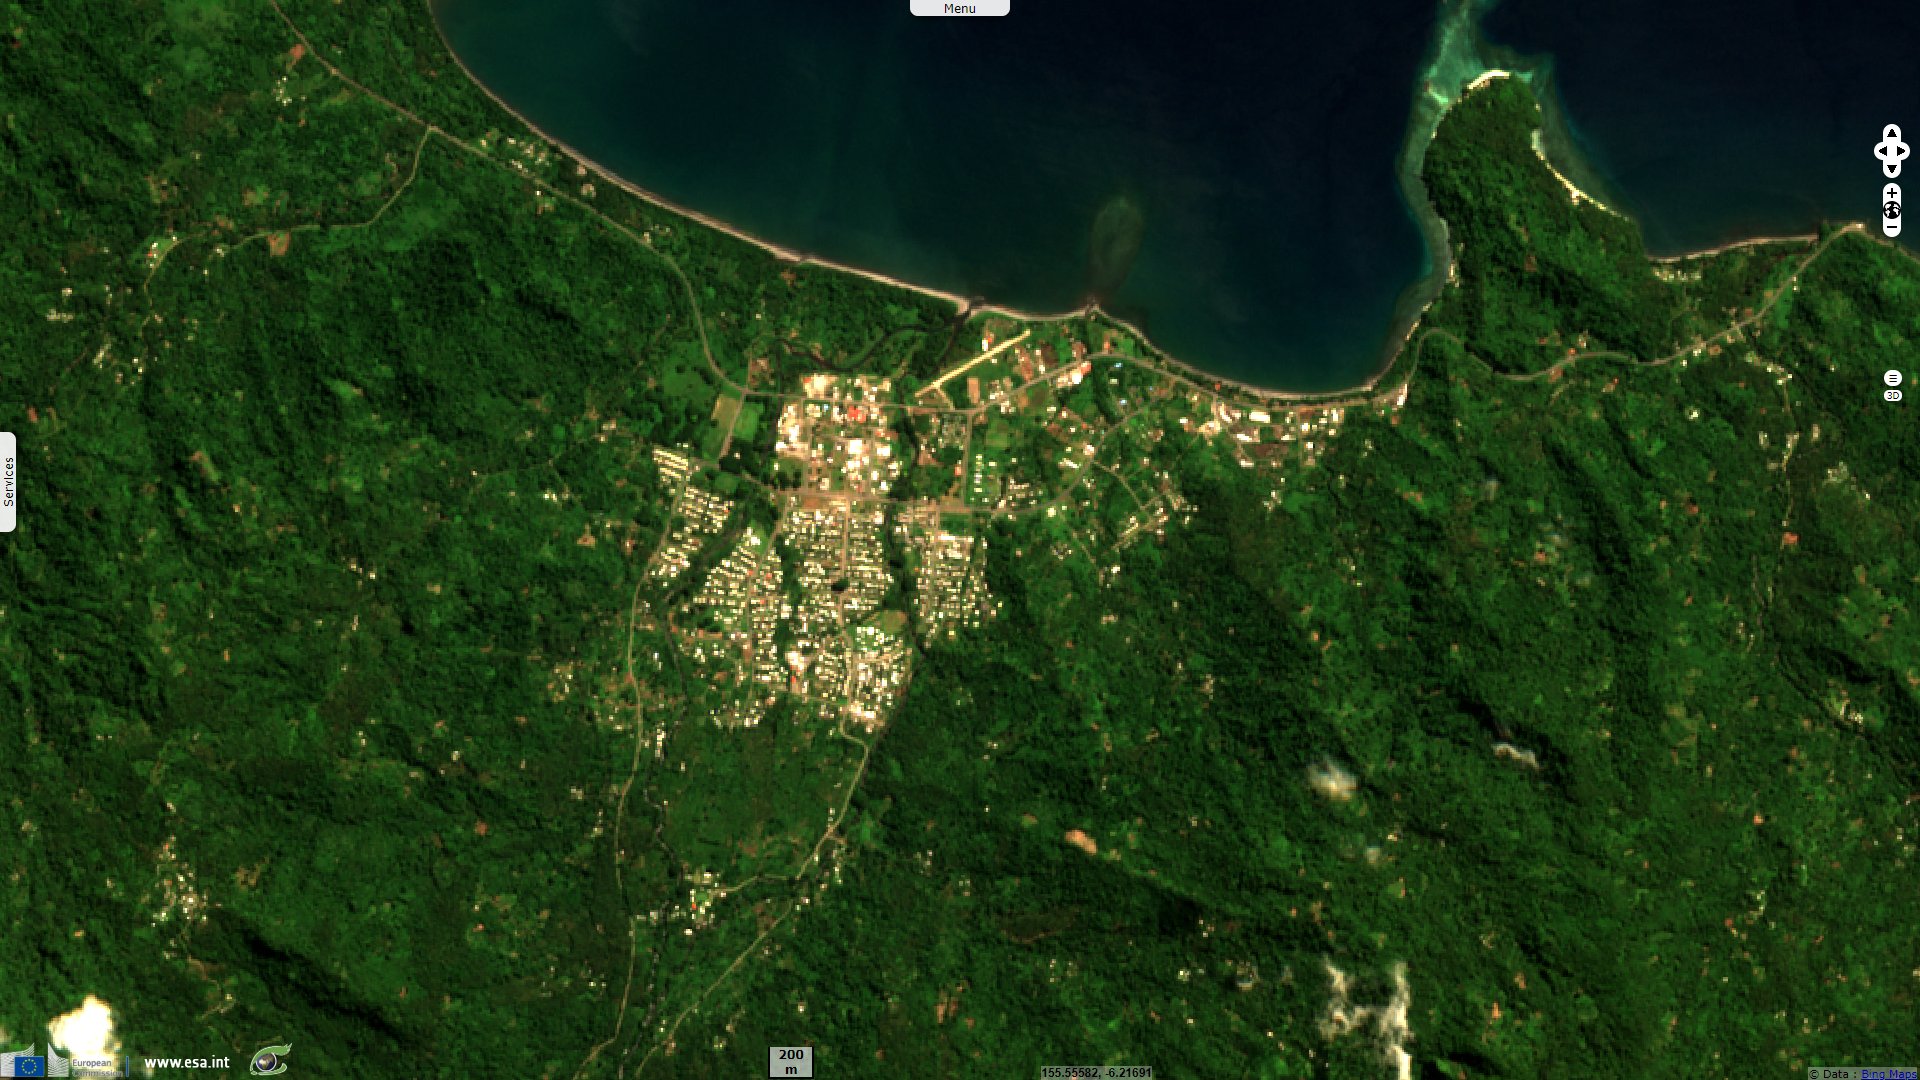
In addition to these visible impacts, the river has of course become azoic due to the disturbance of river ecosystems, the load of suspended matter and heavy metals. As for the seagrass beds and corals in Princess Augusta Bay, they have probably disappeared for the same reasons. Besides these environmental impacts, there are also the health and economic consequences for farming and fishing villages in the catchment area, in particular along the coastal area."
"The mine became a major economic issue for the newly independent country of PNG in 1975 and led to a war between the government of Port Moresby and the people of Bougainville, resulting in 20,000 deaths between 1989 and 2001. The scars left on the landscape are thus compounded by those of a Melanesian society traumatised by the cultural impact of the mine and the resulting war. One of the non-political demands of the Bougainville Revolutionary Army was and remains the permanent closure of the mine. It is likely that this will be the case in the context of the forthcoming full independence of the island. The example of the "mining" island of Bougainville could be summed up as follows: traces in the landscape but also in the minds."
The views expressed herein can in no way be taken to reflect the official opinion of the European Space Agency or the European Union.
Contains modified Copernicus Sentinel data 2026, processed by VisioTerra.
Contains modified Copernicus Sentinel data 2026, processed by VisioTerra.
| More on European Commission space: |  |
 |
 |
||||
| More on ESA: | |
|
|
S-1 website | S-2 website | S-3 website | |
| More on Copernicus program: | |
|
|
Scihub portal | Cophub portal | Inthub portal | Colhub portal |
| More on VisioTerra: | |
|
|
Sentinel Vision Portal | Envisat+ERS portal | Swarm+GOCE portal | CryoSat portal |