Natural Resources & Food Security in East Africa
Sentinel-2 MSI acquired on 02 July 2019 at 08:06:19 UTC
Keyword(s): Vegetation, agriculture, forestry, security, precipitation, rainfall, fire, Uganda, Sudan, South Sudan, Burundi
"ICPAC (IGAD Climate Prediction and Applications Centre) is one of the regional organisations across Africa leading the implementation of the GMES & Africa Programme across the continent. This consortium has been tasked to monitor several types of land."
The natural monitoring service provides "routine assessment tools on the state of natural habitats in IGAD Protected Areas (PA), to support conservation policies and sustainable management of PA. Monitor and assess the state of natural habitats at various levels to support decision making process. Many natural habitats in Africa are under threat mainly due to anthropogenic processes that cause habitat change, climate change, invasive species appearances, natural resource overexploitation and encroachments, and water and land pollution."
The Tropical Forest service promotes and supports "the use of Earth Observation and Geo-information technologies in tropical forest monitoring. Enhancing forest surveillance means actors can detect change, classify the changes and quantify the change to manage forests as a natural resource. Improved decision making comes when conservation actors and planners have tools and statics for assessment and trends."
The agriculture service "aims to provide tools, data and value-added information for monthly, seasonal and inter-annual agriculture monitoring. Monitor and assess crop conditions, predict food production and potential yield to provide timely early warning information to decision makers and stakeholders. The service provides additional migratory and invasive pests monitoring and assesses impacts to crops."
The rangeland service "provides tools, data and value added information for monthly, seasonal and inter-annual rangelands monitoring. It monitors and assesses pasture conditions, forecast fodder balance and livestock carrying cap"
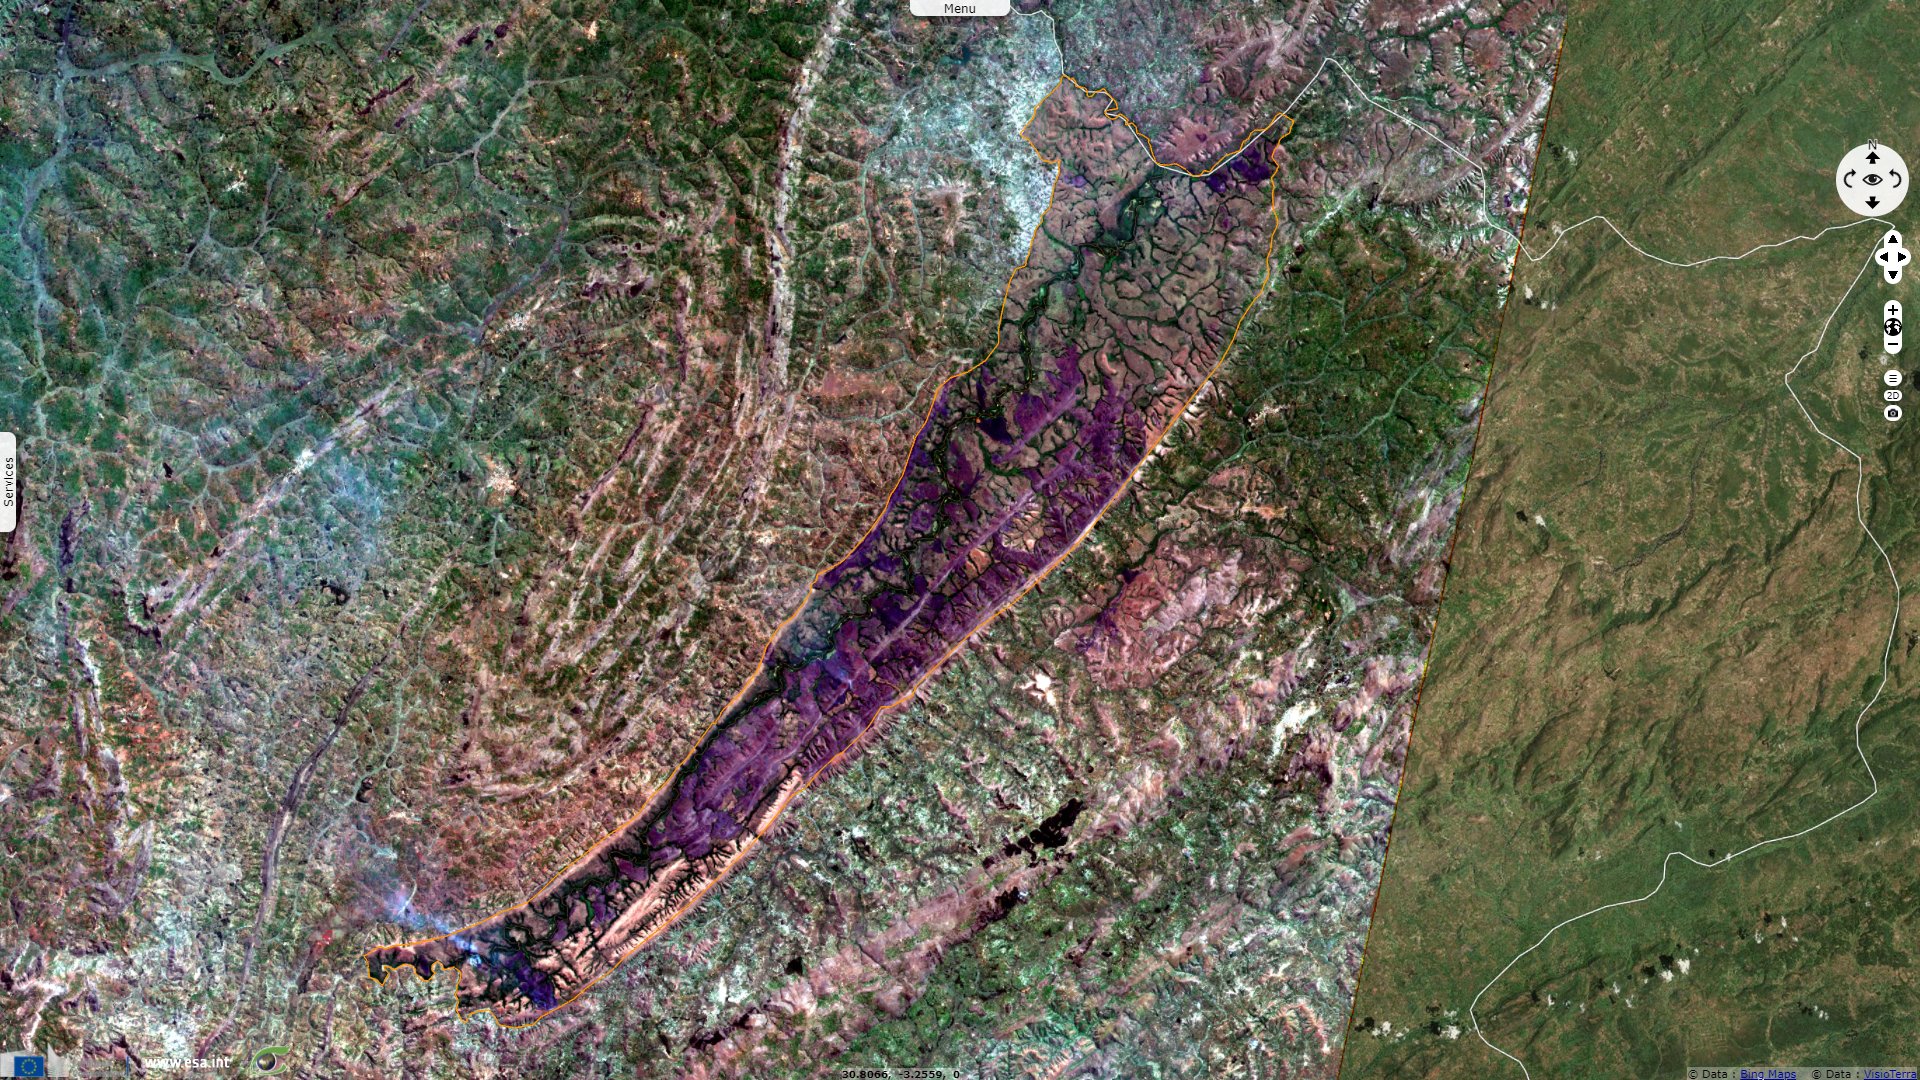
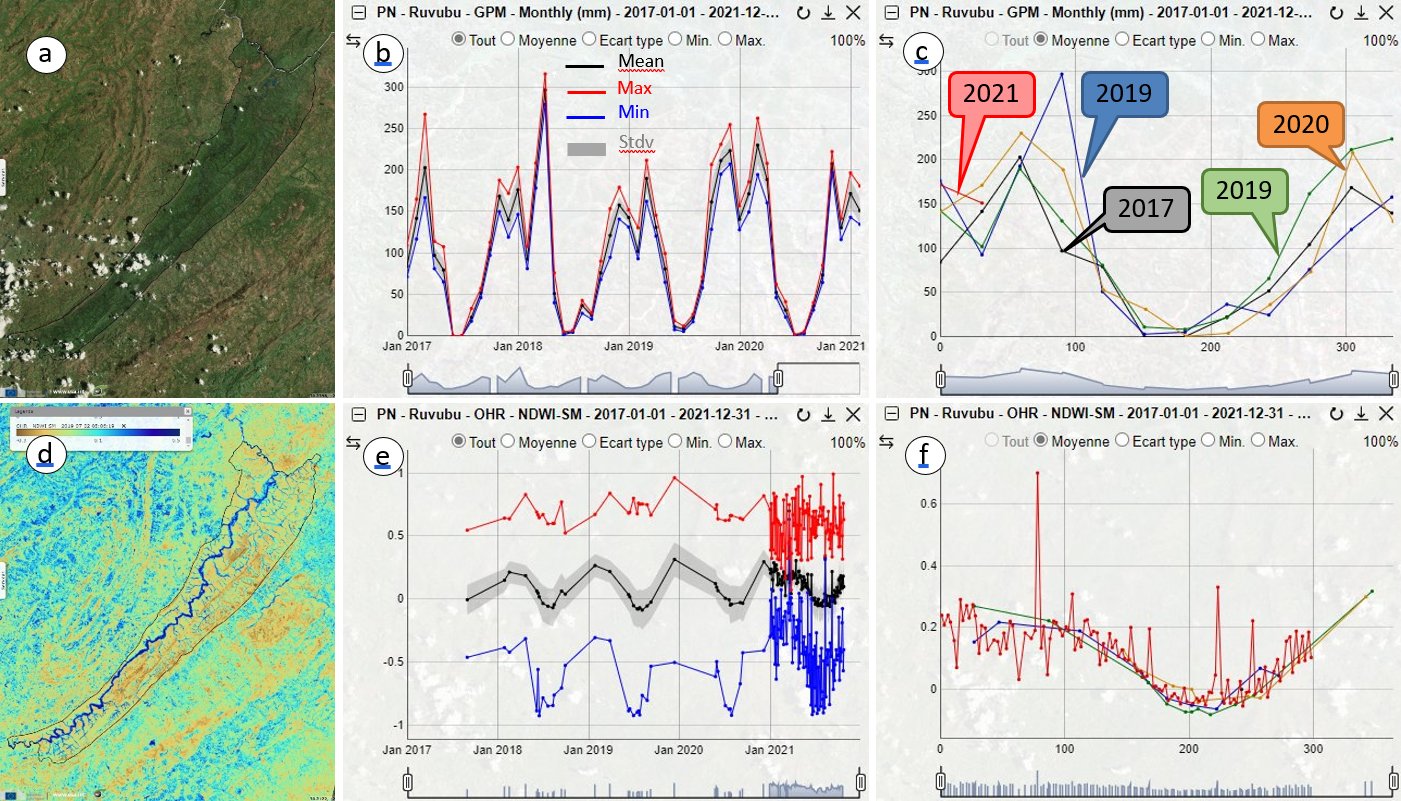
Time series analysis performed over Ruvubu National Park using precipitations and a Sentinel-2 soil moisture index.
a: High resolution image showing Ruvubu National Park, in the eastern part of Burundi.
b: GPM monthly precipitations time series calculated over the parcel from 2017 to 2021, chronological view.
c: GPM monthly precipitations time series calculated over the parcel from 2017 to 2021, seasonal view.
d: Normalized Difference Water Index - Soil moisture (NDWI-SM) calculated from Sentinel-2 image acquired on 02.07.2019 over Ruvubu National Park.
e: NDWI-SM time series calculated over the parcel from 2017 to 2021, chronological view.
f: NDWI-SM time series calculated over the parcel from 2017 to 2021, seasonal view.
In addition to monitor vegetation along time, the CAWFS software developed by Africa EO Services also makes use of time series to assess wildfires and burnt areas along time. This example shows the soil moisture curve correlates well with the precipitations. Most precipitations happen between October and February (c) while the driest months are from May to August, with almost no precipitations in June and up to 200 mm a month during the rainy season. The soil moisture index is slightly delayed compared with precipitations. It hits its maximum around December – January and drops to its minimum in July. Unlike other years where temporal sampling frequency was more sparce, almost all Sentinel-2 acquisitions have been sampled between January and October 2021. It explains the many small oscillations.
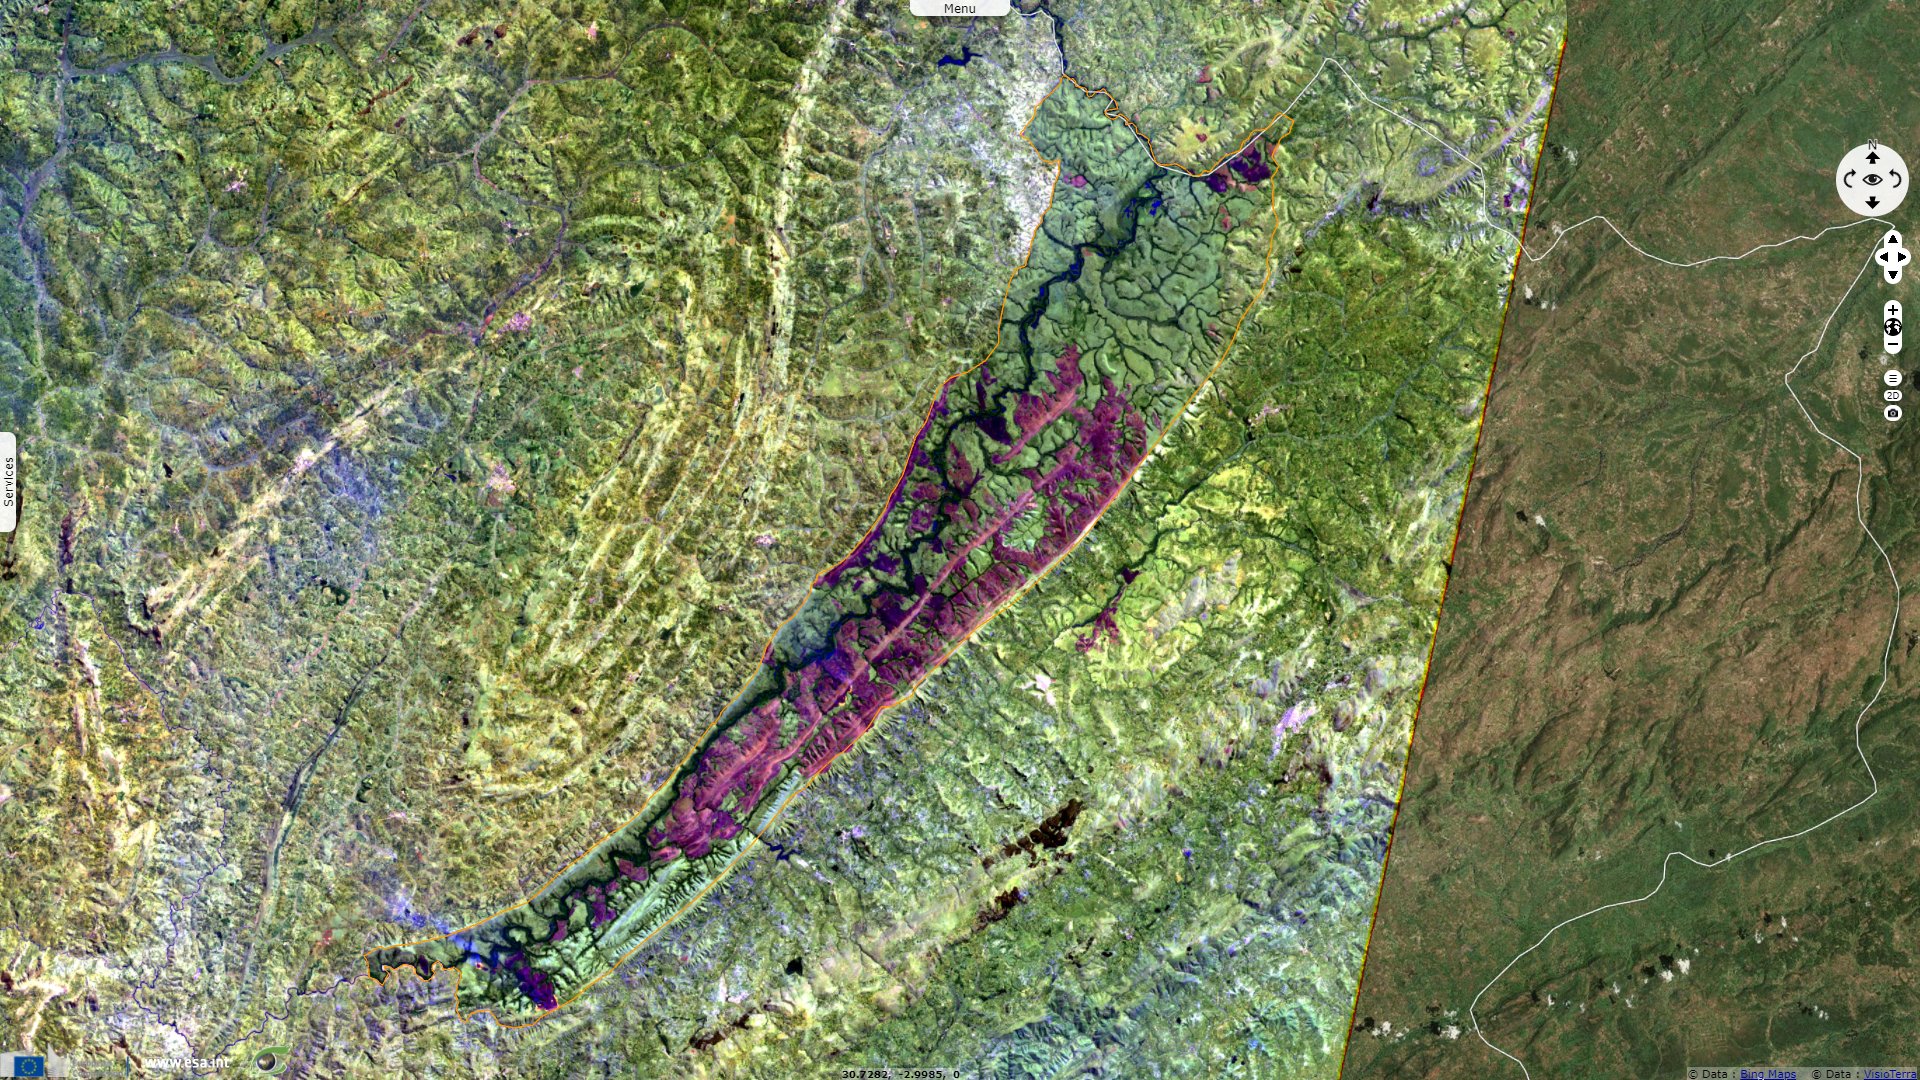
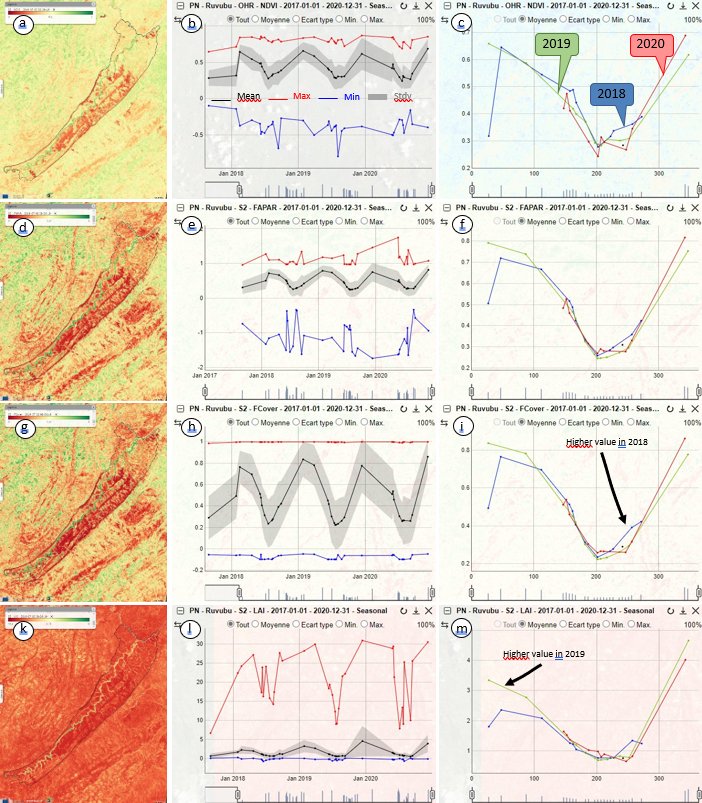
Time series analysis performed over Ruvubu National Park in Burundi using precipitations and Sentinel-2 vegetation indices.
a: Normalized Difference Vegetation Index (NDVI) computed from Sentinel-2 image acquired on 02.07.2019 over Ruvubu National Park.
b: NDVI time series computed over the parcel from 2018 to 2020, chronological view.
c: NDVI time series computed over the parcel from 2018 to 2020, seasonal view.
d: Fraction of Absorbed Photosynthetically Active Radiation (FAPAR) calculated from Sentinel-2 image acquired on 02.07.2019 over Ruvubu National Park.
e: FAPAR time series computed over the parcel from 2018 to 2020, chronological view.
f: FAPAR time series computed over the parcel from 2018 to 2020, seasonal view.
g: Fraction of green Vegetation Cover (FCover) calculated from Sentinel-2 image acquired on 02.07.2019 over Ruvubu computed Park.
h: FCover time series calculated over the parcel from 2018 to 2020, chronological view.
i: FCover time series computed over the parcel from 2018 to 2020, seasonal view.
k: Leaf Area Index (LAI) computed from Sentinel-2 image acquired on 02.07.2019 over Ruvubu National Park.
l: LAI time series computed over the parcel from 2018 to 2020, chronological view.
m: LAI time series computed over the parcel from 2018 to 2020, seasonal view.
Ruvubu National Park has a surface of 508 km² covered by 75% of savannah, 15% woodland, 8% grassland and 2% forest gallery around the Ruvubu river in particular. This heterogeneous land cover explains the maximum and minimum curves don’t follow the same trends as the mean (b), (e), (h) and (l). These four vegetation indices corroborate the soil moisture index, showing a common maximum period around December-January and reaching their minimal values in June-July. Year to year variation seems limited but the vegetation seems to have been slightly healthier in August 2018 than at the same period of 2019 and 2020. FAPAR, FCover and LAI show higher values in early 2019 than in 2018 and 2020 which is not corroborated by the NDVI.
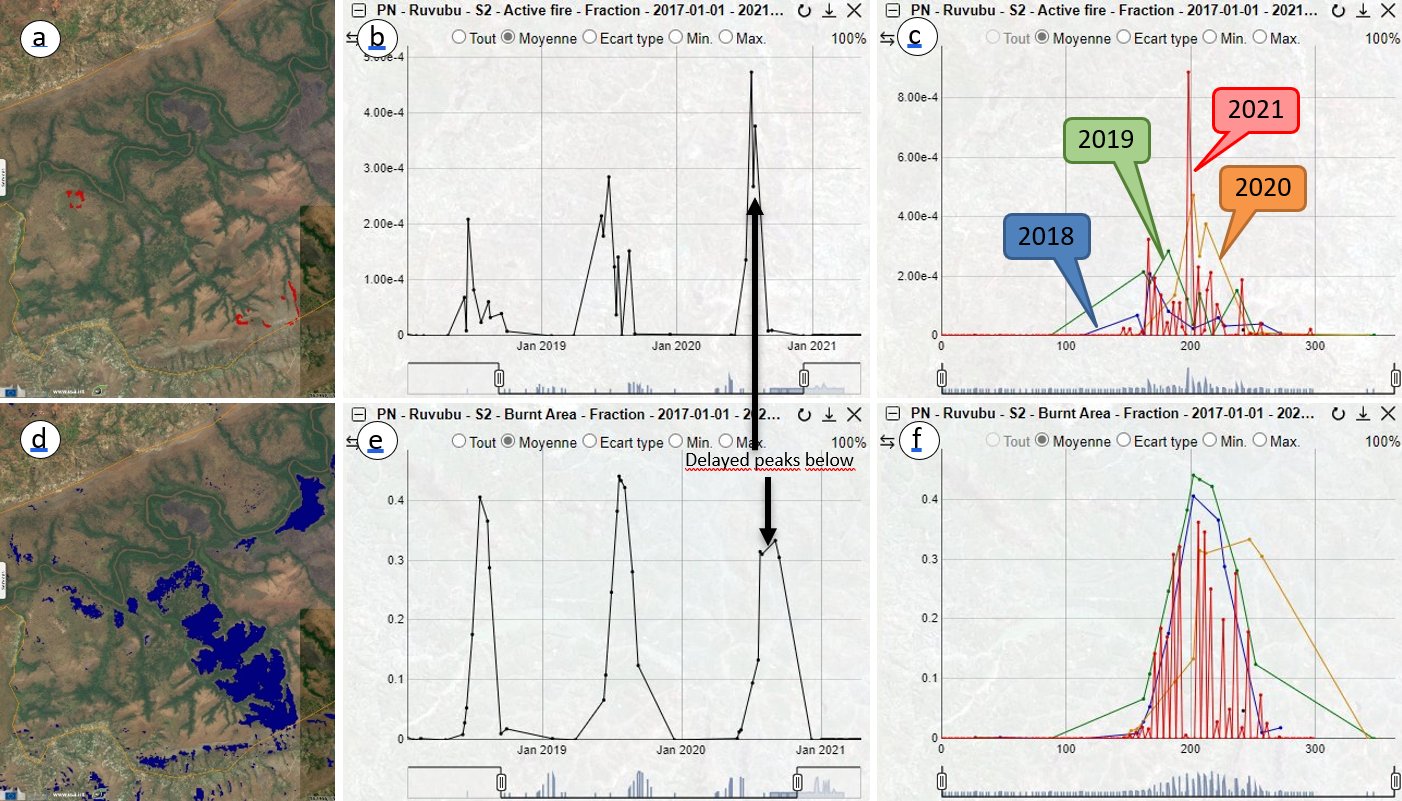
Time series analysis performed over Ruvubu National Park in Burundi using Sentinel-2 fire indices.
a: Zoom on the mask of the Active fire fraction calculated from Sentinel-2 image acquired on 02.07.2019 over Ruvubu National Park.
b: Active fire fraction time series calculated over the parcel from 2018 to 2020, chronological view.
c: Active fire fraction time series calculated over the parcel from 2018 to 2020, seasonal view.
d: Burnt Area fraction calculated from Sentinel-2 image acquired on 02.07.2019 over Ruvubu National Park.
e: Burnt Area fraction time series calculated over the parcel from 2018 to 2020, chronological view.
f: Burnt Area fraction time series calculated over the parcel from 2018 to 2020, seasonal view.
The Active fire fraction indicator computes the number of pixels where a fire front is visible out of the number of pixels in the Area of Interest (a), it borders Burnt areas (d), as expected. Its value (b) is smaller than that of the Burnt area fraction indicator (f) which that adds up during the dry season until rain increases enough to allow the vegetation to regenerate. By comparing the Active fire (b) and Burnt area (e), it can be seen the former reaches its apex a bit before the latter does. The surface burnt increases from mid-June, peaks between mid-July and mid-August and decreases later. The fire season is at its maximum when soil moisture and vegetation are at their minimum, all these extrema are slightly delayed compared to the period of minimal rain.
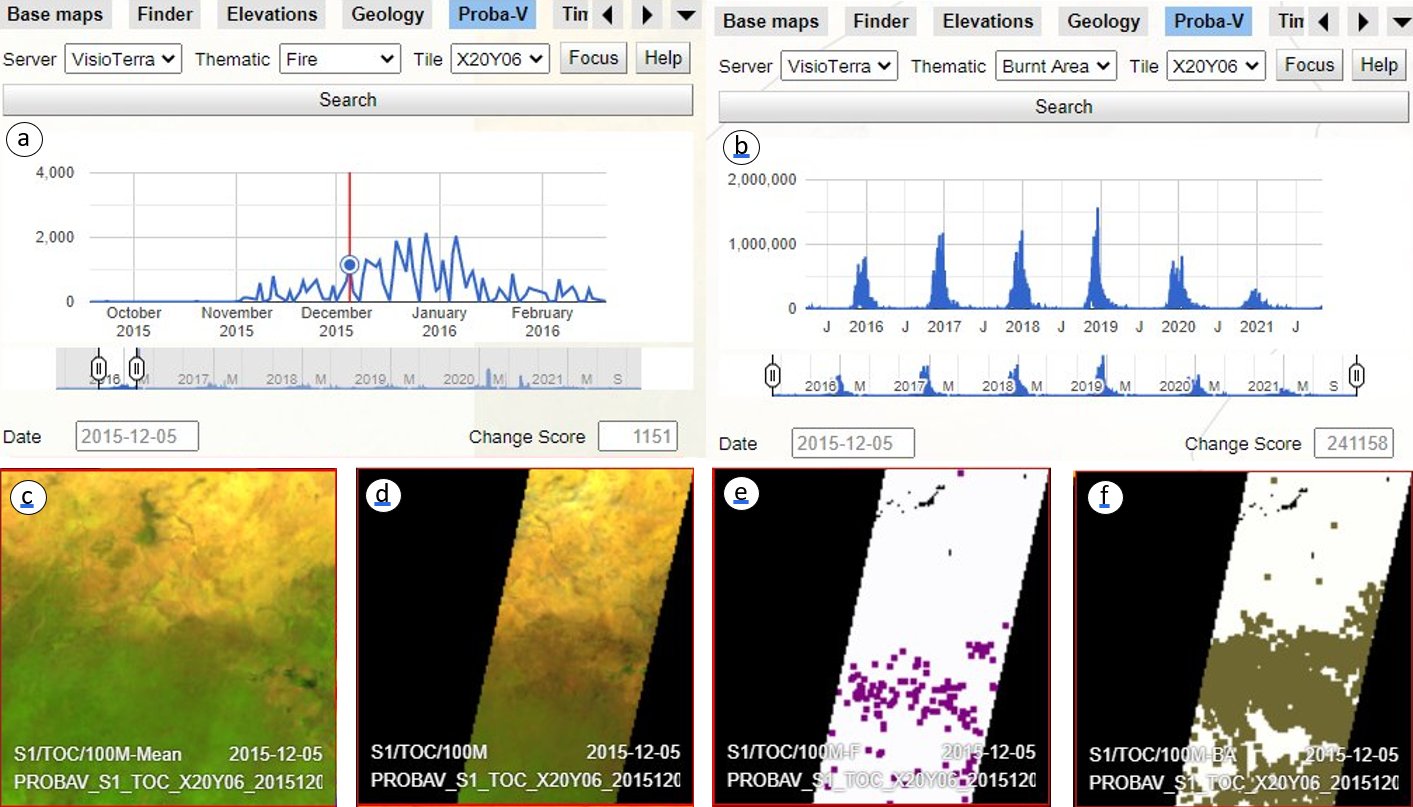
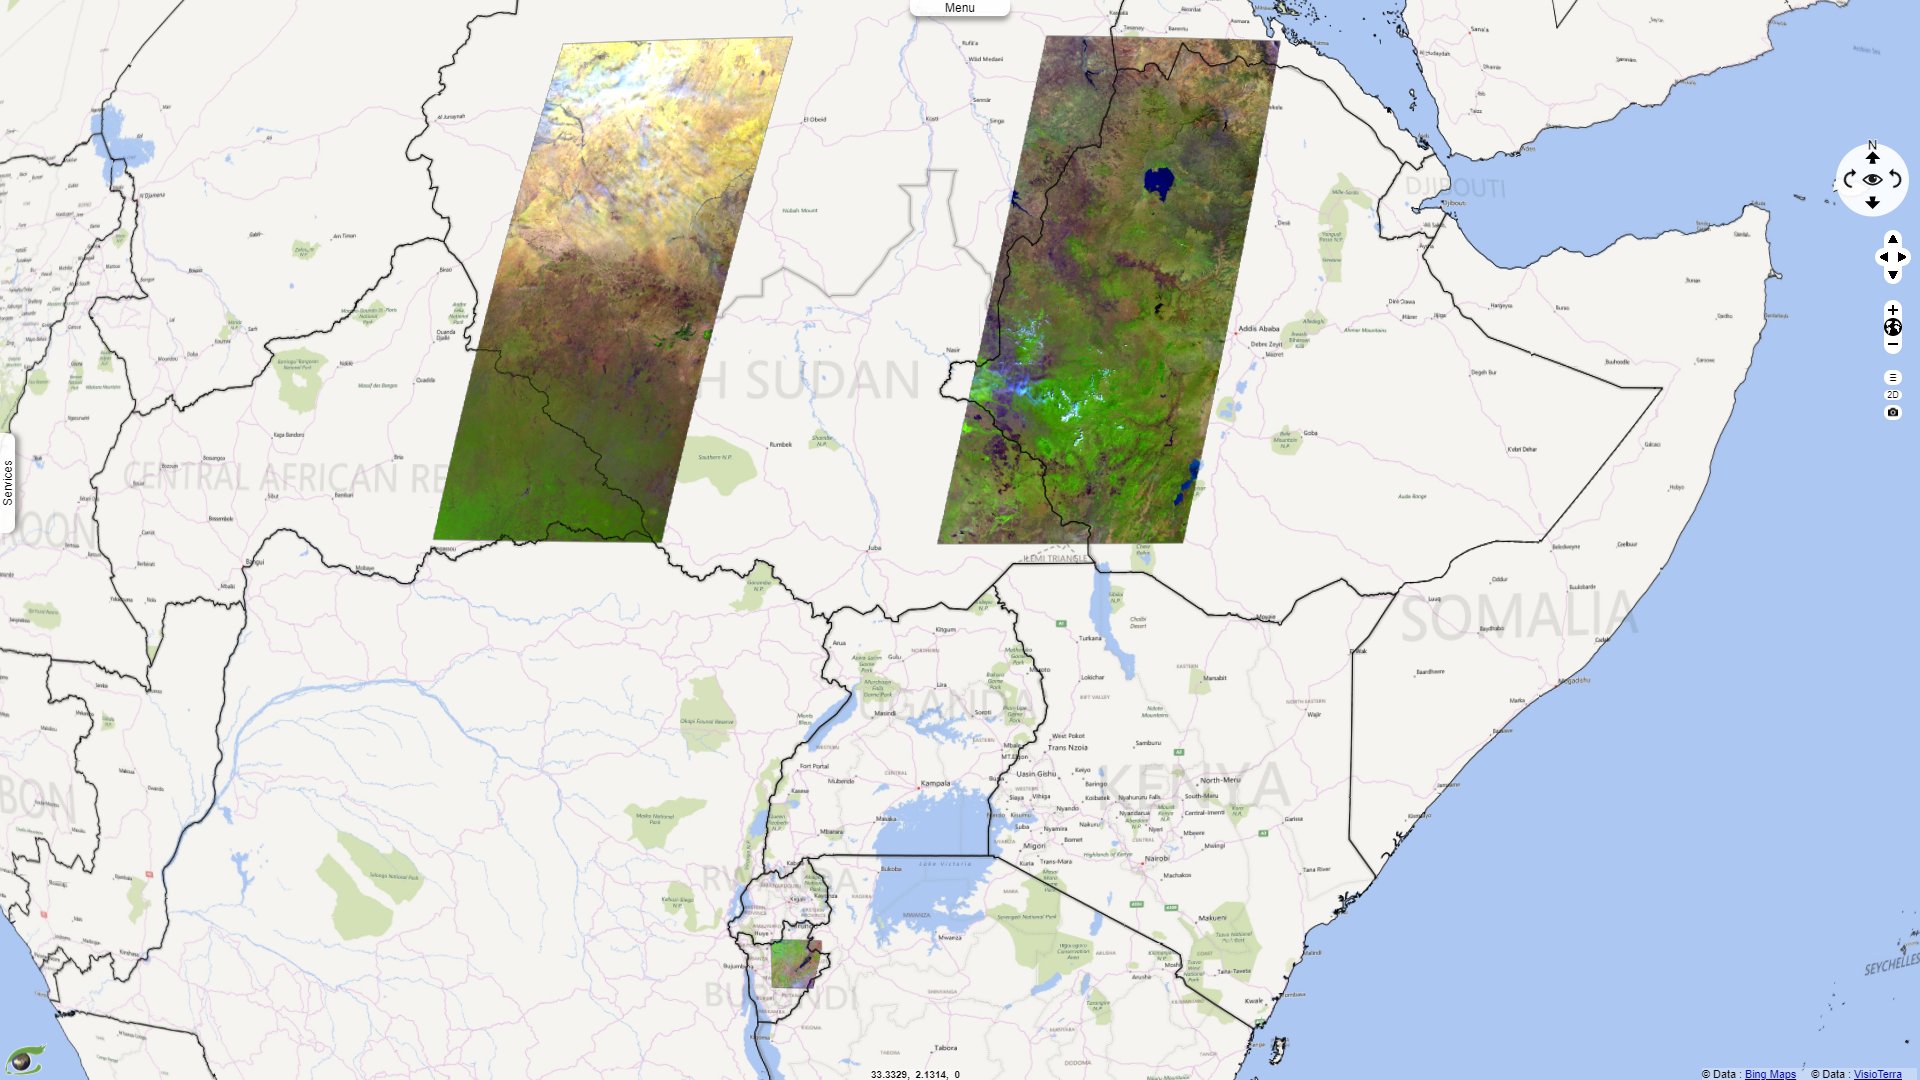
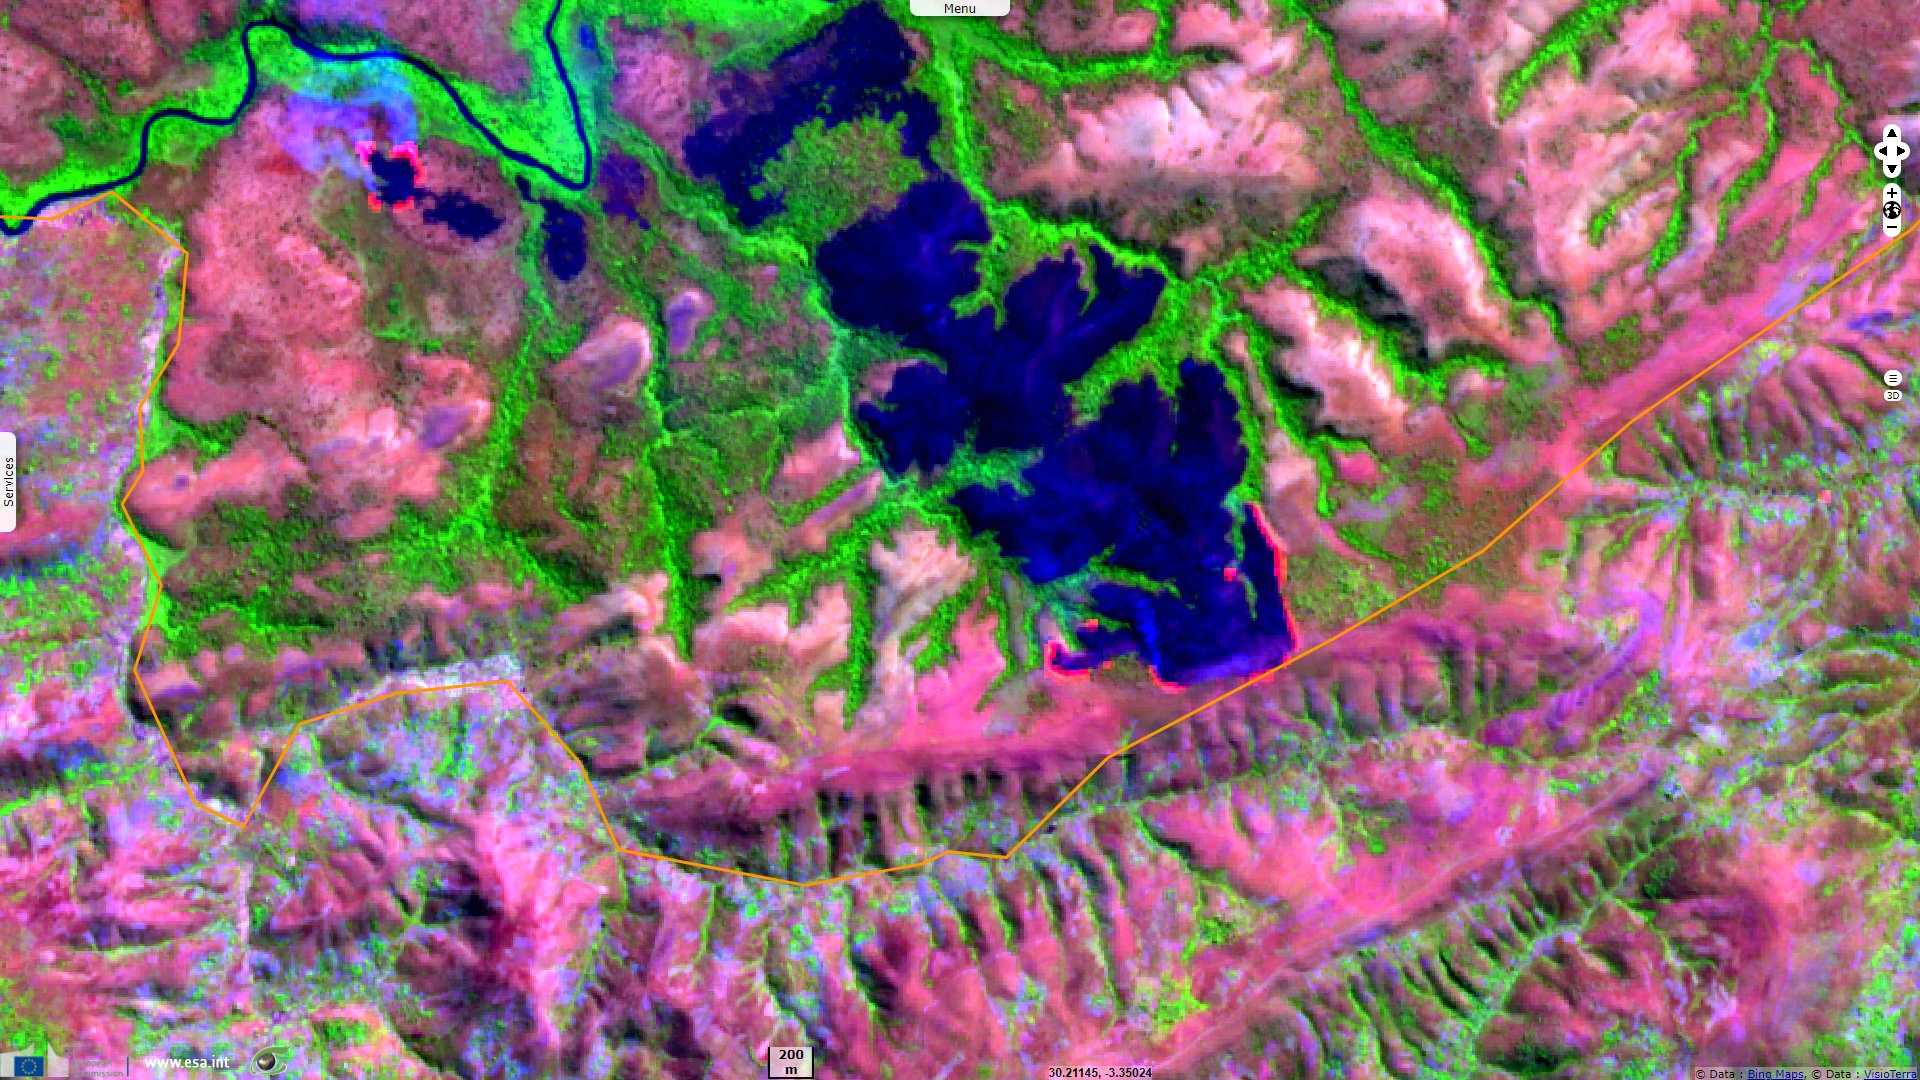
Time series analysis performed over a tile of interest located between Sudan and South Sudan using Proba-V fire indices.
a: Active fire index computed from single Proba-V tiles acquired over the tile of interest from 2015 to 2021.
b: Burnt area index computed from single Proba-V tiles acquired over the tile of interest from 2015 to 2021.
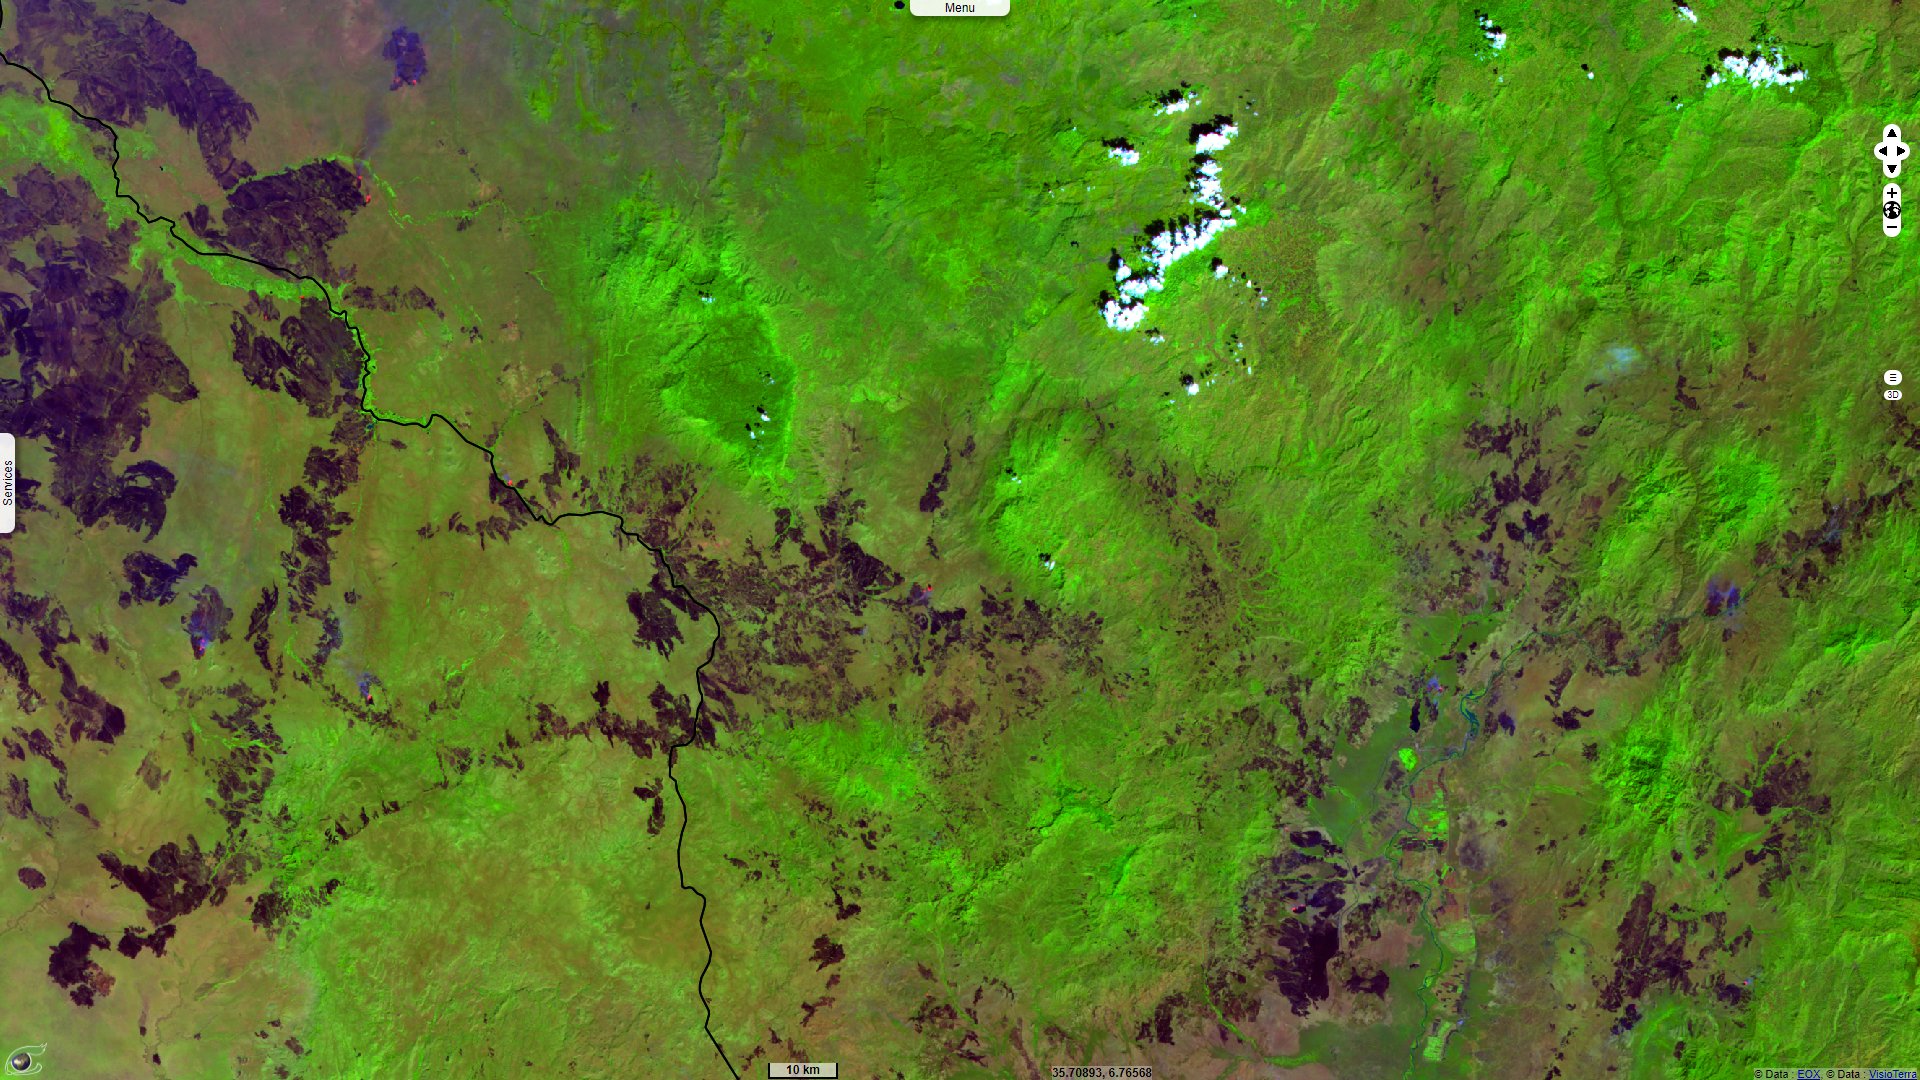
c: Mean of several tenths of Proba-V images acquired over the tile of interest before the 05 December 2015.
d: Proba-V image acquired over the tile of interest on 05 December 2015.
e: Mask of the active fire areas detected on 05 December 2015.
f: Mask of the burnt areas detected on 05 December 2015.
Proba-V has been used to monitor large areas of land, making use of its large swath and 100m pixel size. In addition of its task to assess vegetation, it has been tasked to detect wildfires and burnt areas. The image above comes from the VtProba-V service, a change detection engine developed by VisioTerra which computes pixels showing active fires along time (a) and burnt areas along time (b). By computing the difference between the bands of the image of the day and “the rolling mean” of these bands, one define a change index. This index together with other criteria are analysed in a decision tree to detect fires or burnt areas.
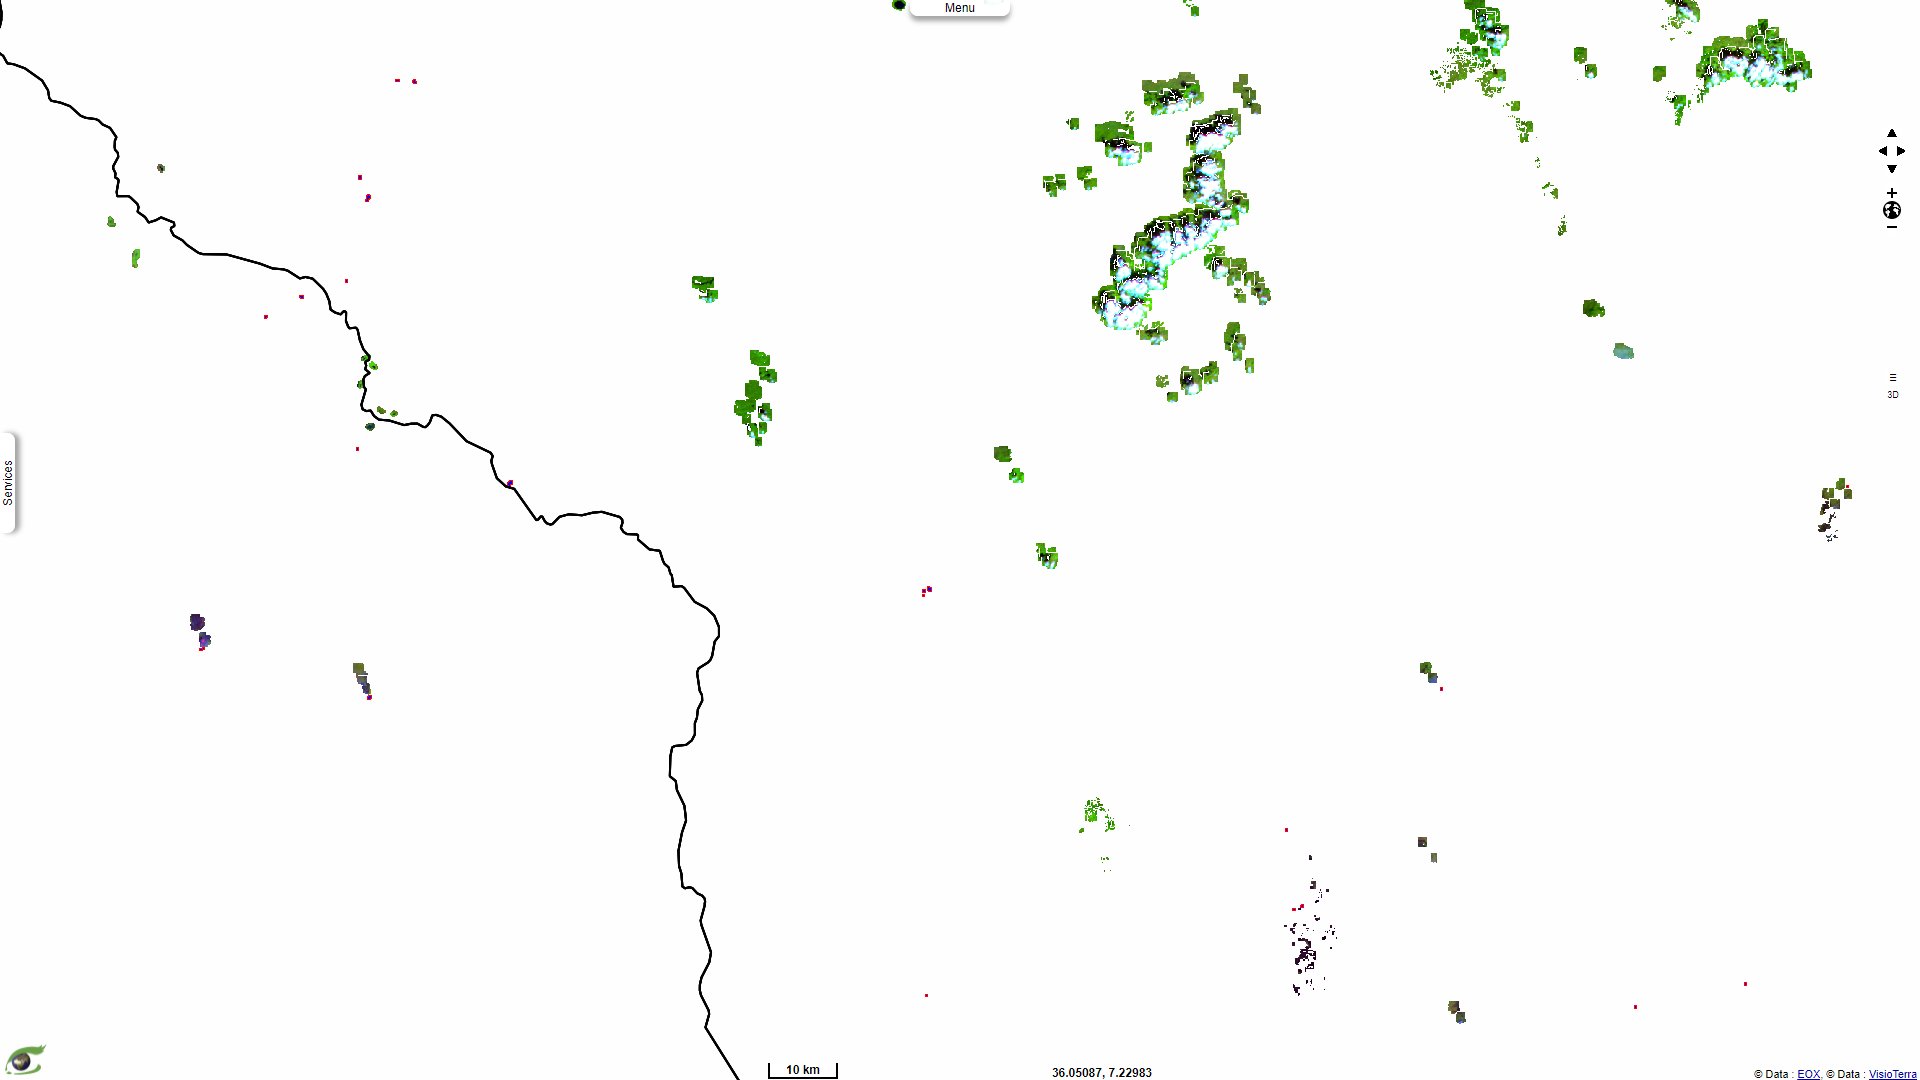
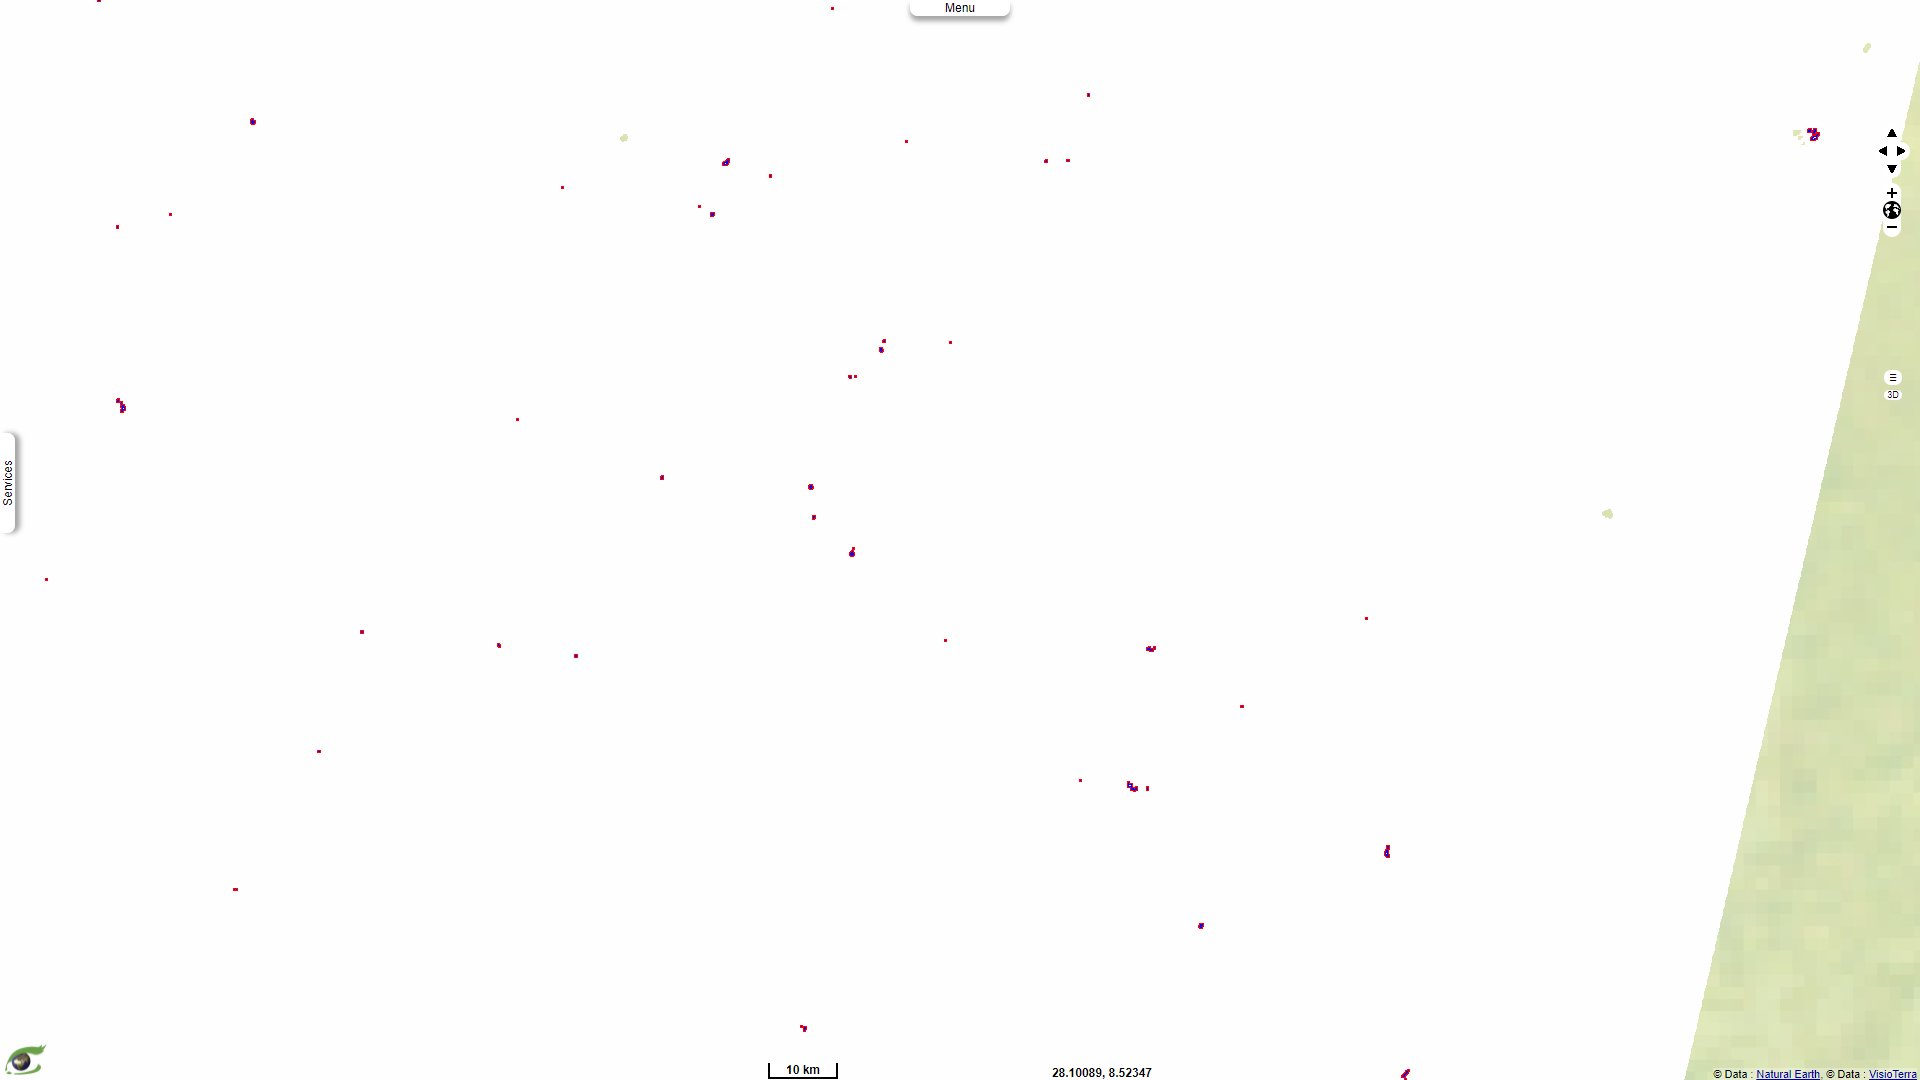
By selecting a time series dedicated to active fires, it shows a graph of the evolution of wildfire along time (a). By selecting a date on the graph, the corresponding mask of detected active fires shows (e). The fires occur mostly during December and January.
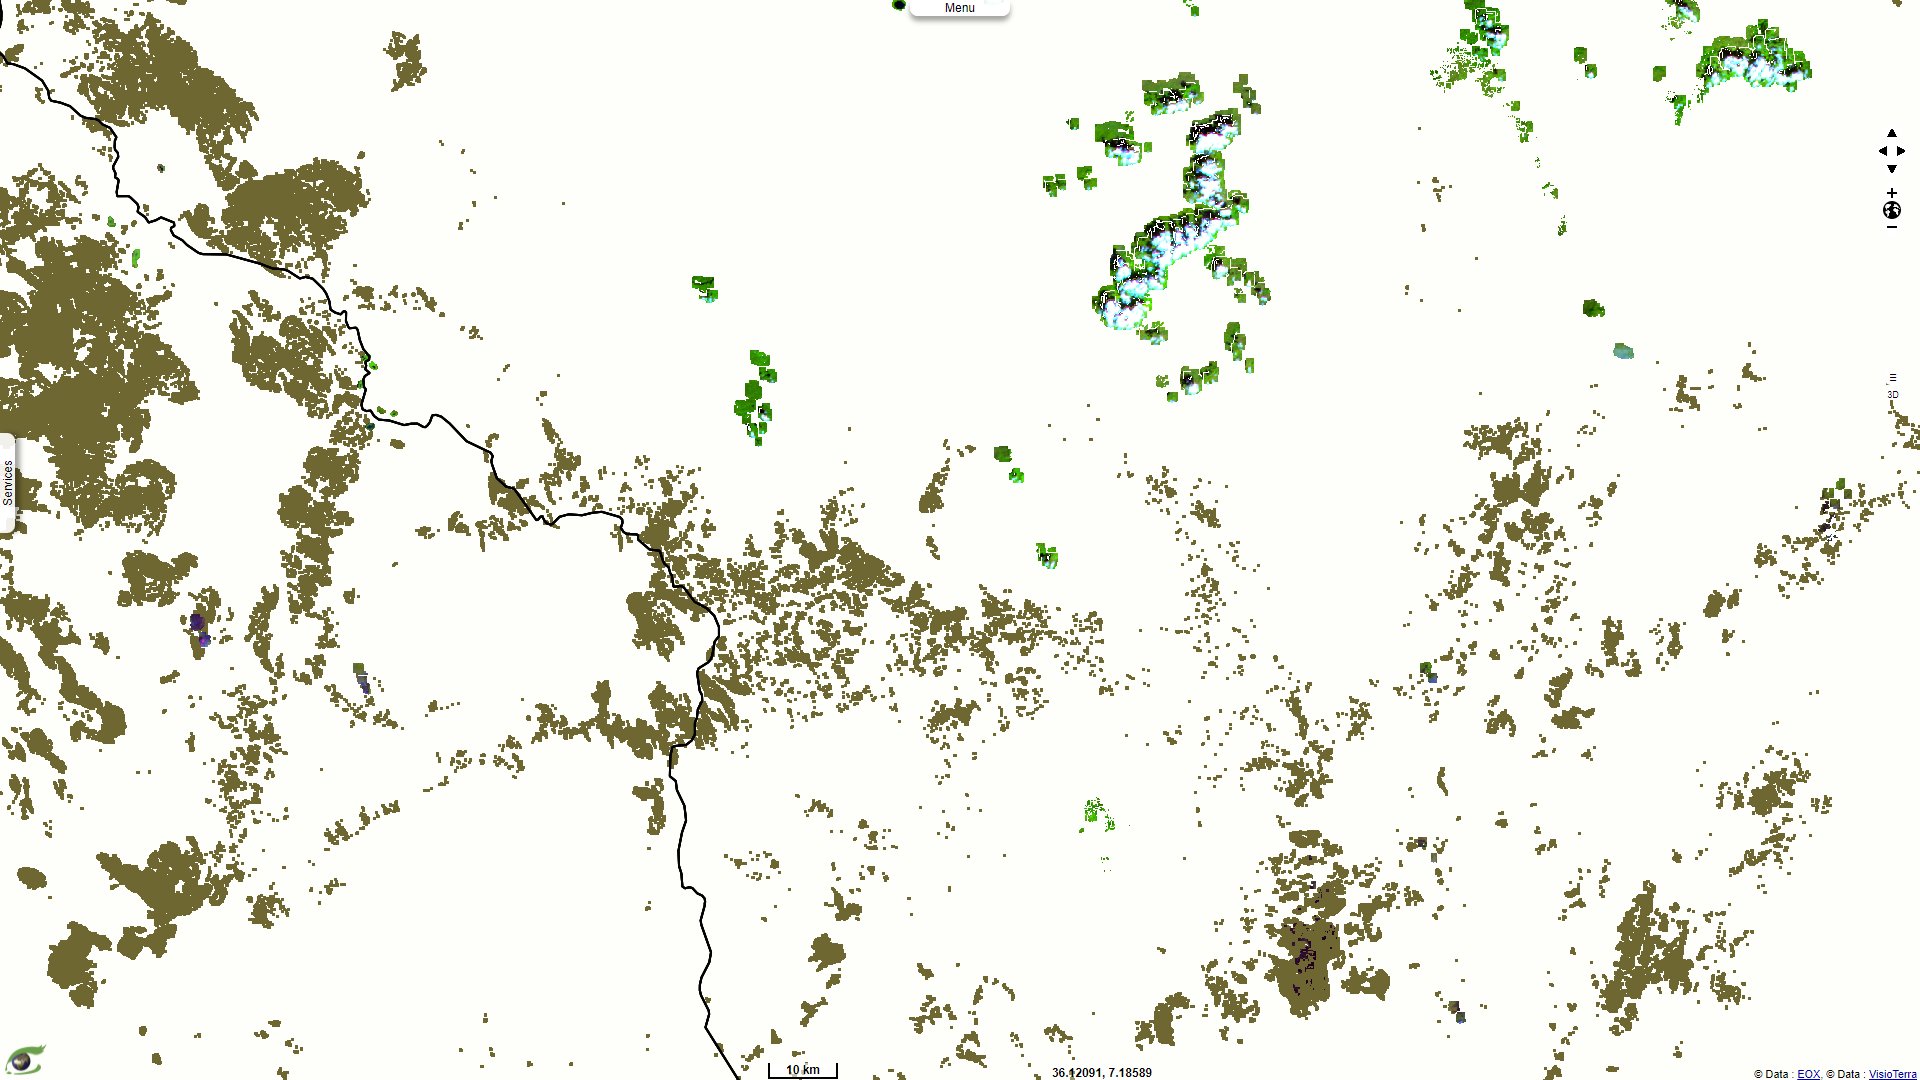
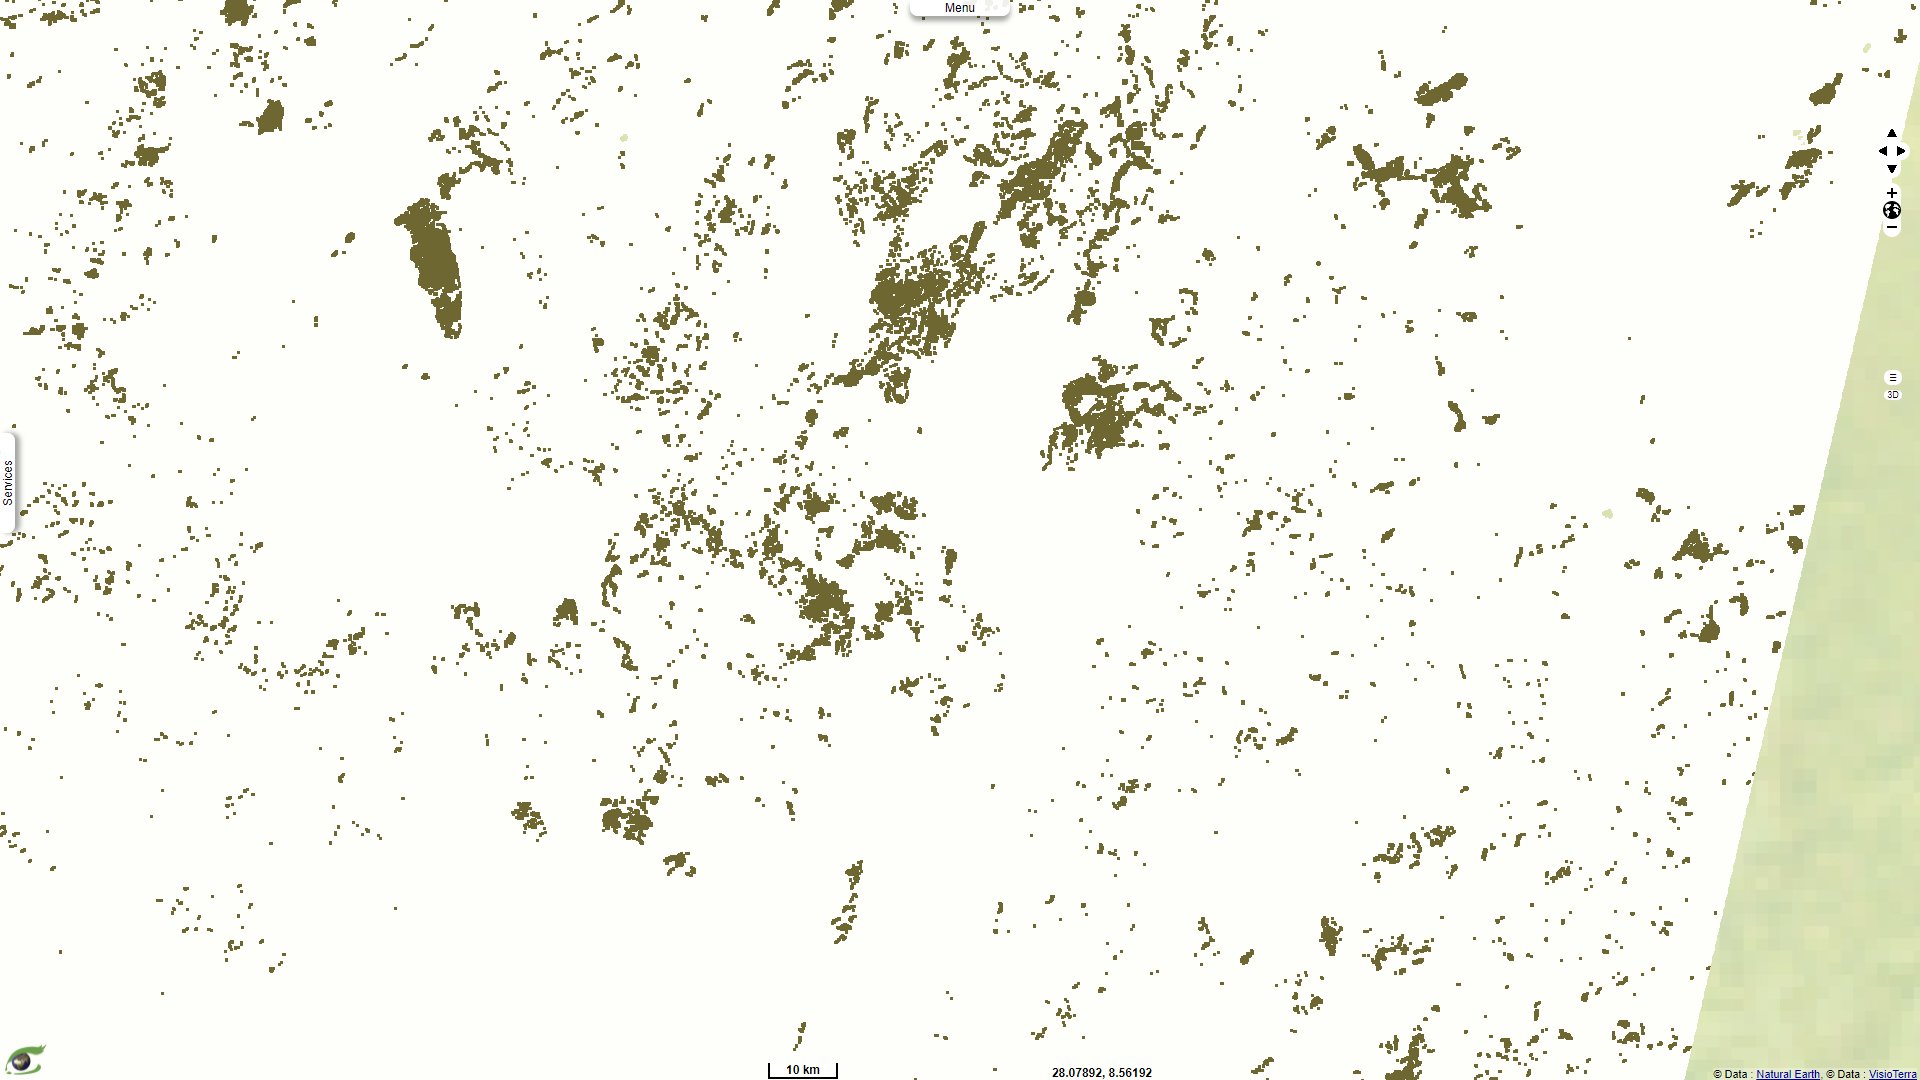
By selecting a time series dedicated to burnt areas, it shows a graph of their evolution along time (b). By selecting a date on the graph, the corresponding mask of detected burnt areas shows (f).
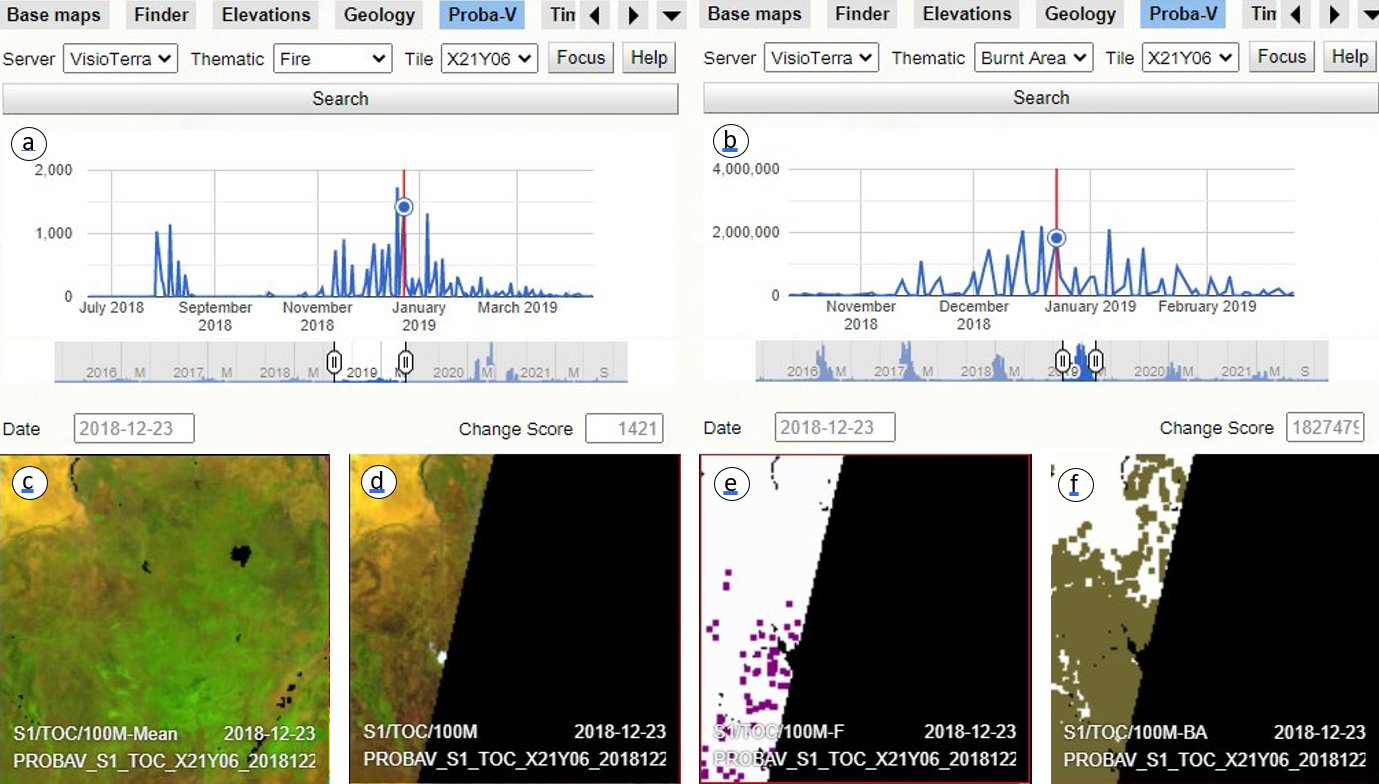
Time series analysis performed over a tile of interest located in Ethiopia using Proba-V fire indices.
a: Active fire index computed from single Proba-V tiles acquired over the tile of interest from 2015 to 2021.
b: Burnt area index computed from single Proba-V tiles acquired over the tile of interest from 2015 to 2021.
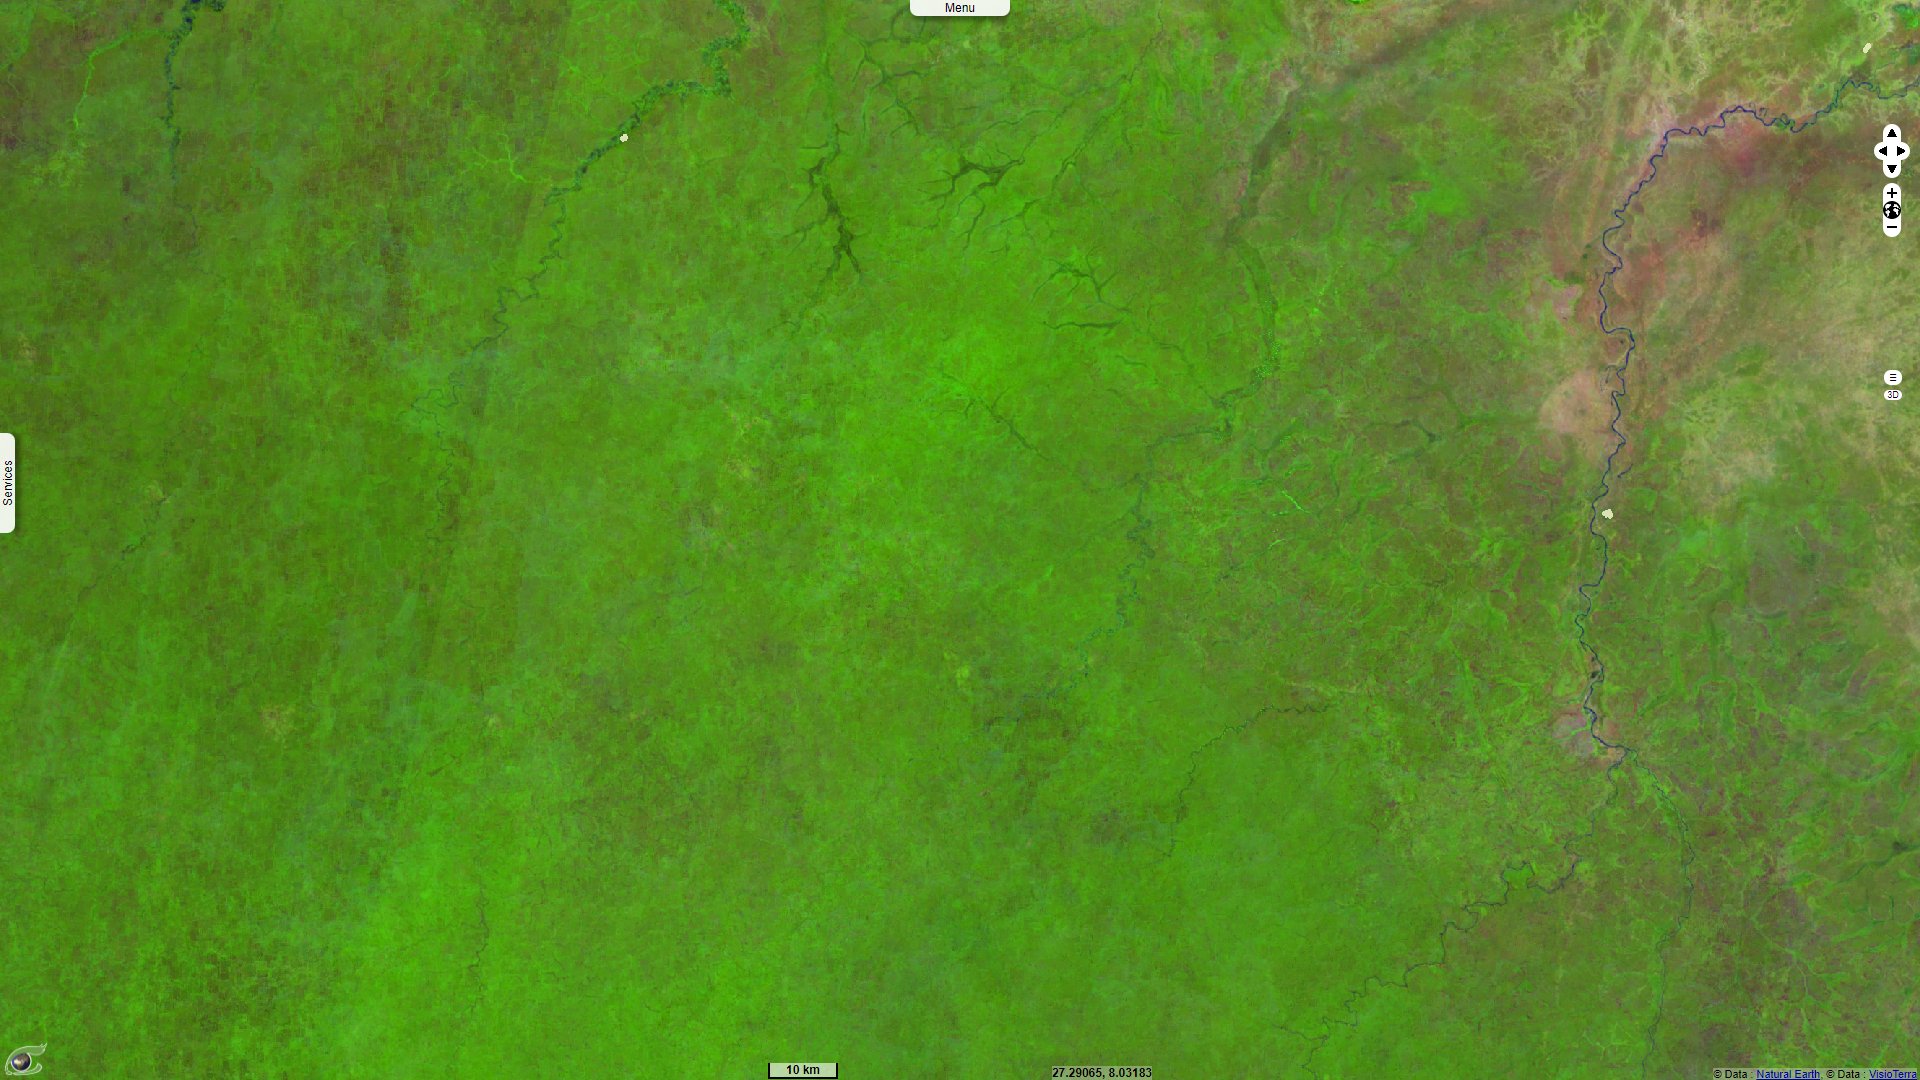
c: Mean of several tenths of Proba-V images acquired over the tile of interest before the 23 December 2018.
d: Proba-V image acquired over the tile of interest on 23 December 2018.
e: Mask of the active fire areas detected on 23 December 2018.
f: Mask of the burnt areas detected on 23 December 2018.
The views expressed herein can in no way be taken to reflect the official opinion of the European Space Agency or the European Union.
Contains modified Copernicus Sentinel data 2026, processed by VisioTerra.
Contains modified Copernicus Sentinel data 2026, processed by VisioTerra.
| More on European Commission space: |  |
 |
 |
||||
| More on ESA: | |
|
|
S-1 website | S-2 website | S-3 website | |
| More on Copernicus program: | |
|
|
Scihub portal | Cophub portal | Inthub portal | Colhub portal |
| More on VisioTerra: | |
|
|
Sentinel Vision Portal | Envisat+ERS portal | Swarm+GOCE portal | CryoSat portal |