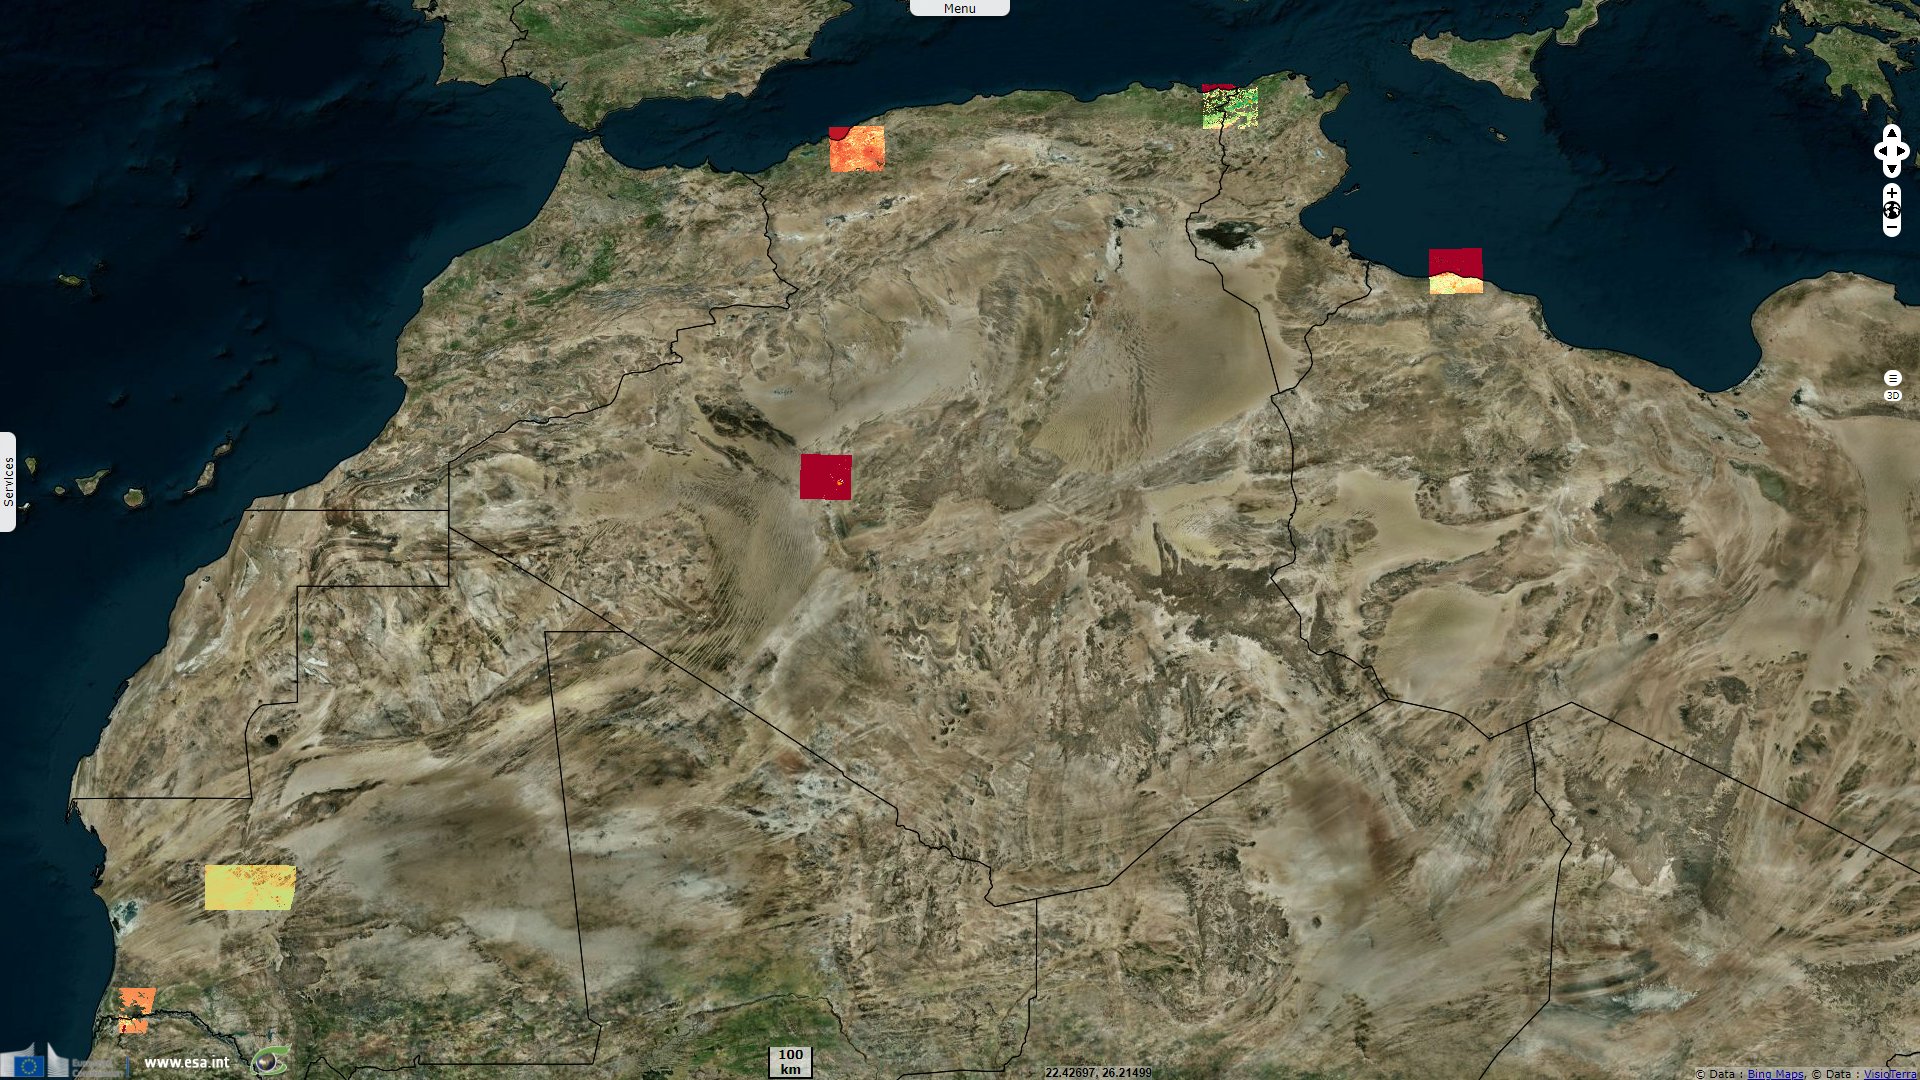
Sustainable Land and Water Management in North Africa
Sentinel-2 MSI acquired on 09 February 2018 at 11:22:21 UTC
Sentinel-2 MSI acquired on 29 March 2019 at 10:40:29 UTC
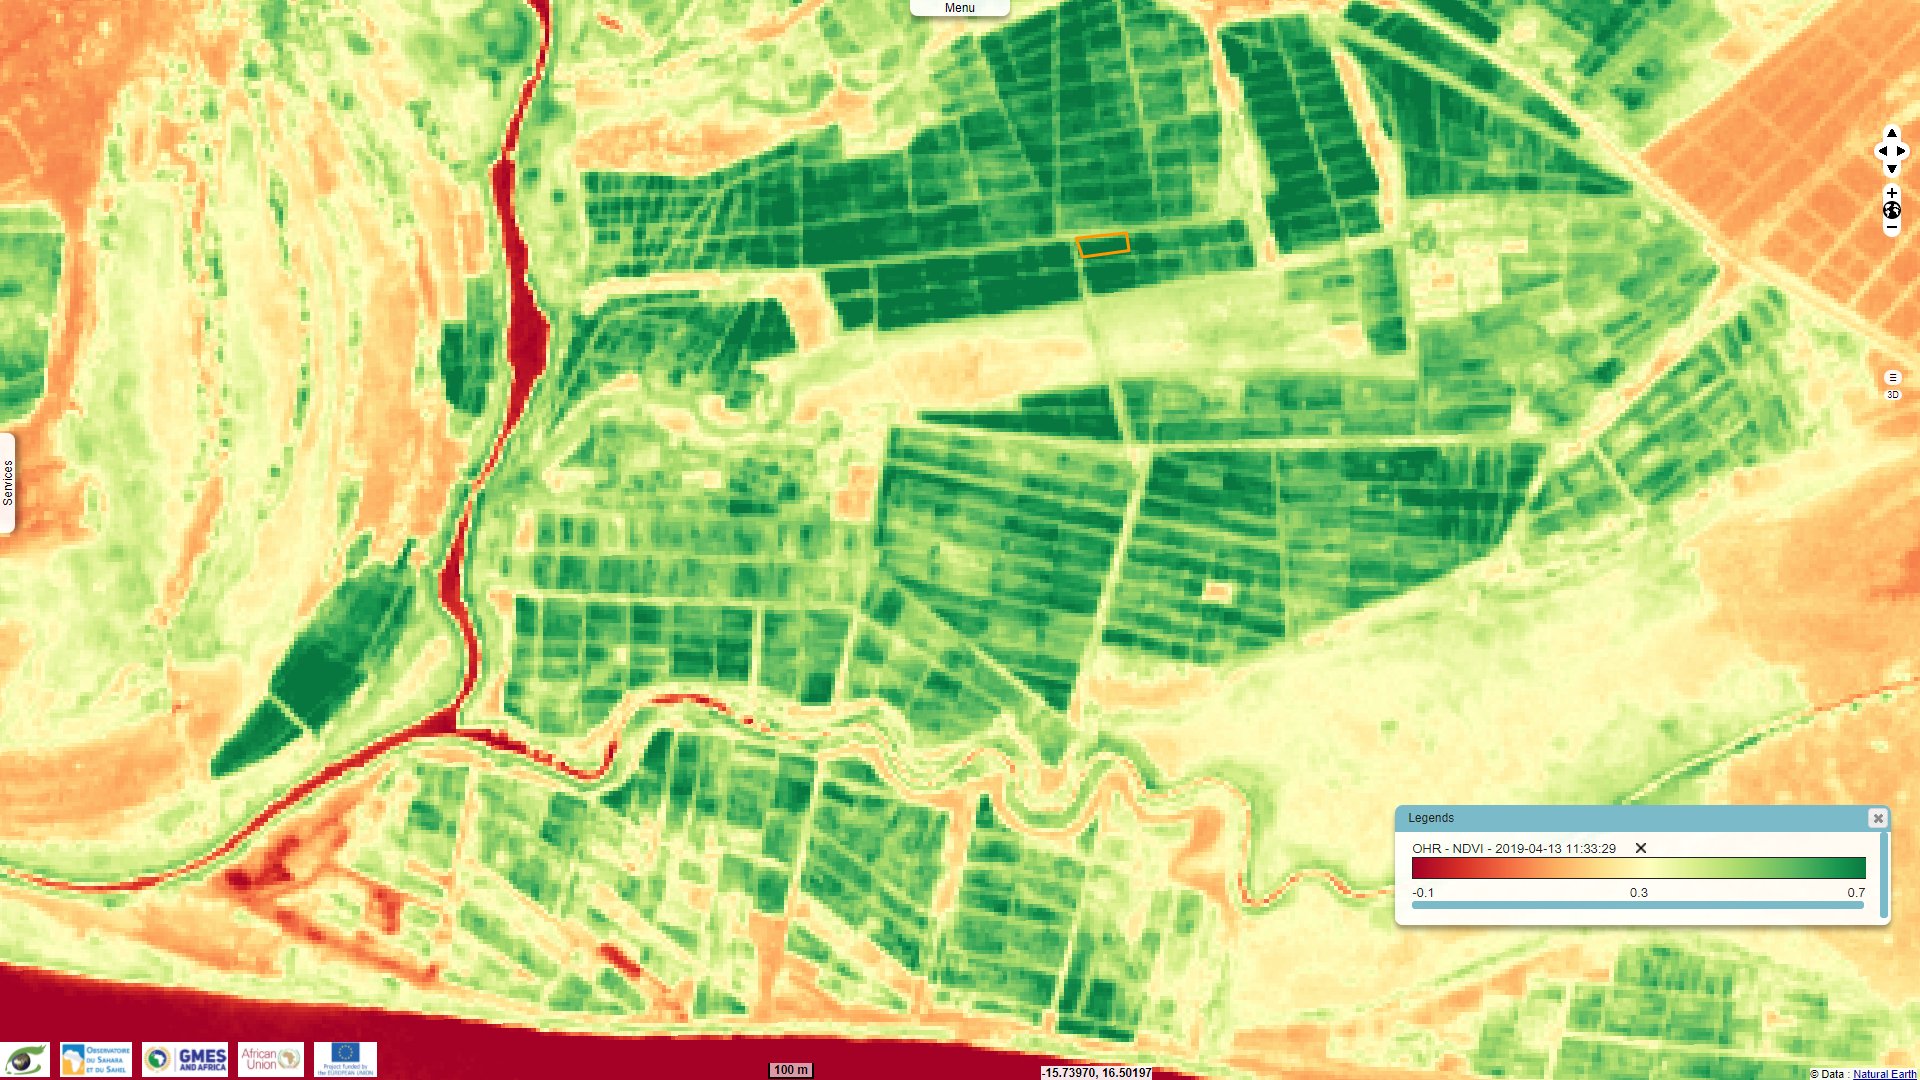
Sentinel-2 MSI acquired on 13 April 2019 at 11:33:29 UTC
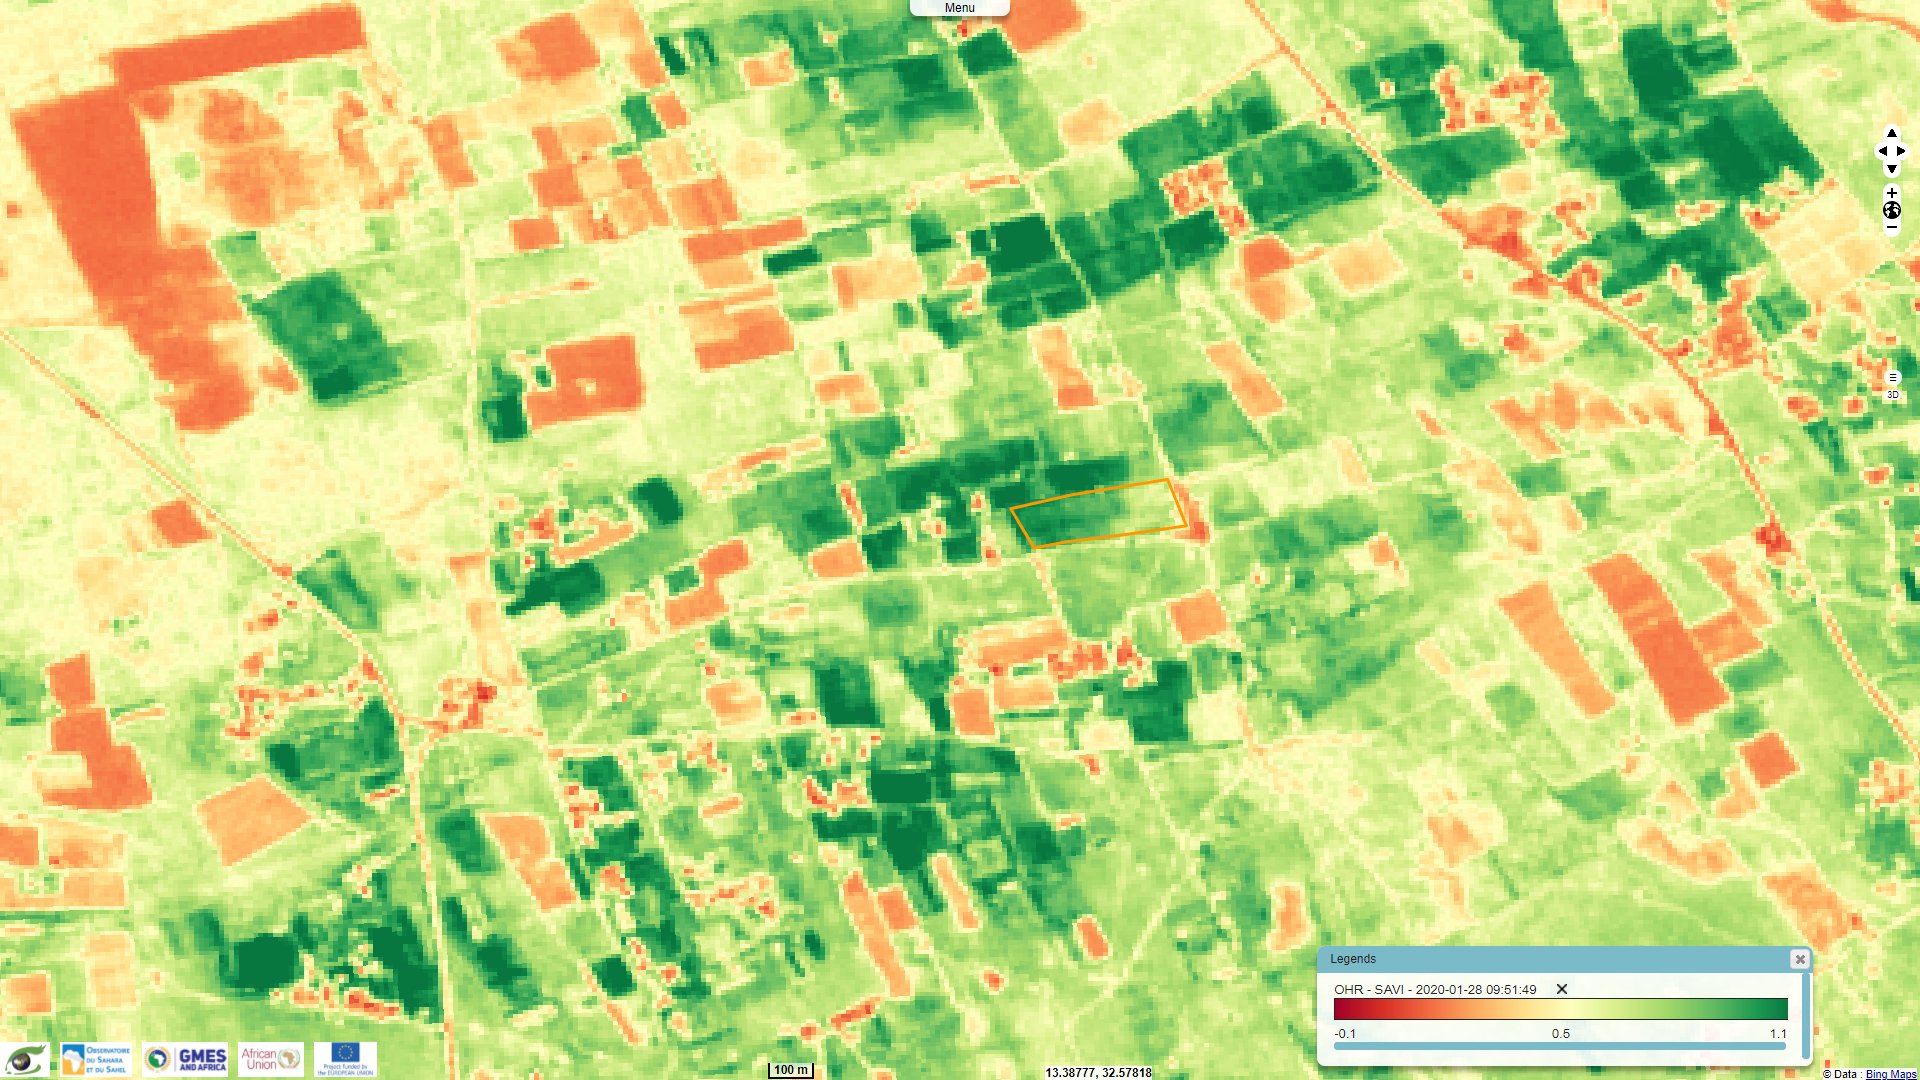
Sentinel-2 MSI acquired on 28 January 2020 at 09:51:49 UTC
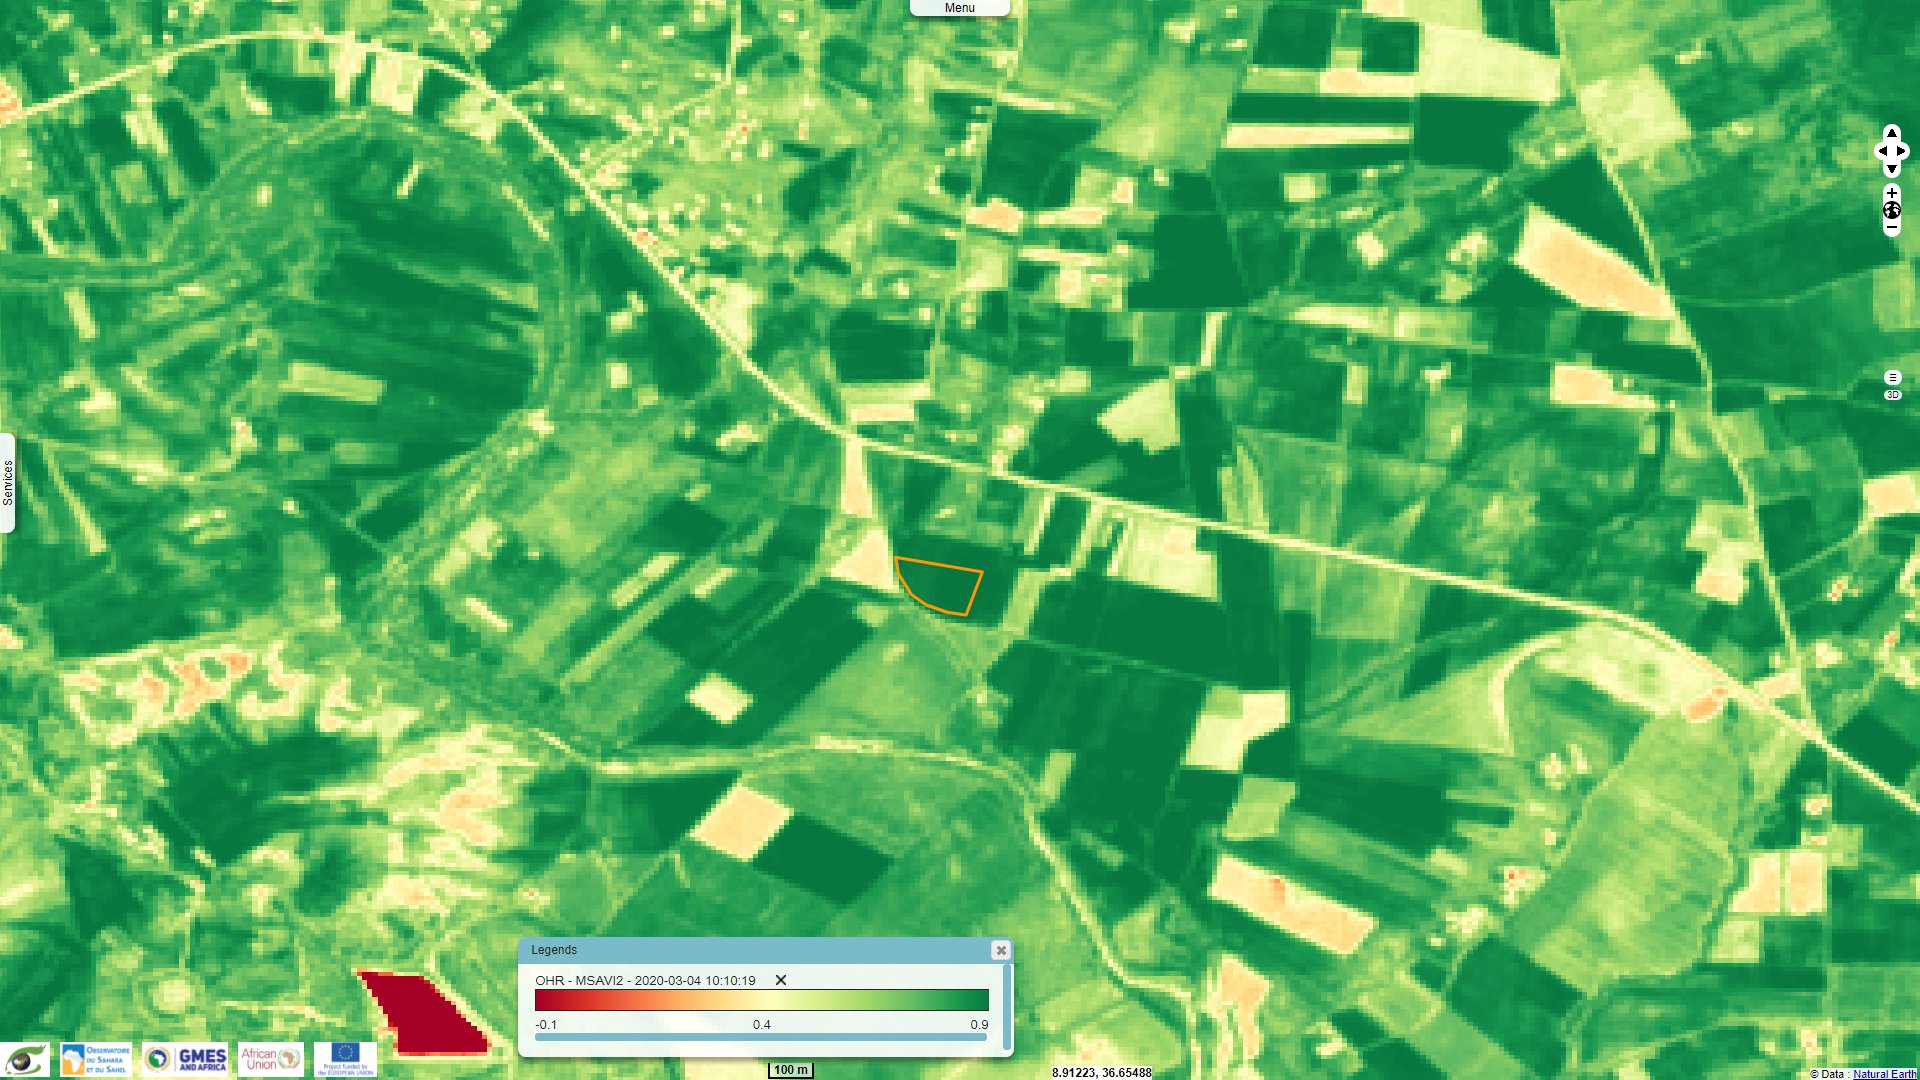
Sentinel-2 MSI acquired on 04 March 2020 at 10:10:19 UTC
Sentinel-2 MSI acquired on 29 March 2019 at 10:40:29 UTC
Sentinel-2 MSI acquired on 13 April 2019 at 11:33:29 UTC
Sentinel-2 MSI acquired on 28 January 2020 at 09:51:49 UTC
Sentinel-2 MSI acquired on 04 March 2020 at 10:10:19 UTC
Keyword(s): Land, agriculture, water, erosion, drought, irrigation, Algeria, Egypt, Libya, Morocco, Mauritania, Tunisia
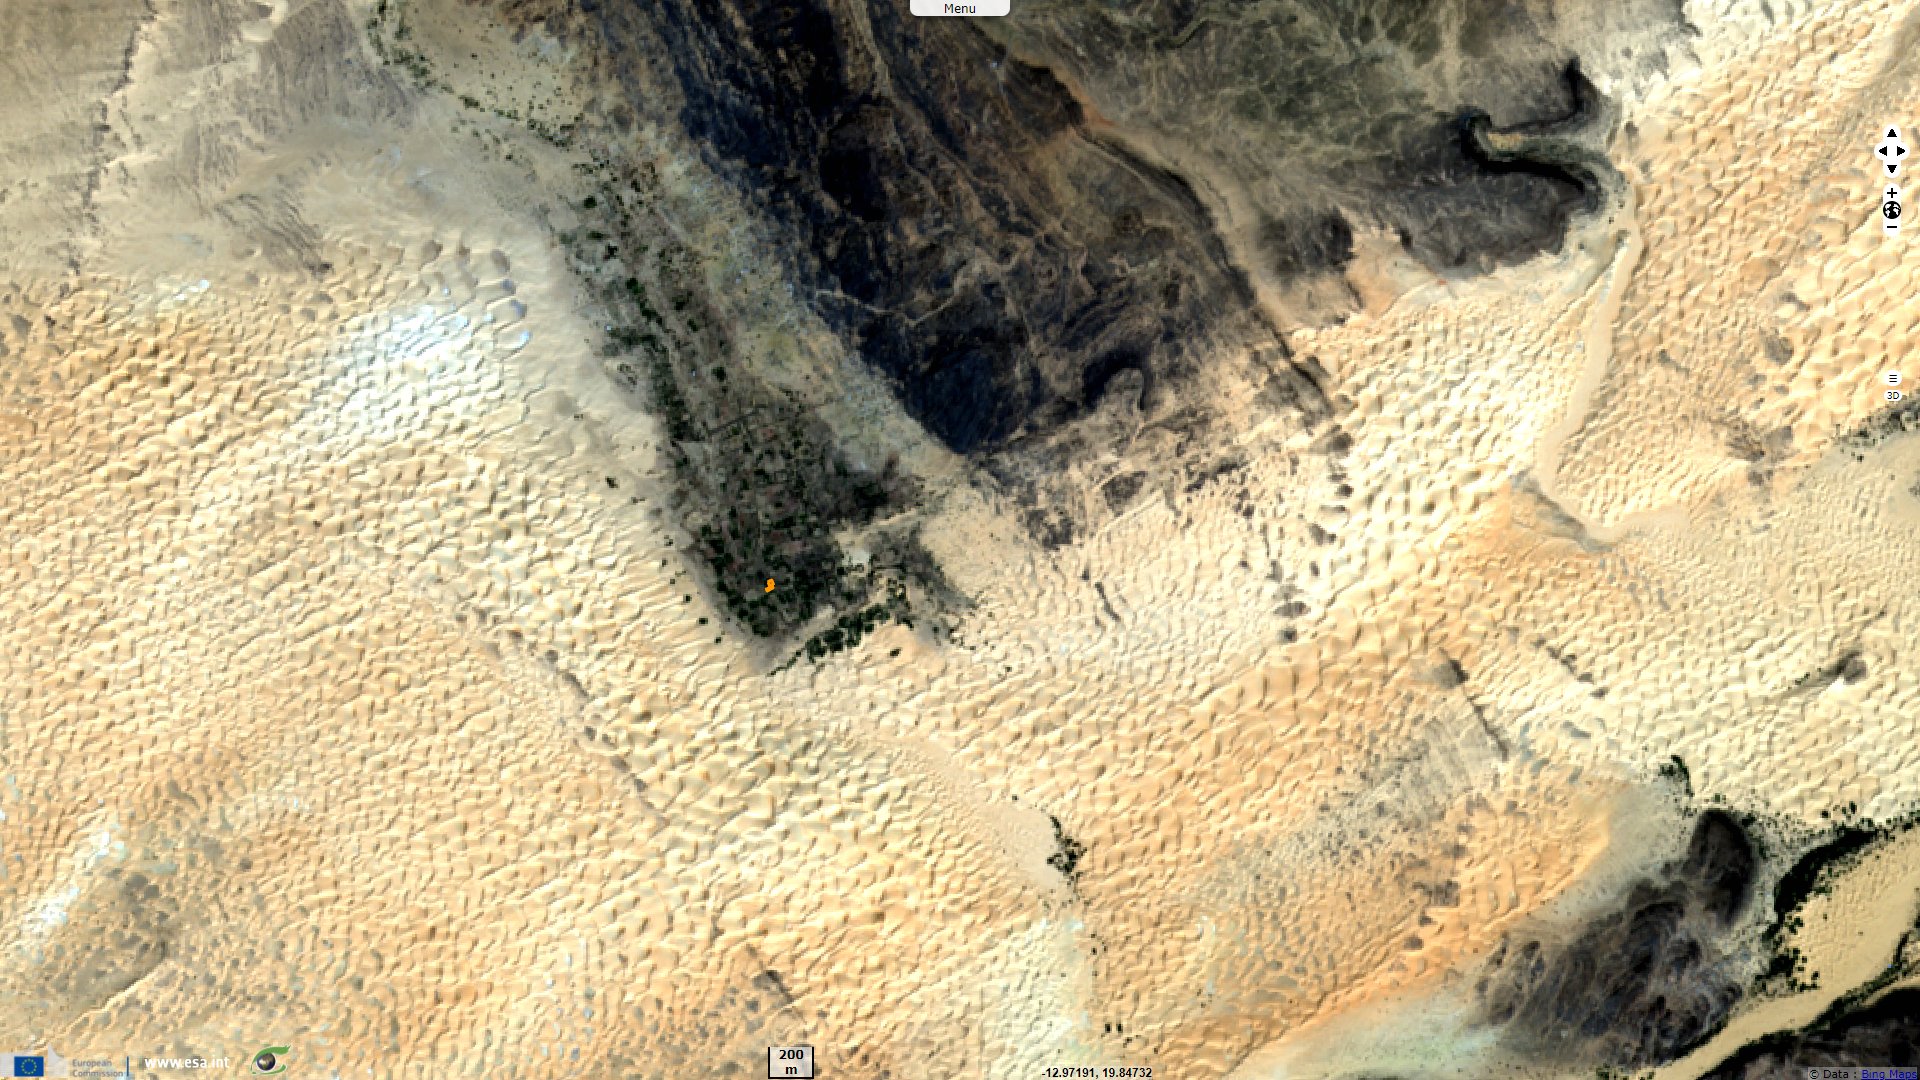
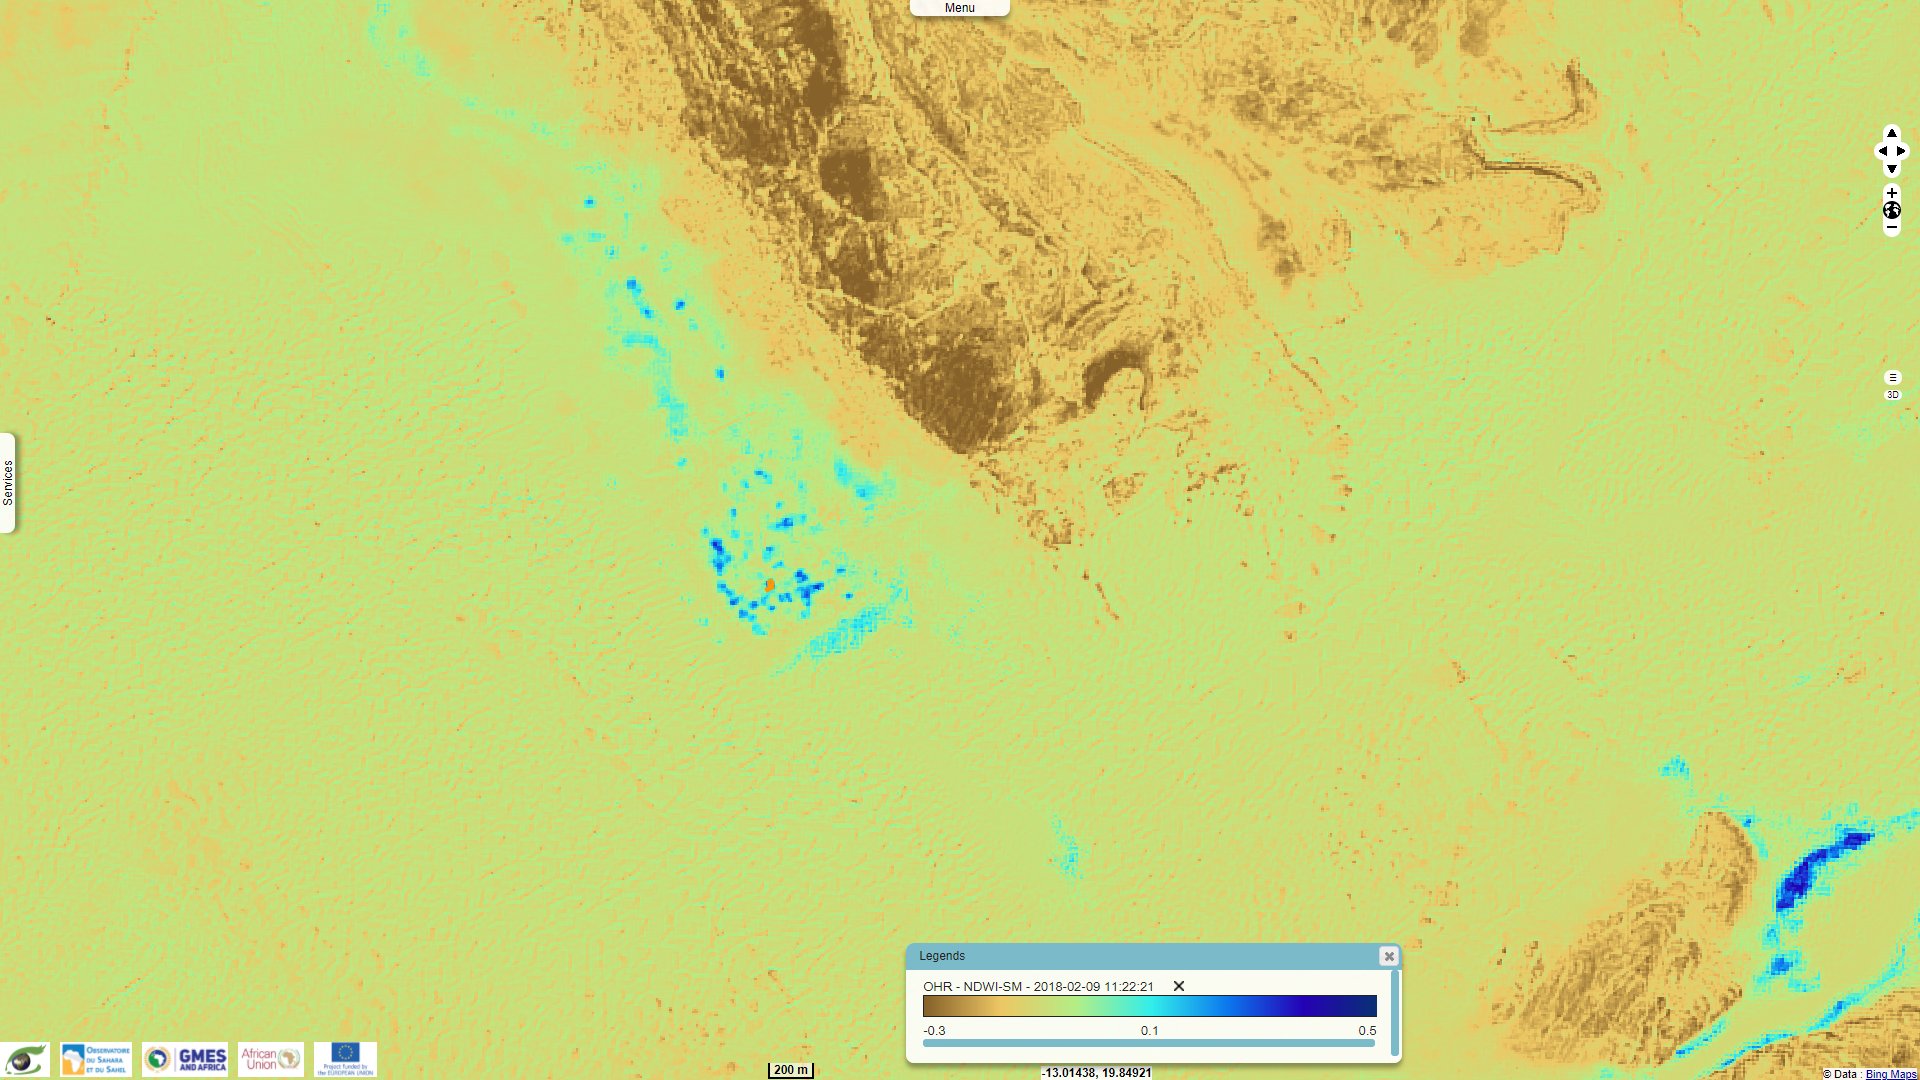
In this Saharian area, some crops are grown in an oasis. These plots show in blue on the soil moisture index above. The precipitations are concentrated during the second half of the year. It does not correlate well with the soil moisture computed along time by Sentinel-2 during from 2018 to 2020. It suggests these date palm trees are not rain fed. The indices are similar all three years showing the soil moisture and the vegetation growth are maximal during the winter months.
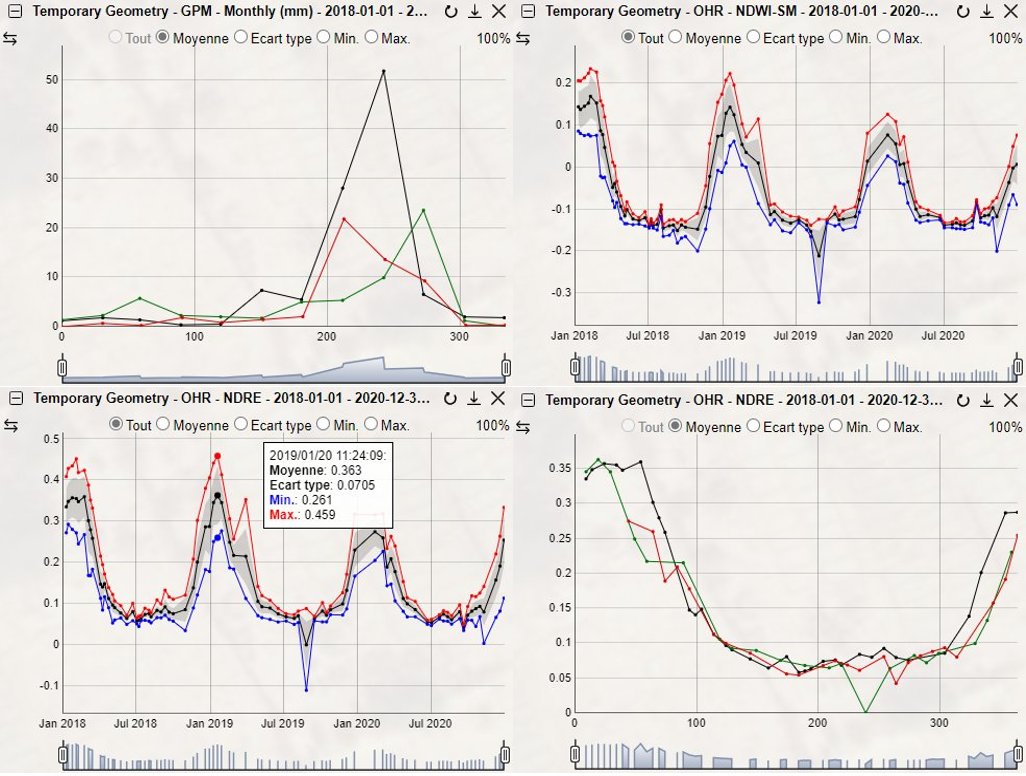
Top left: GPM monthly precipitations on the area of interest from 2018 to 2020, seasonal view.
Top right: Mean of Sentinel-2 NDWI-SM on the area of interest from 2018 to 2020.
Bottom left: Mean of Sentinel-2 NDRE on the area of interest from 2018 to 2020.
Bottom right: Mean of Sentinel-2 NDRE on the area of interest from 2018 to 2020, seasonal view.
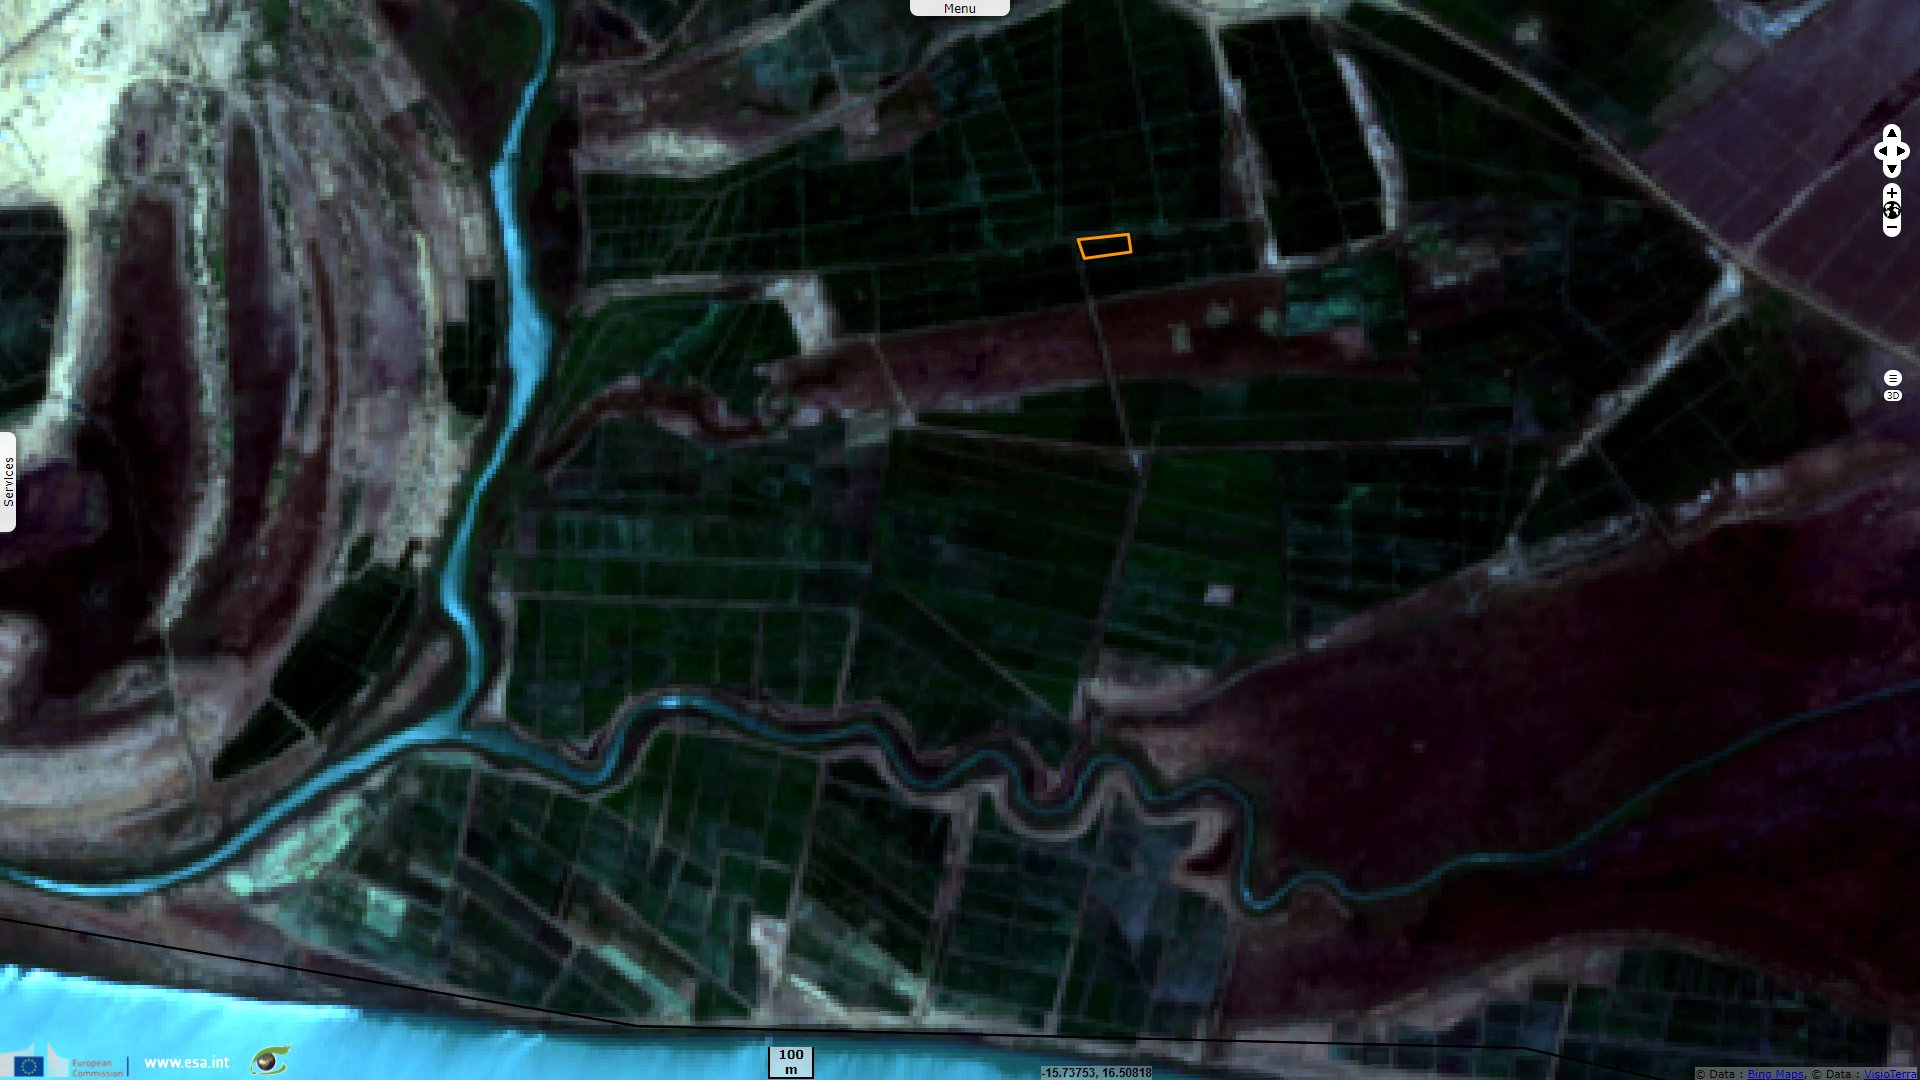
These crops benefit from the Senegal river nearby. The soil index and the vegetation index are closely matched. The second crop of the year follows the precipitations with several weeks of delay. The first crop happens at a period of no significant precipitation which implies it is irrigated.
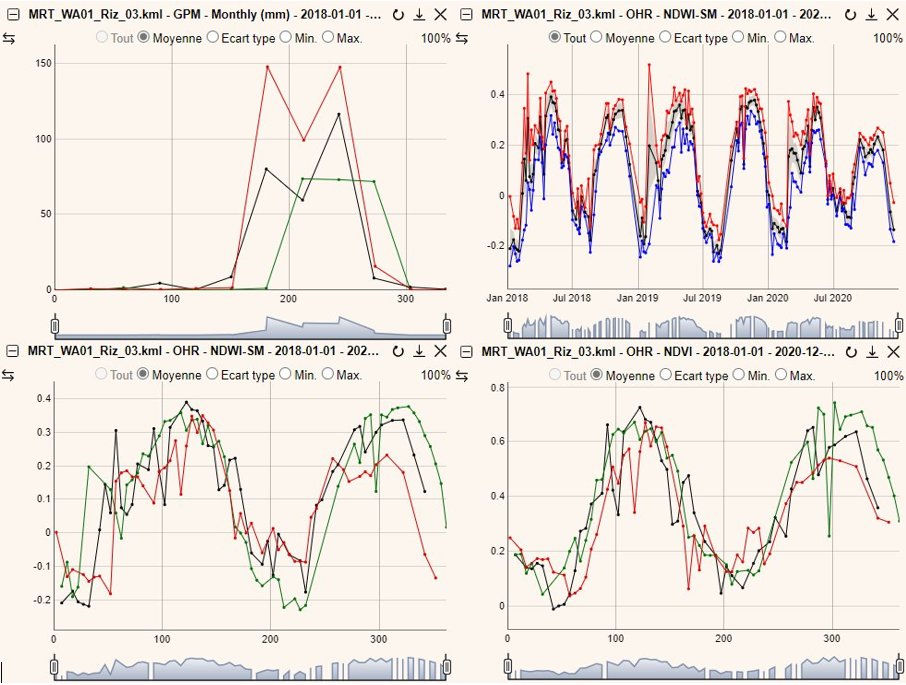
Top left: GPM monthly precipitations on the area of interest from 2018 to 2020, seasonal view.
Top right: Mean of Sentinel-2 NDWI-SM on the area of interest from 2018 to 2020.
Bottom left: Mean of Sentinel-2 NDWI-SM on the area of interest from 2018 to 2020, seasonal view.
Bottom right: Mean of Sentinel-2 NDVI on the area of interest from 2018 to 2020, seasonal view.
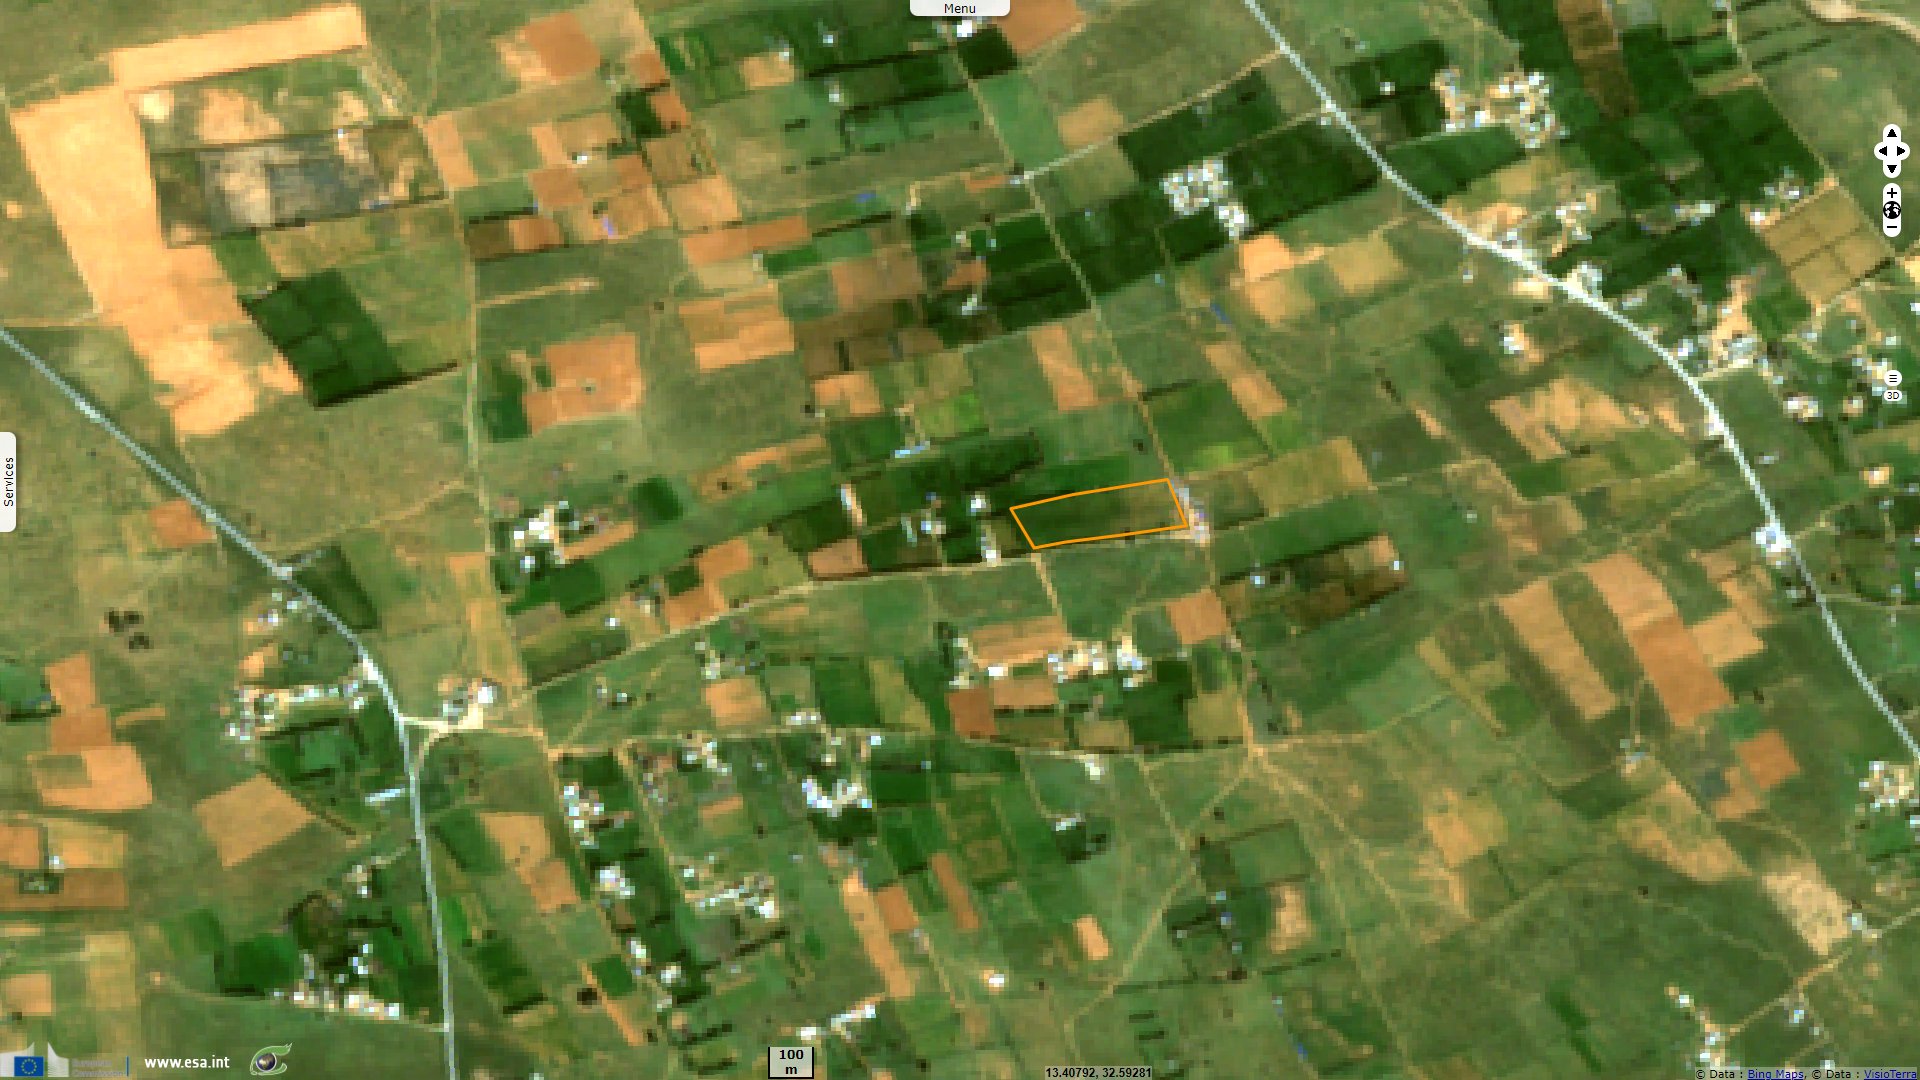
The precipitations, soil moisture and vegetation indices all show good concordance and similar shape from 2018 to 2020.
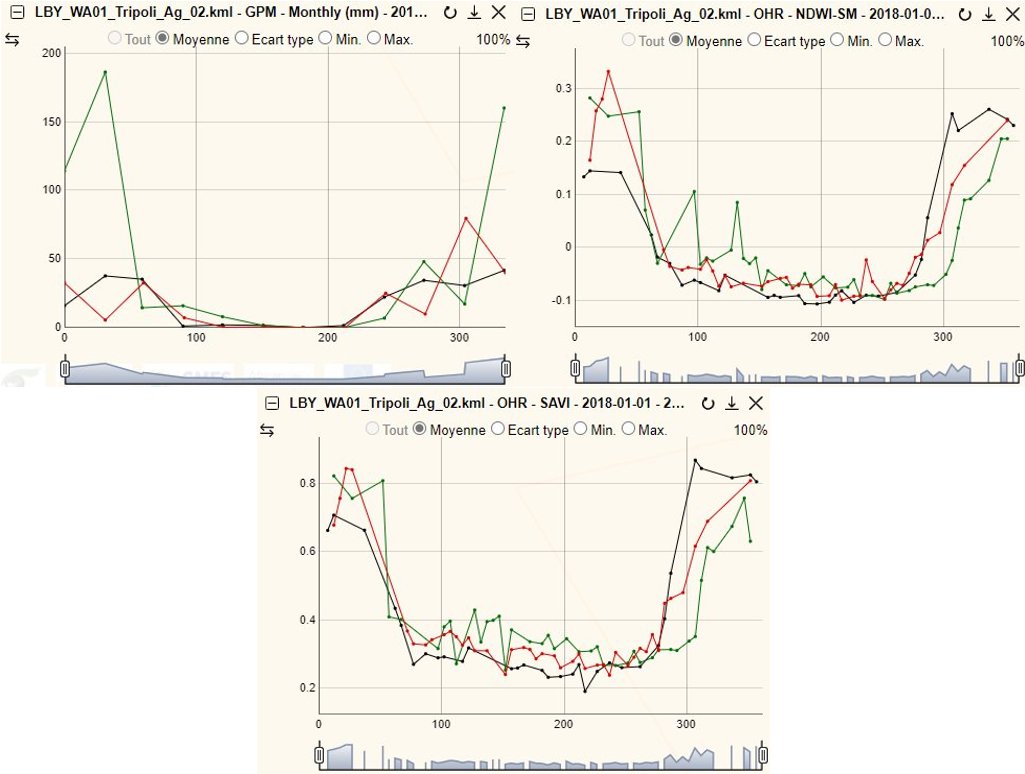
Top left: GPM monthly precipitations on the area of interest from 2018 to 2020, seasonal view.
Top right: Mean of Sentinel-2 NDWI-SM on the area of interest from 2018 to 2020, seasonal view.
Bottom: Mean of Sentinel-2 SAVI on the area of interest from 2018 to 2020, seasonal view.
These graphs show good agreement for 2018 and 2020 but year 2019 (green) seems significantly different regarding precipitations, soil moisture and vegetation indices. This anomaly is coincident with a lower production for this plot in 2019.
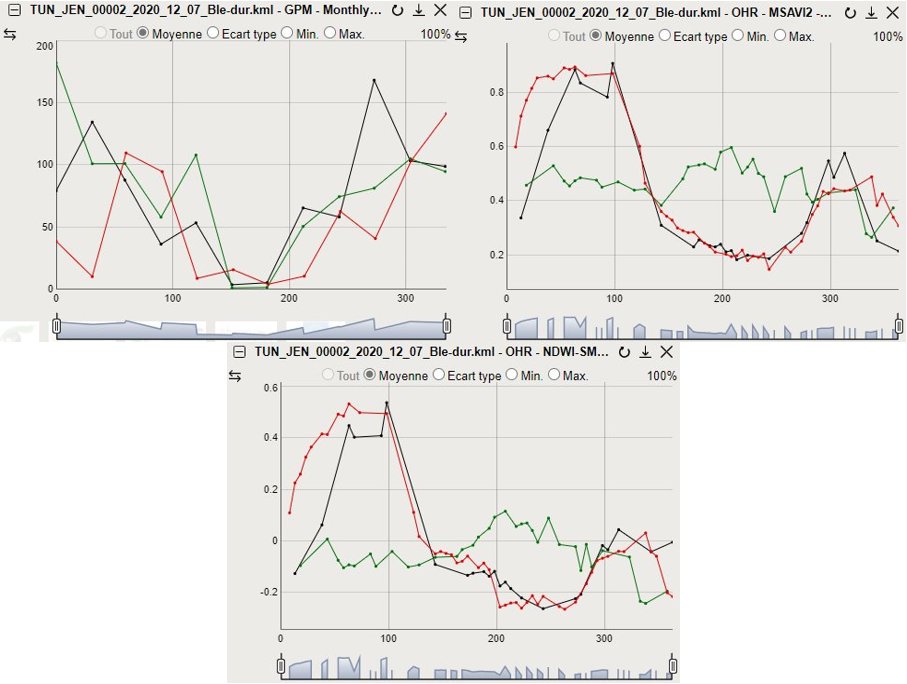
Top left: GPM monthly precipitations on the area of interest from 2018 to 2020, seasonal view.
Top right: Mean of Sentinel-2 MSAVI2 on the area of interest from 2018 to 2020, seasonal view.
Bottom: Mean of Sentinel-2 NDWI-SM on the area of interest from 2018 to 2020, seasonal view.
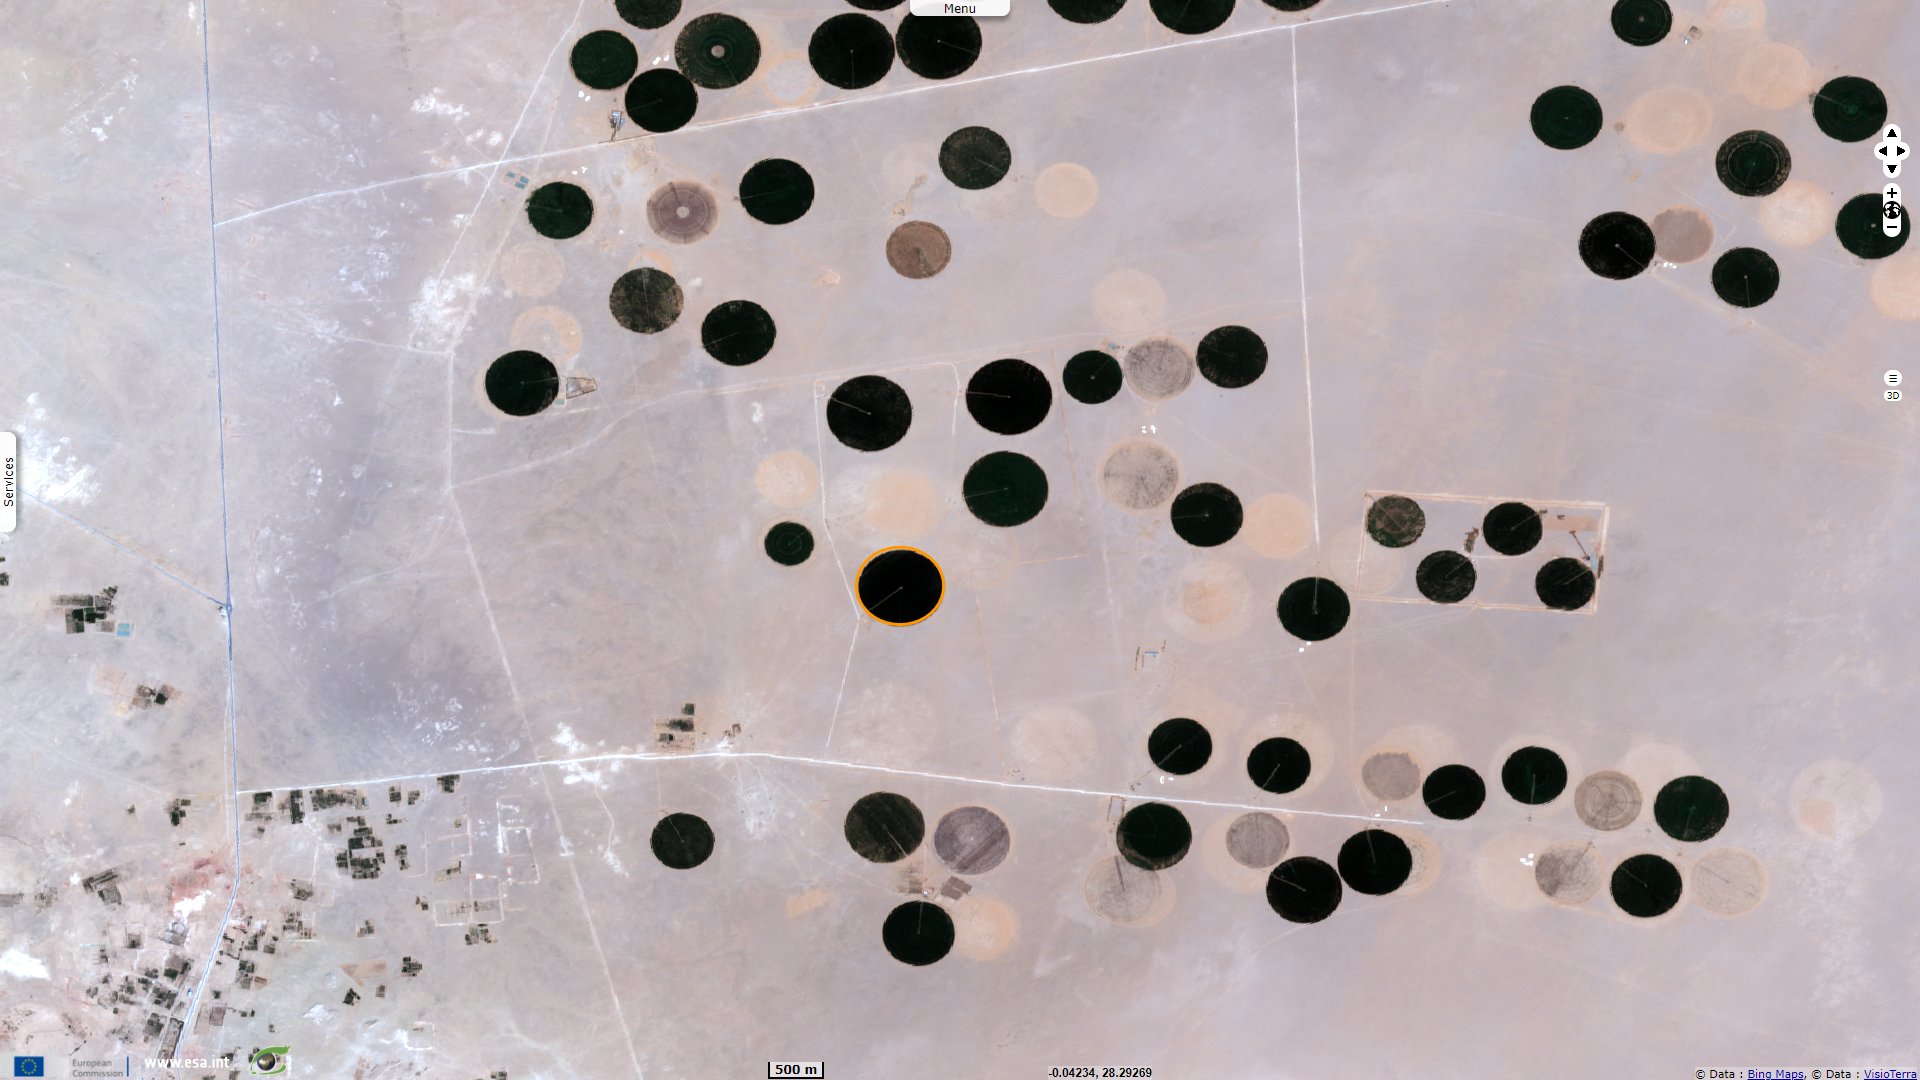
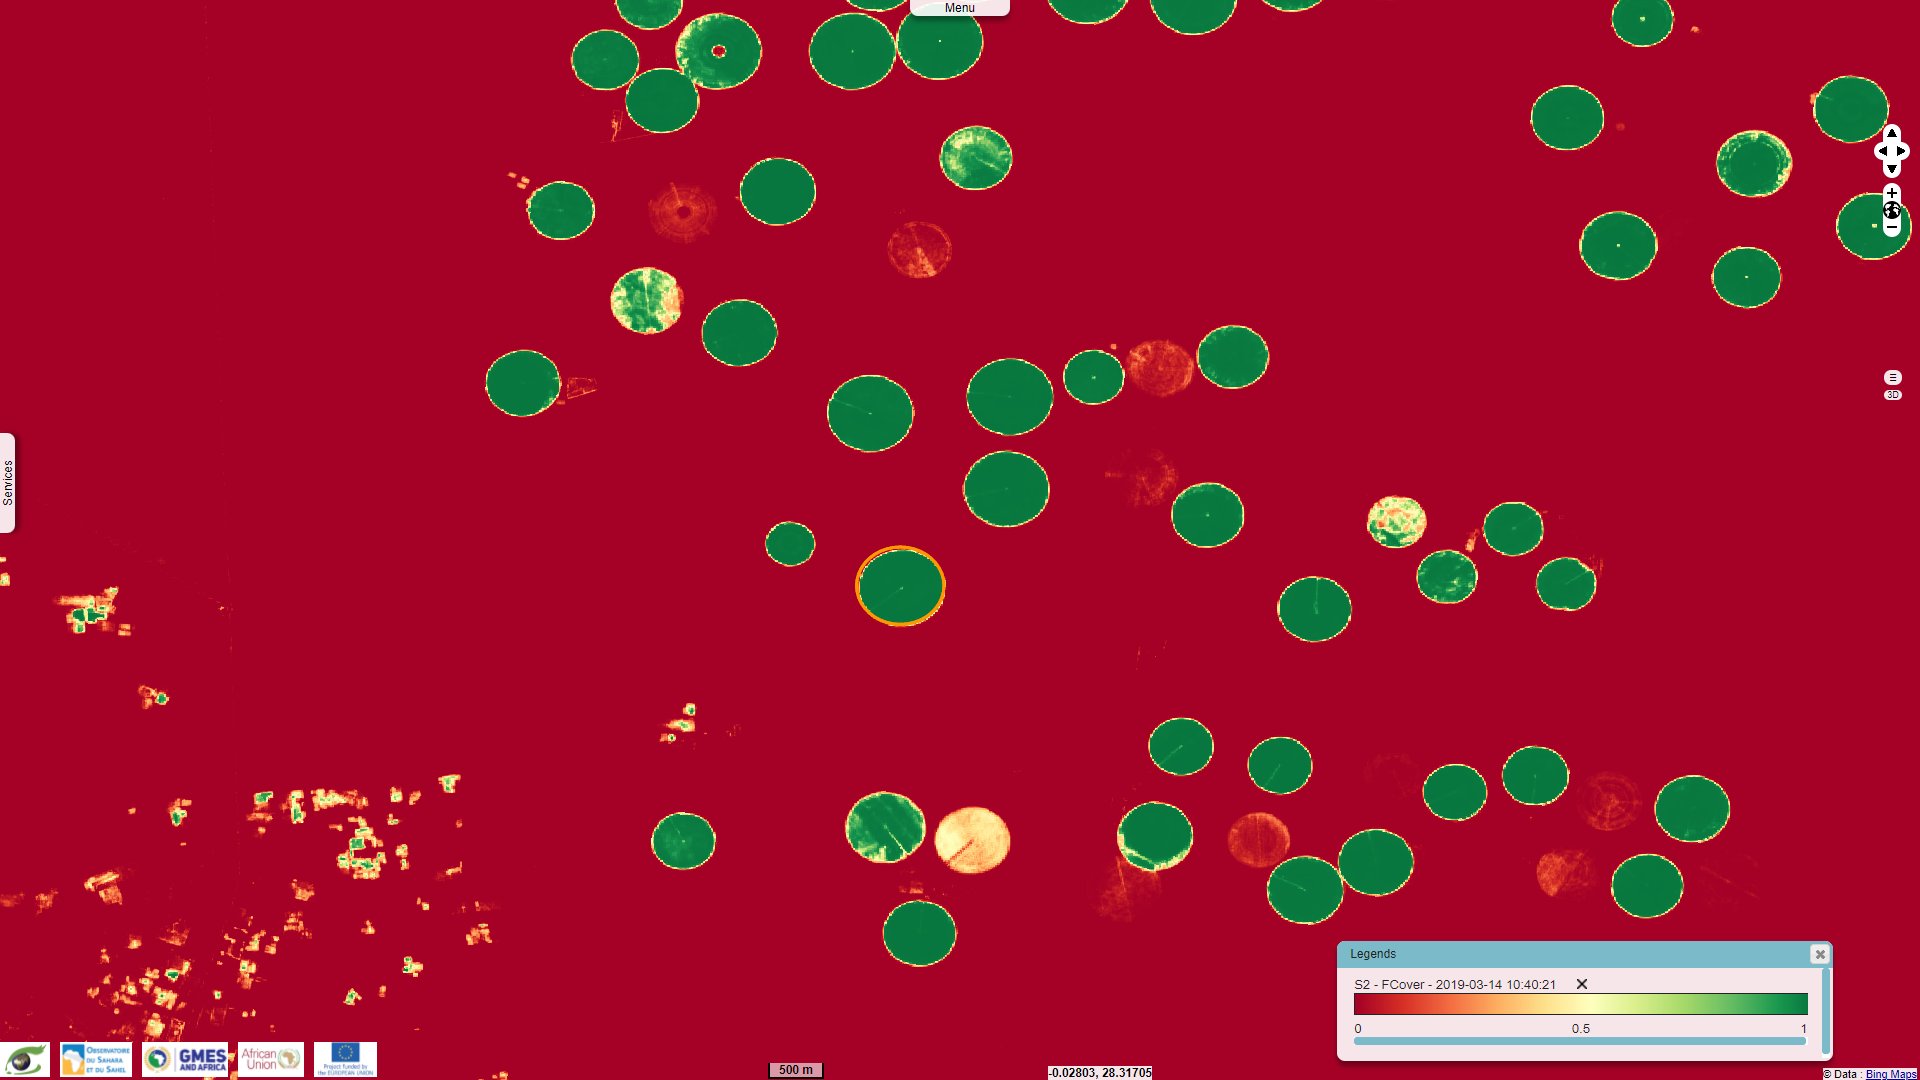
This plot uses center pivot irrigation and does not rely on precipitations for its growth that precedes the rainy months. The year 2019 and 2020 are closely matched but there is neither humidity nor vegetation detected on the area of interest in 2018 (black). It is because the farming of this plot started in early 2019.
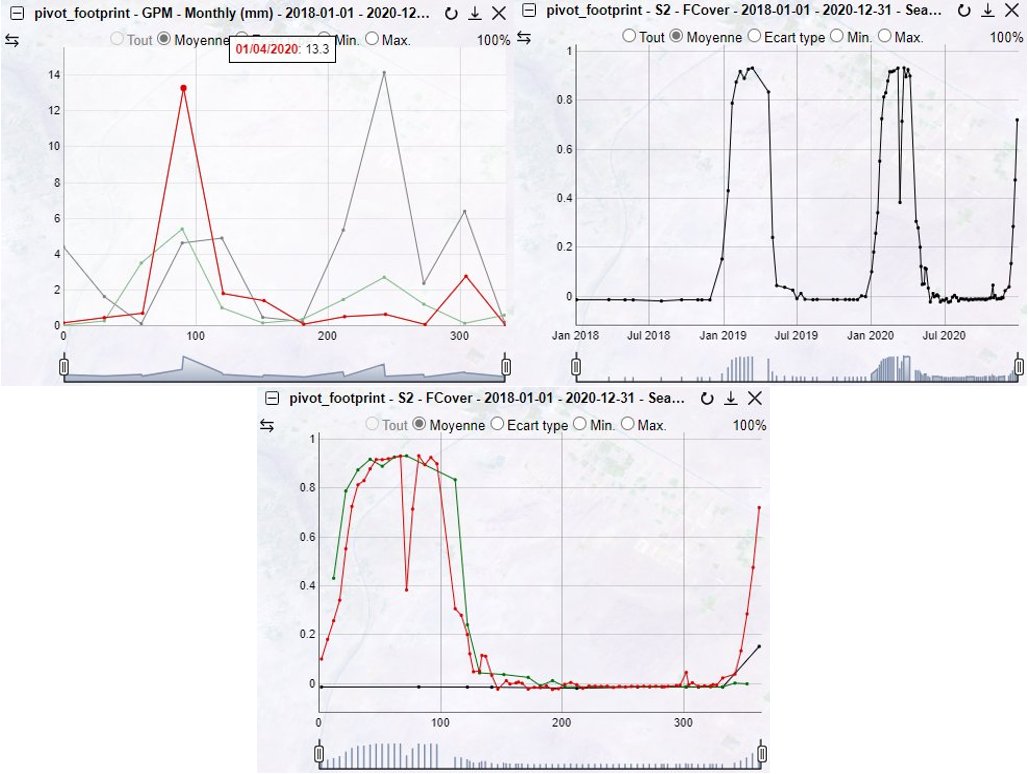
Top left: GPM monthly precipitations on the area of interest from 2018 to 2020, seasonal view.
Top right: Mean of Sentinel-2 F-Cover on the area of interest from 2018 to 2020.
Bottom: Mean of Sentinel-2 F-Cover on the area of interest from 2018 to 2020, seasonal view.
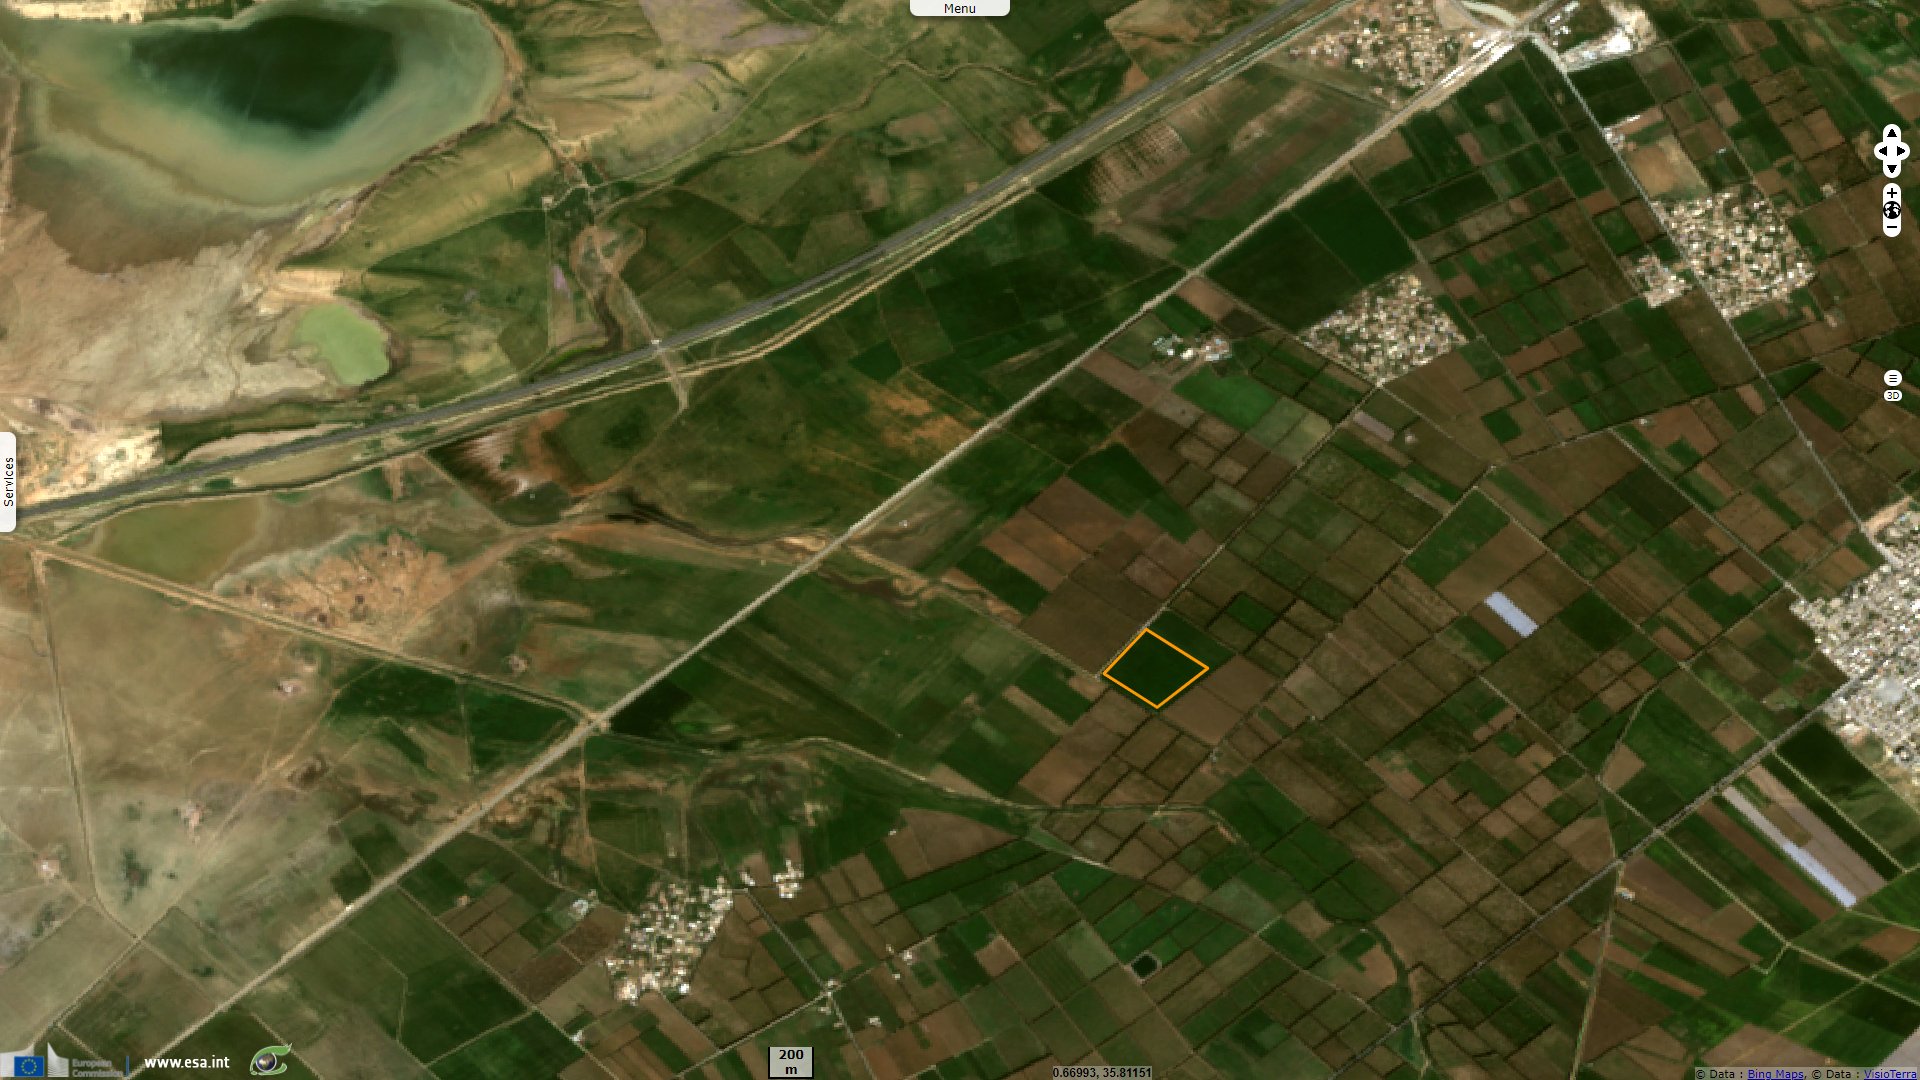
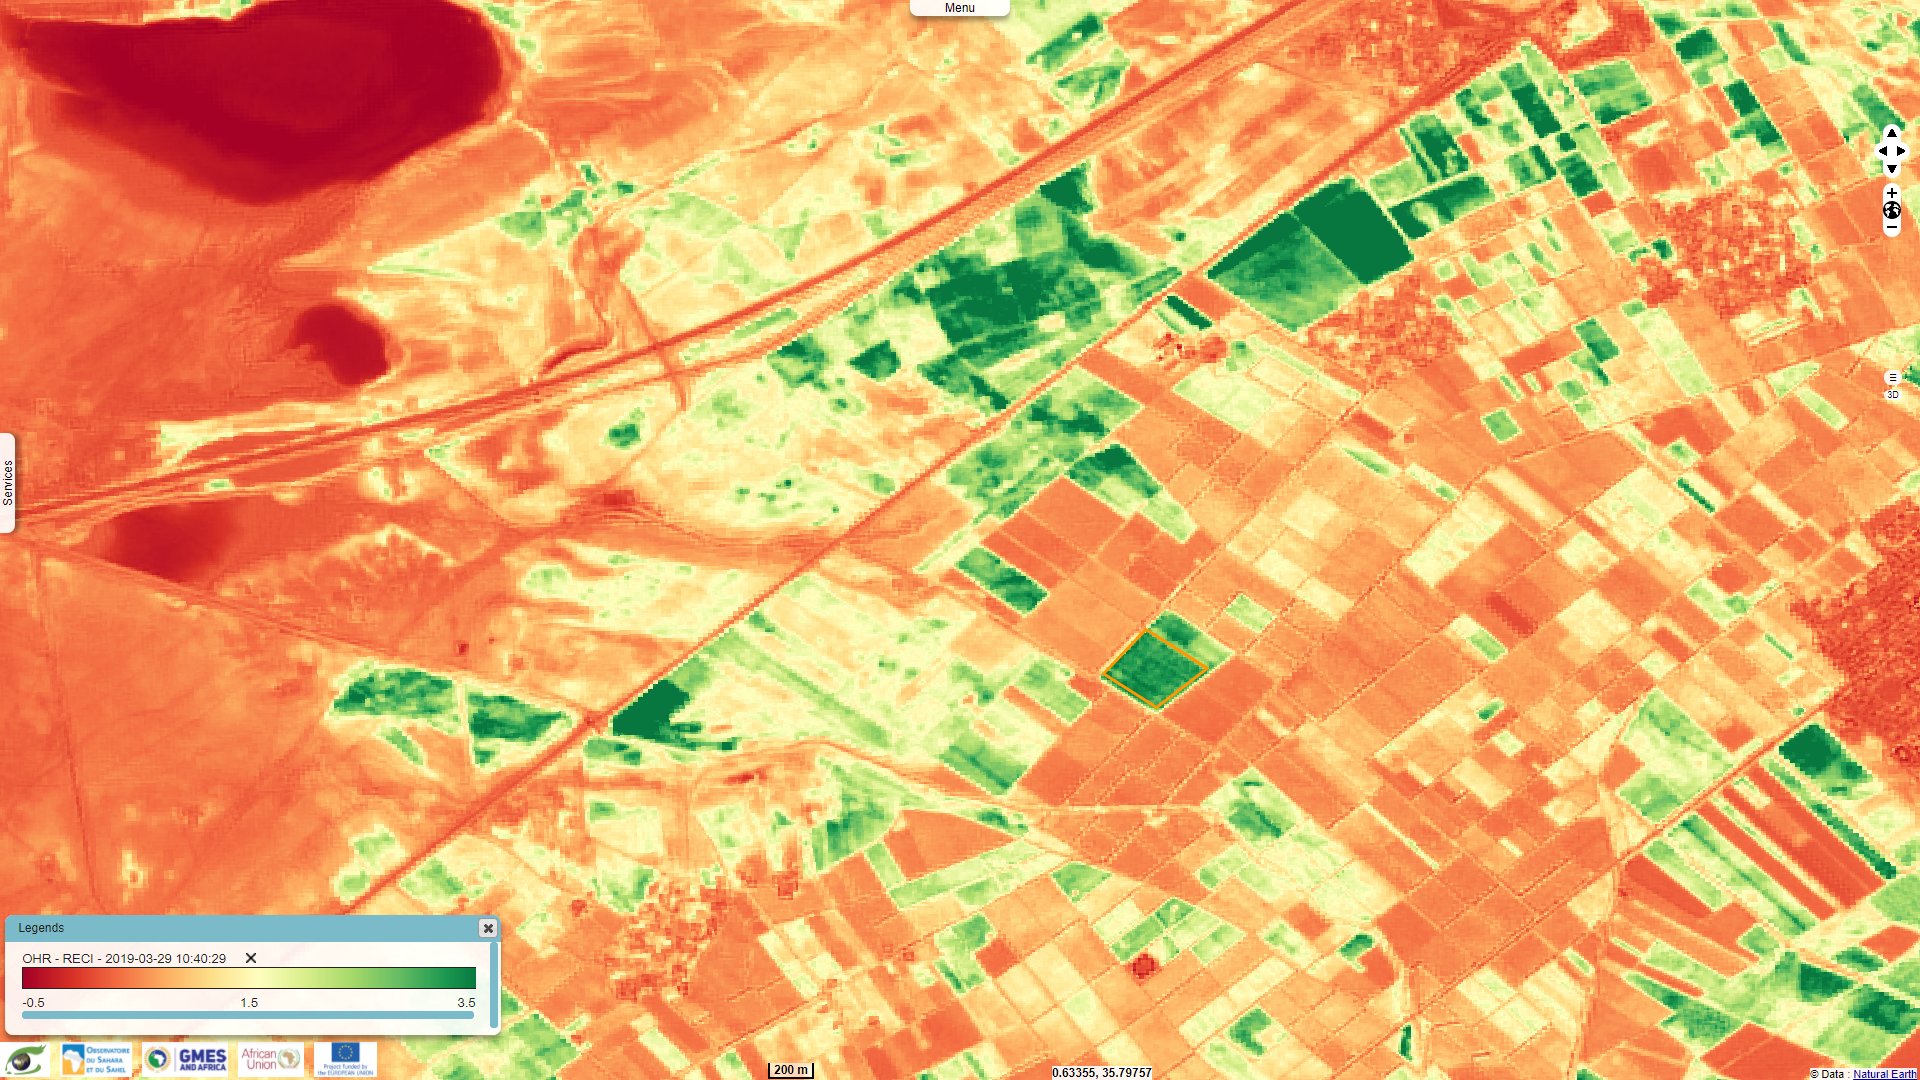
These graphs show good agreement for 2018 and 2019 but lower precipitations in 2020 (red) that resulted in lower measures of soil moisture and vegetation indices the same year. This anomaly can be linked to a lower yield for this plot in 2020.
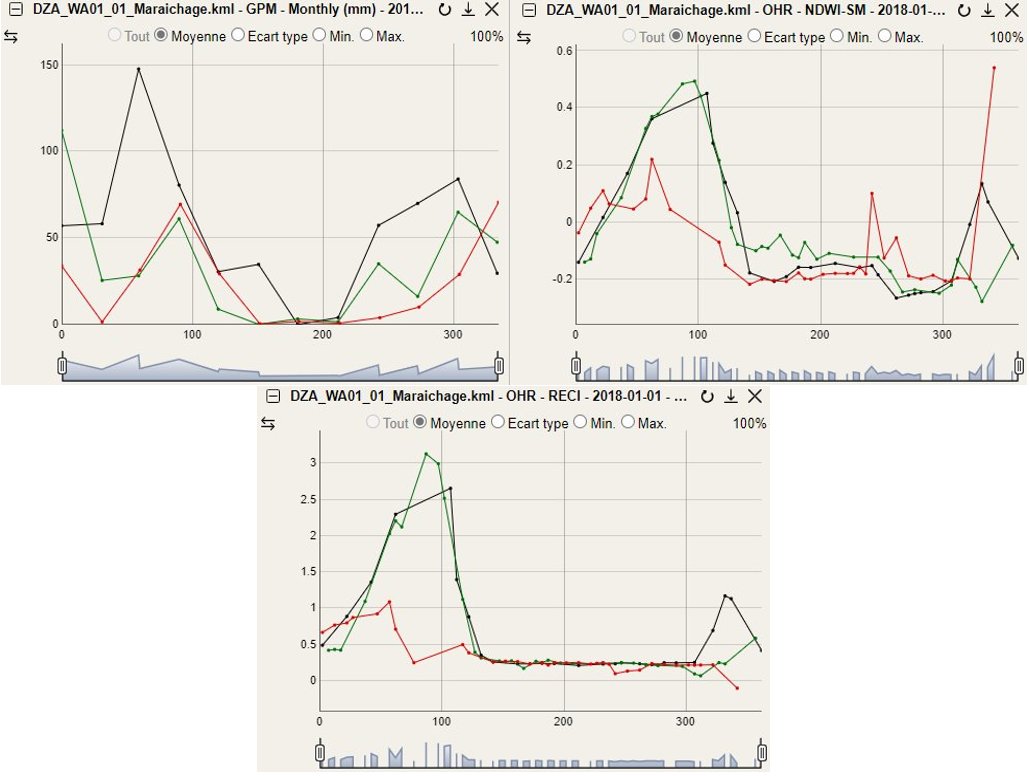
Top left: GPM monthly precipitations on the area of interest from 2018 to 2020, seasonal view.
Top right: Mean of Sentinel-2 NDWI-SM on the area of interest from 2018 to 2020, seasonal view.
Bottom: Mean of Sentinel-2 RECI on the area of interest from 2018 to 2020, seasonal view.
The views expressed herein can in no way be taken to reflect the official opinion of the European Space Agency or the European Union.
Contains modified Copernicus Sentinel data 2026, processed by VisioTerra.
Contains modified Copernicus Sentinel data 2026, processed by VisioTerra.
| More on European Commission space: |  |
 |
 |
||||
| More on ESA: | |
|
|
S-1 website | S-2 website | S-3 website | |
| More on Copernicus program: | |
|
|
Scihub portal | Cophub portal | Inthub portal | Colhub portal |
| More on VisioTerra: | |
|
|
Sentinel Vision Portal | Envisat+ERS portal | Swarm+GOCE portal | CryoSat portal |
- Agricultural seasonal monitoring and Early warning,
- Water abstraction assessment and monitoring water use in irrigated areas,
- Land degradation monitoring.
Delivered by African EO Services, the MISBAR platform (Monitoring Integrated Services for Best Assessment for natural Resources) allows to monitor vegetation along time crop by crop in vast areas, allowing precision agriculture to optimise water in regions where the water resource is sometimes scarce.