The Great Green Wall against desertification built by Africa, an example in Senegal
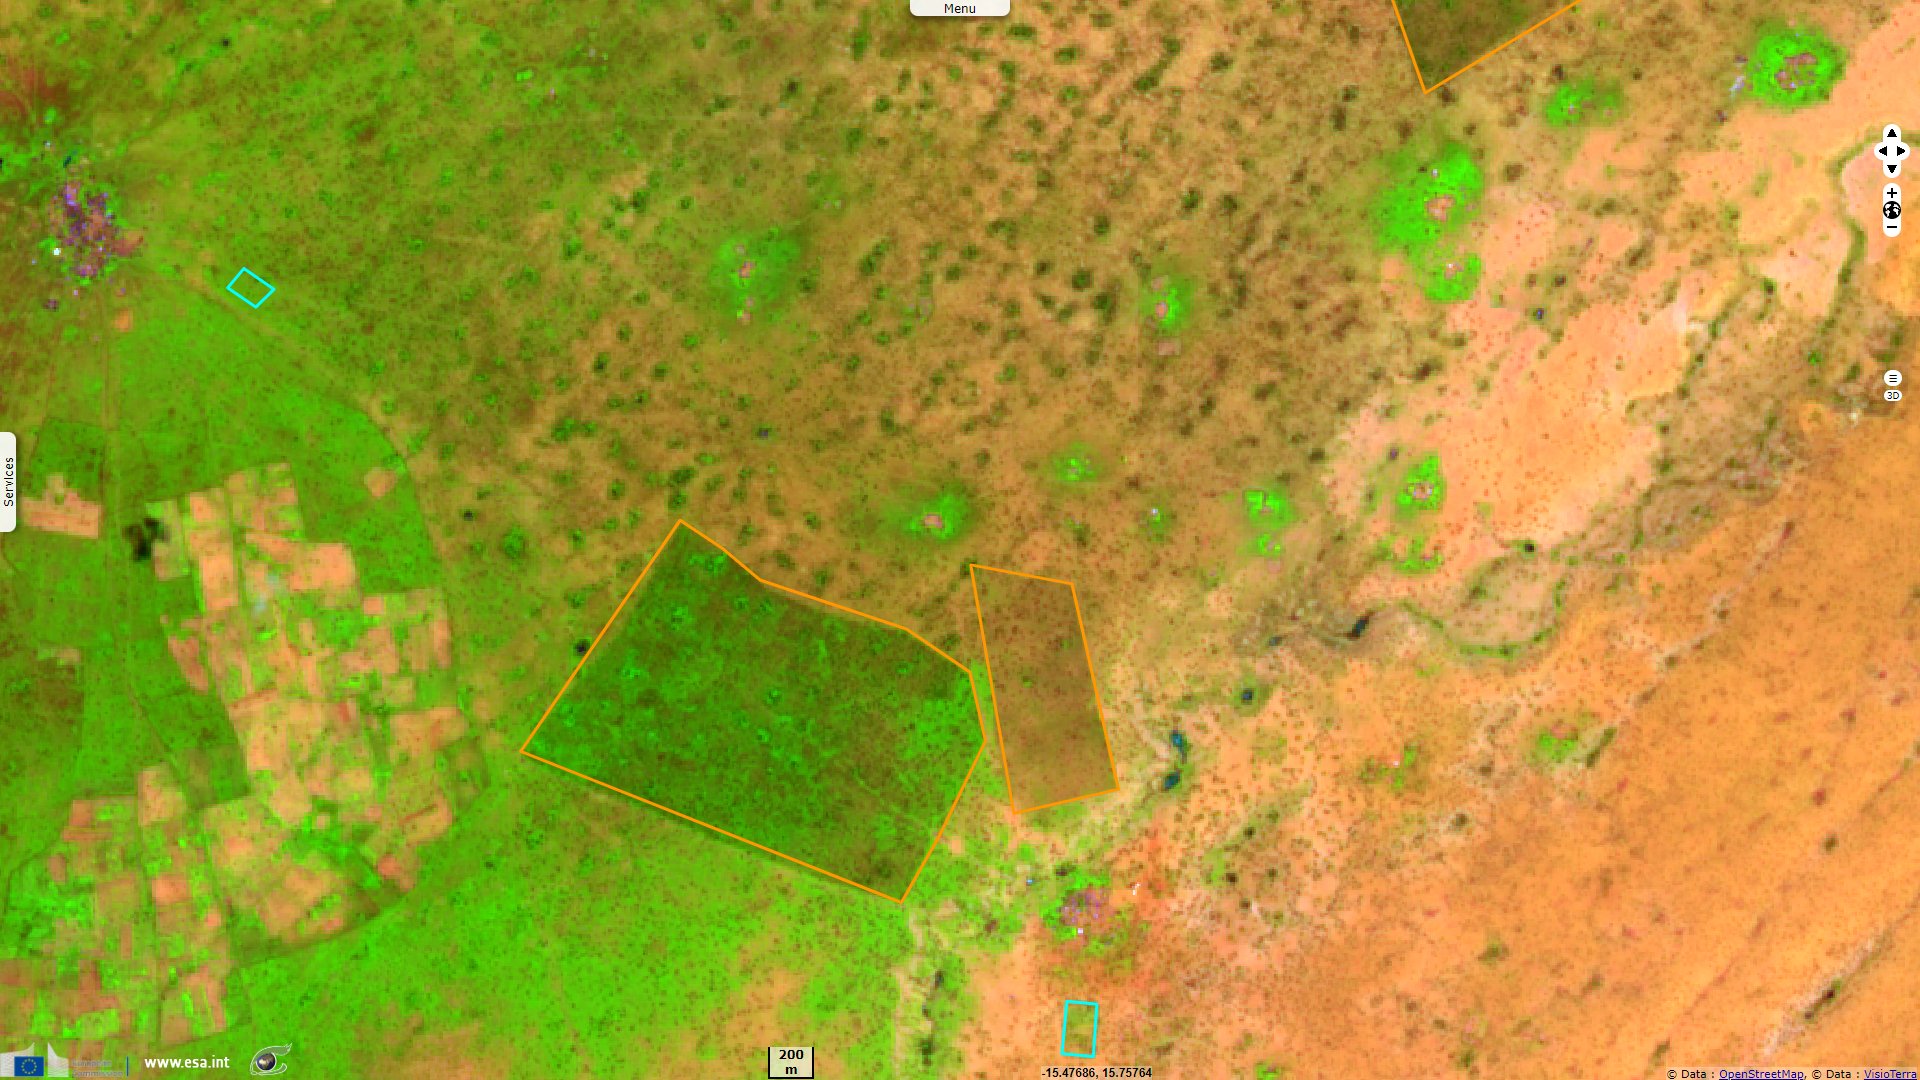
Sentinel-2 MSI acquired on 23 April 2016 at 11:33:22 UTC
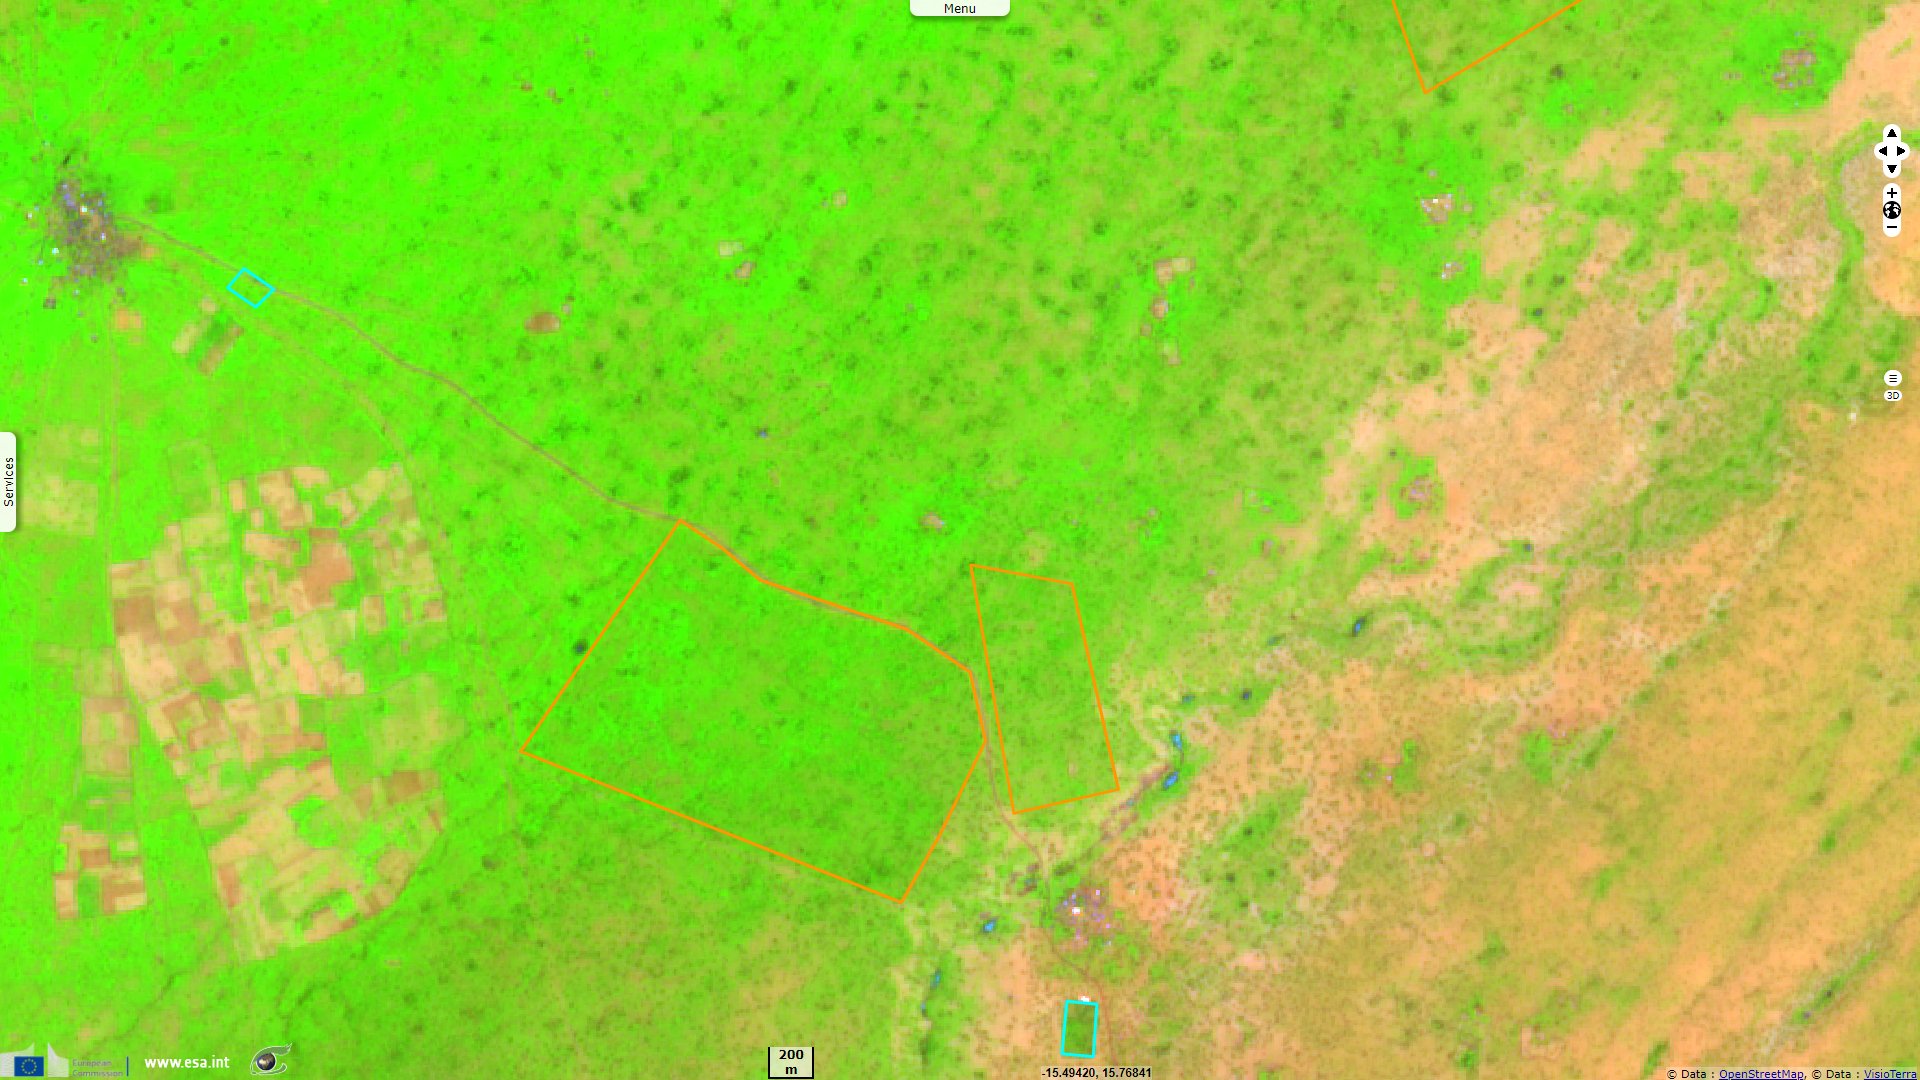
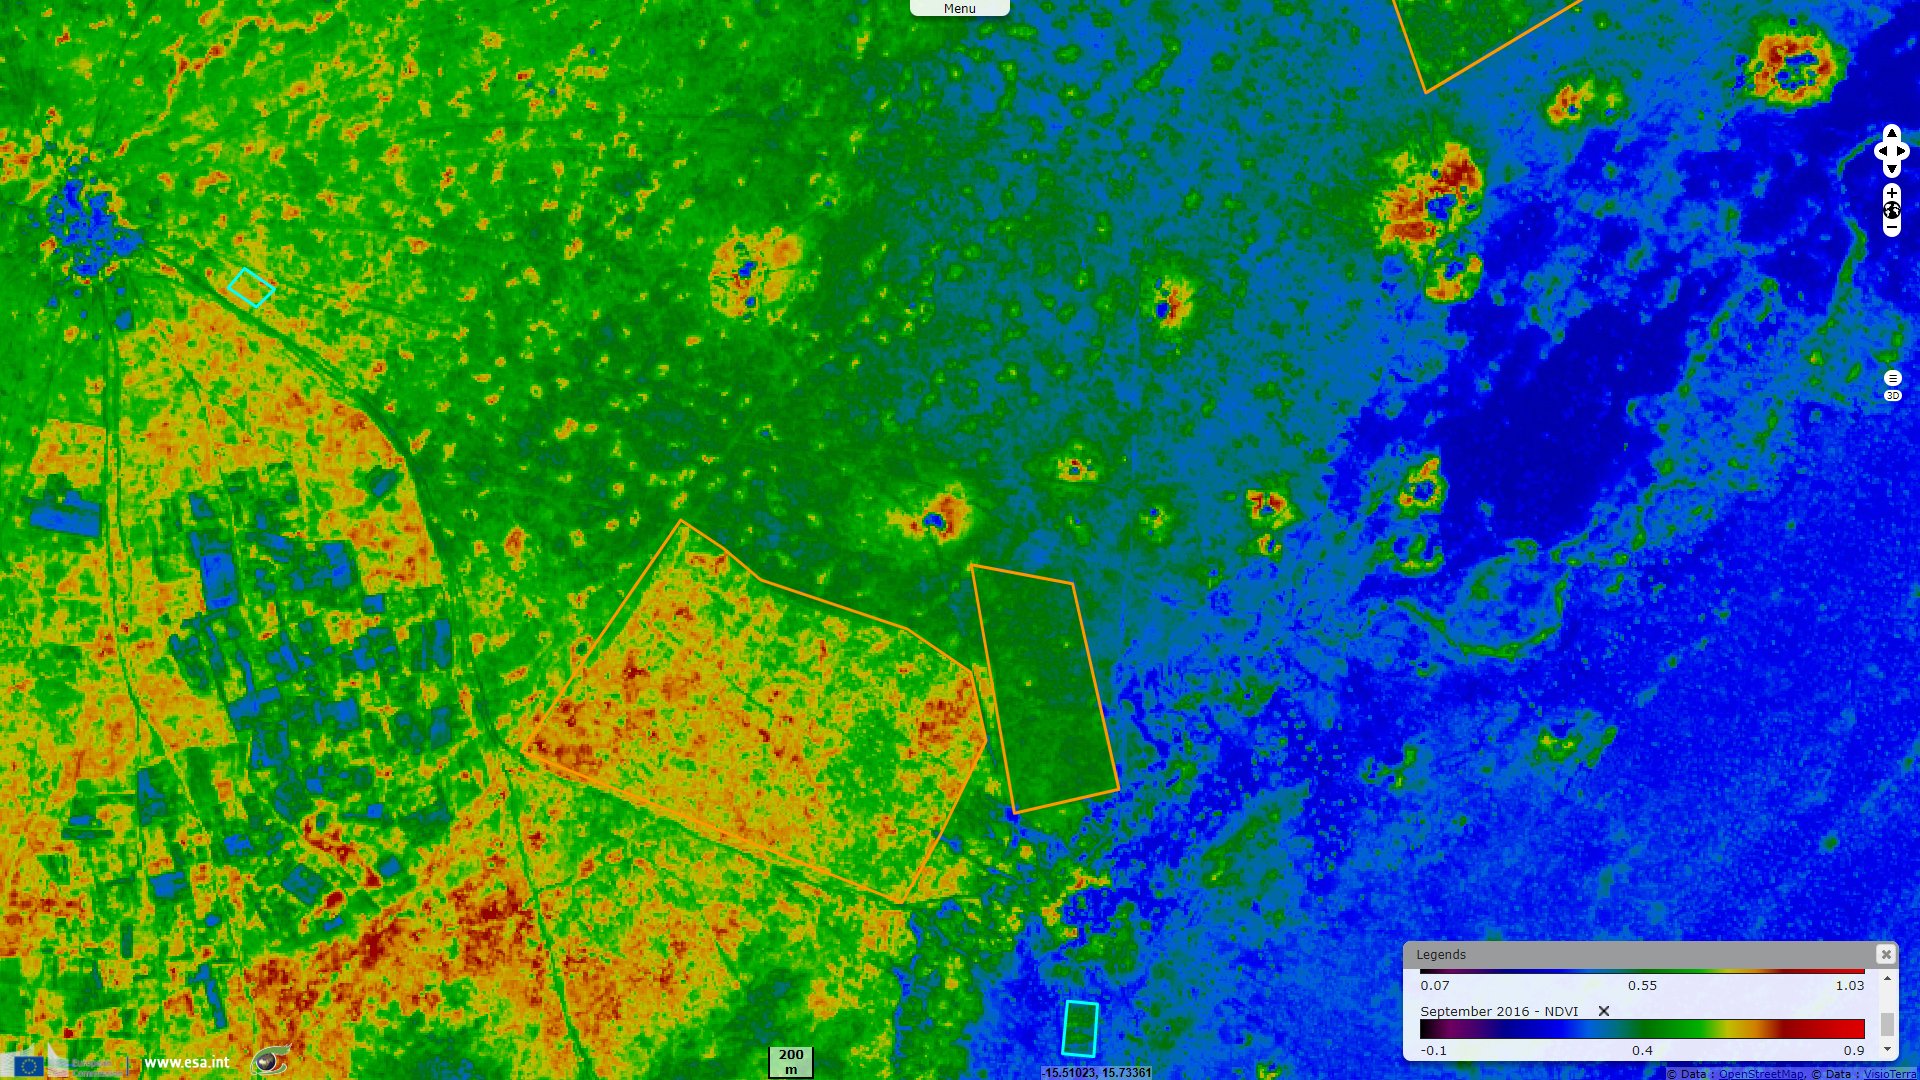
Sentinel-2 MSI acquired on 27 September 2016 at 11:21:12 UTC
Sentinel-3 OLCI FR acquired on 19 March 2018 at 10:48:03 UTC
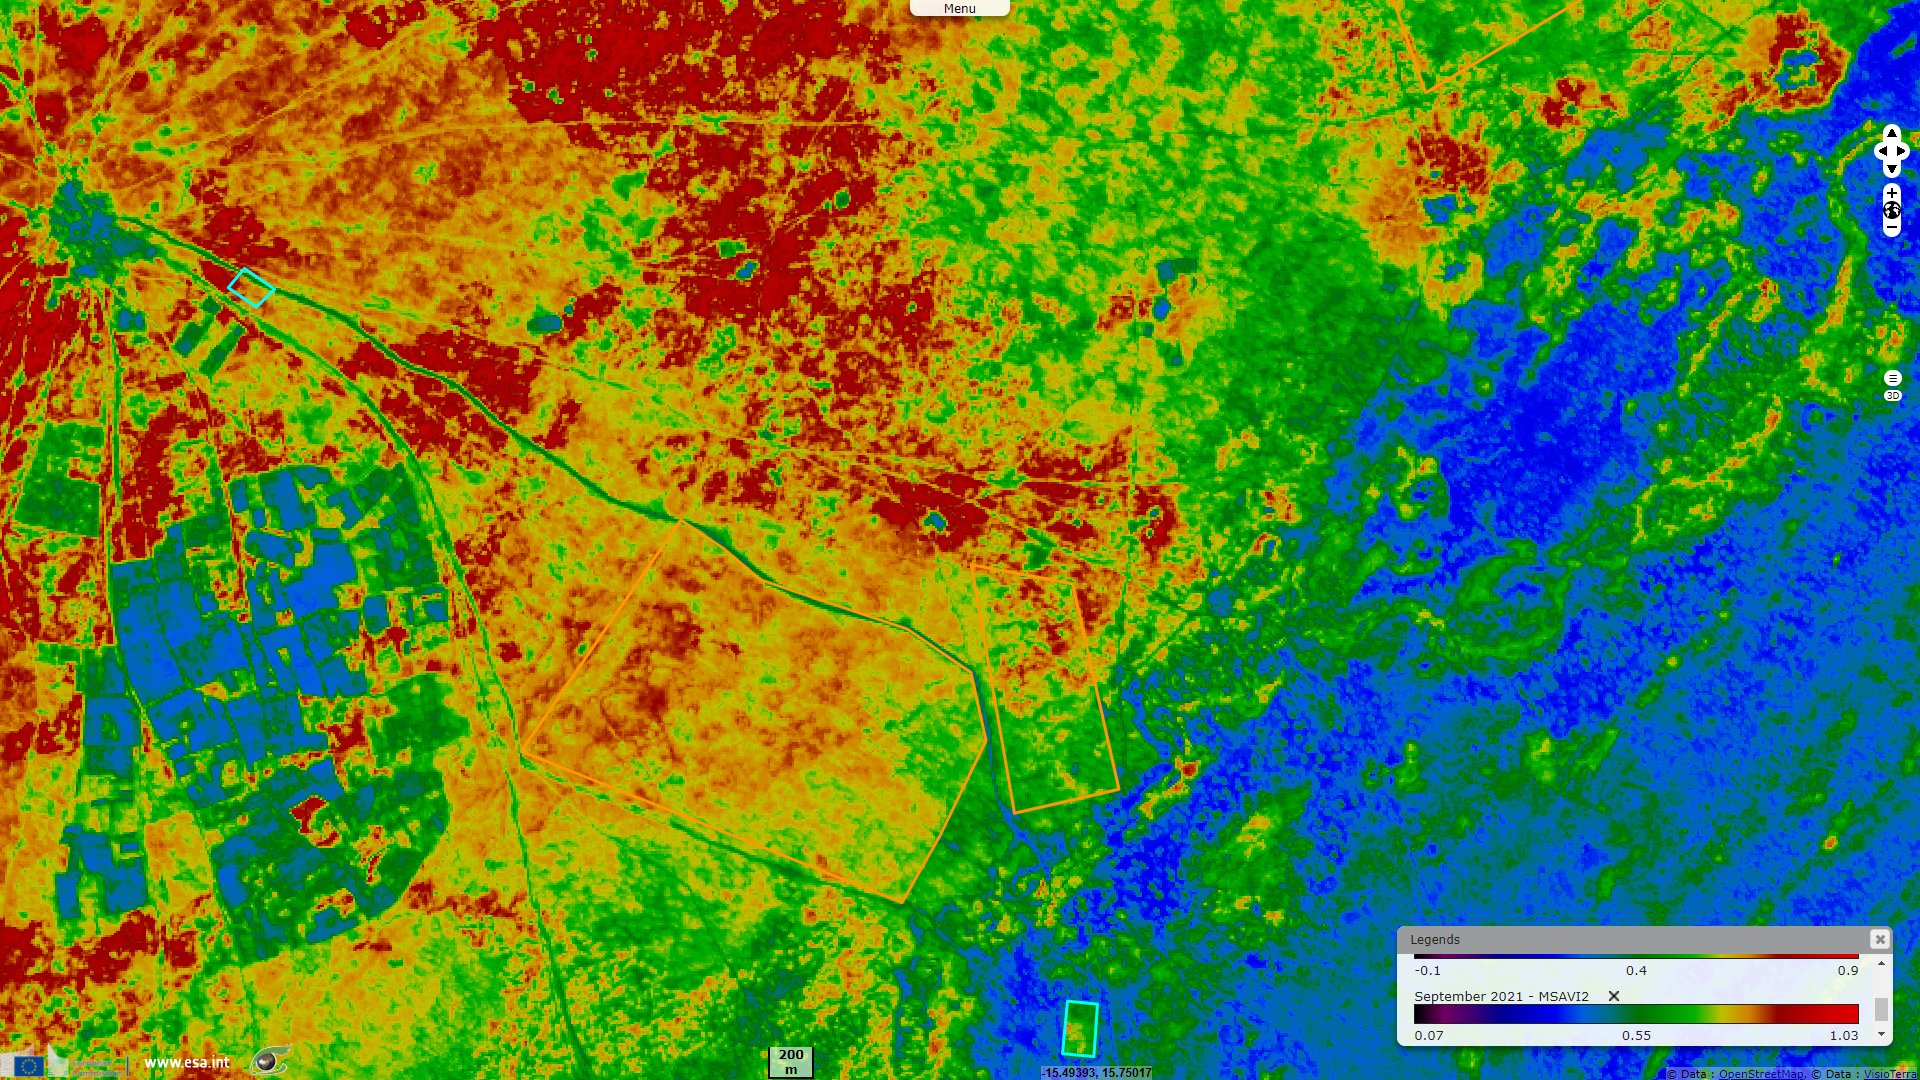
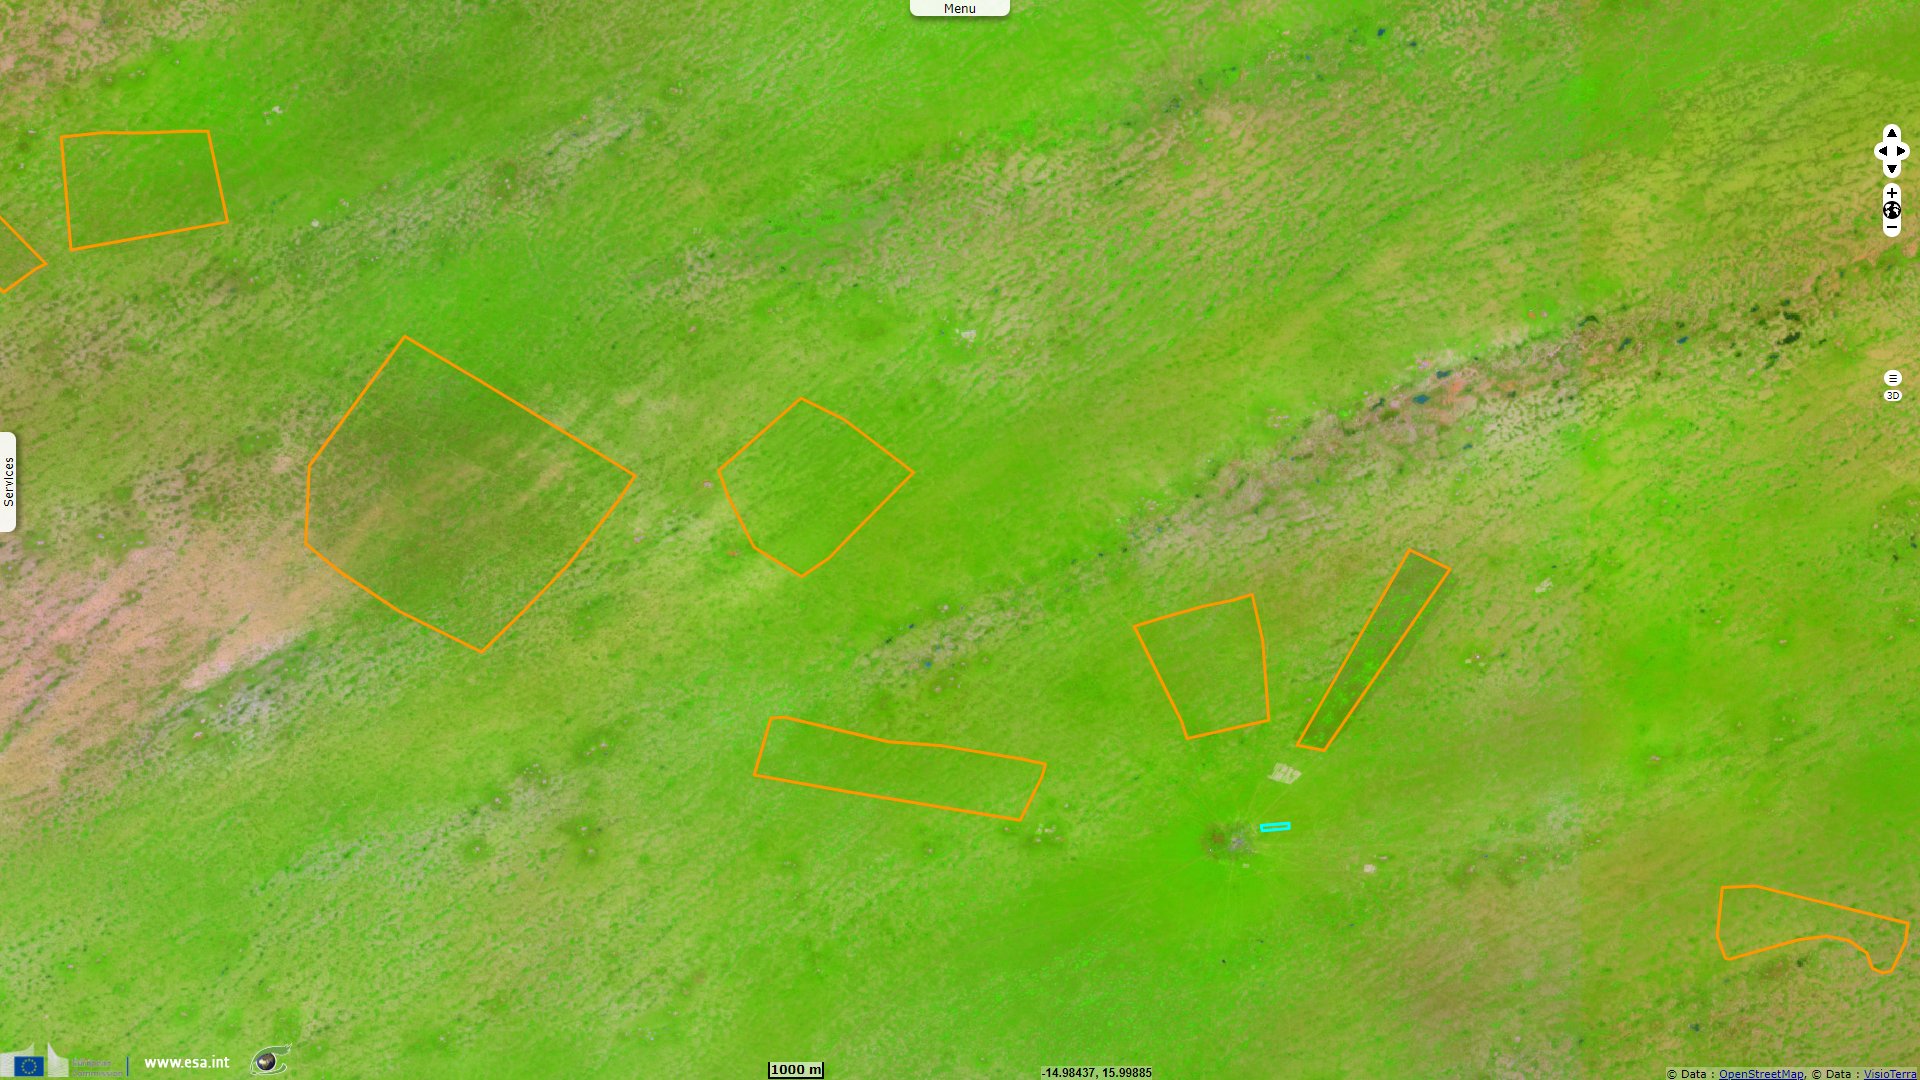
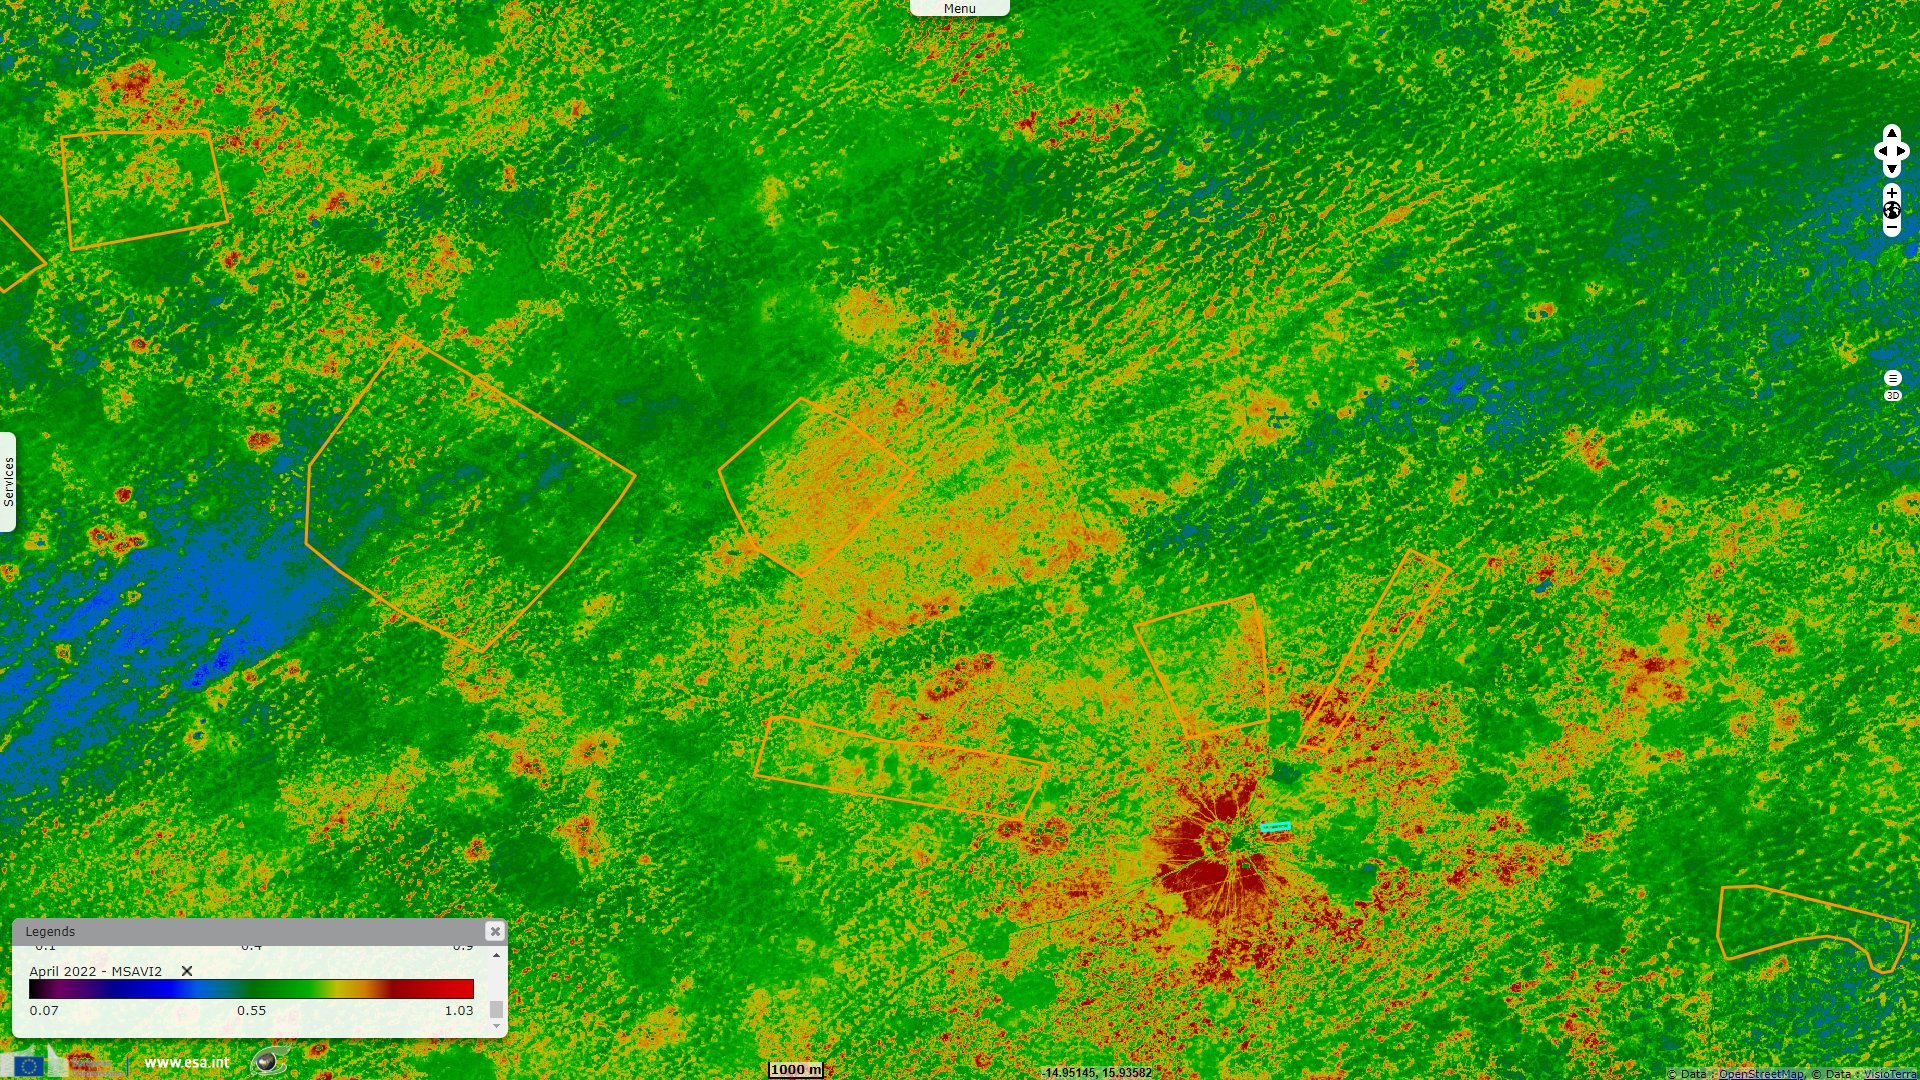
Sentinel-2 MSI acquired on 24 September 2021 at 11:33:21 UTC
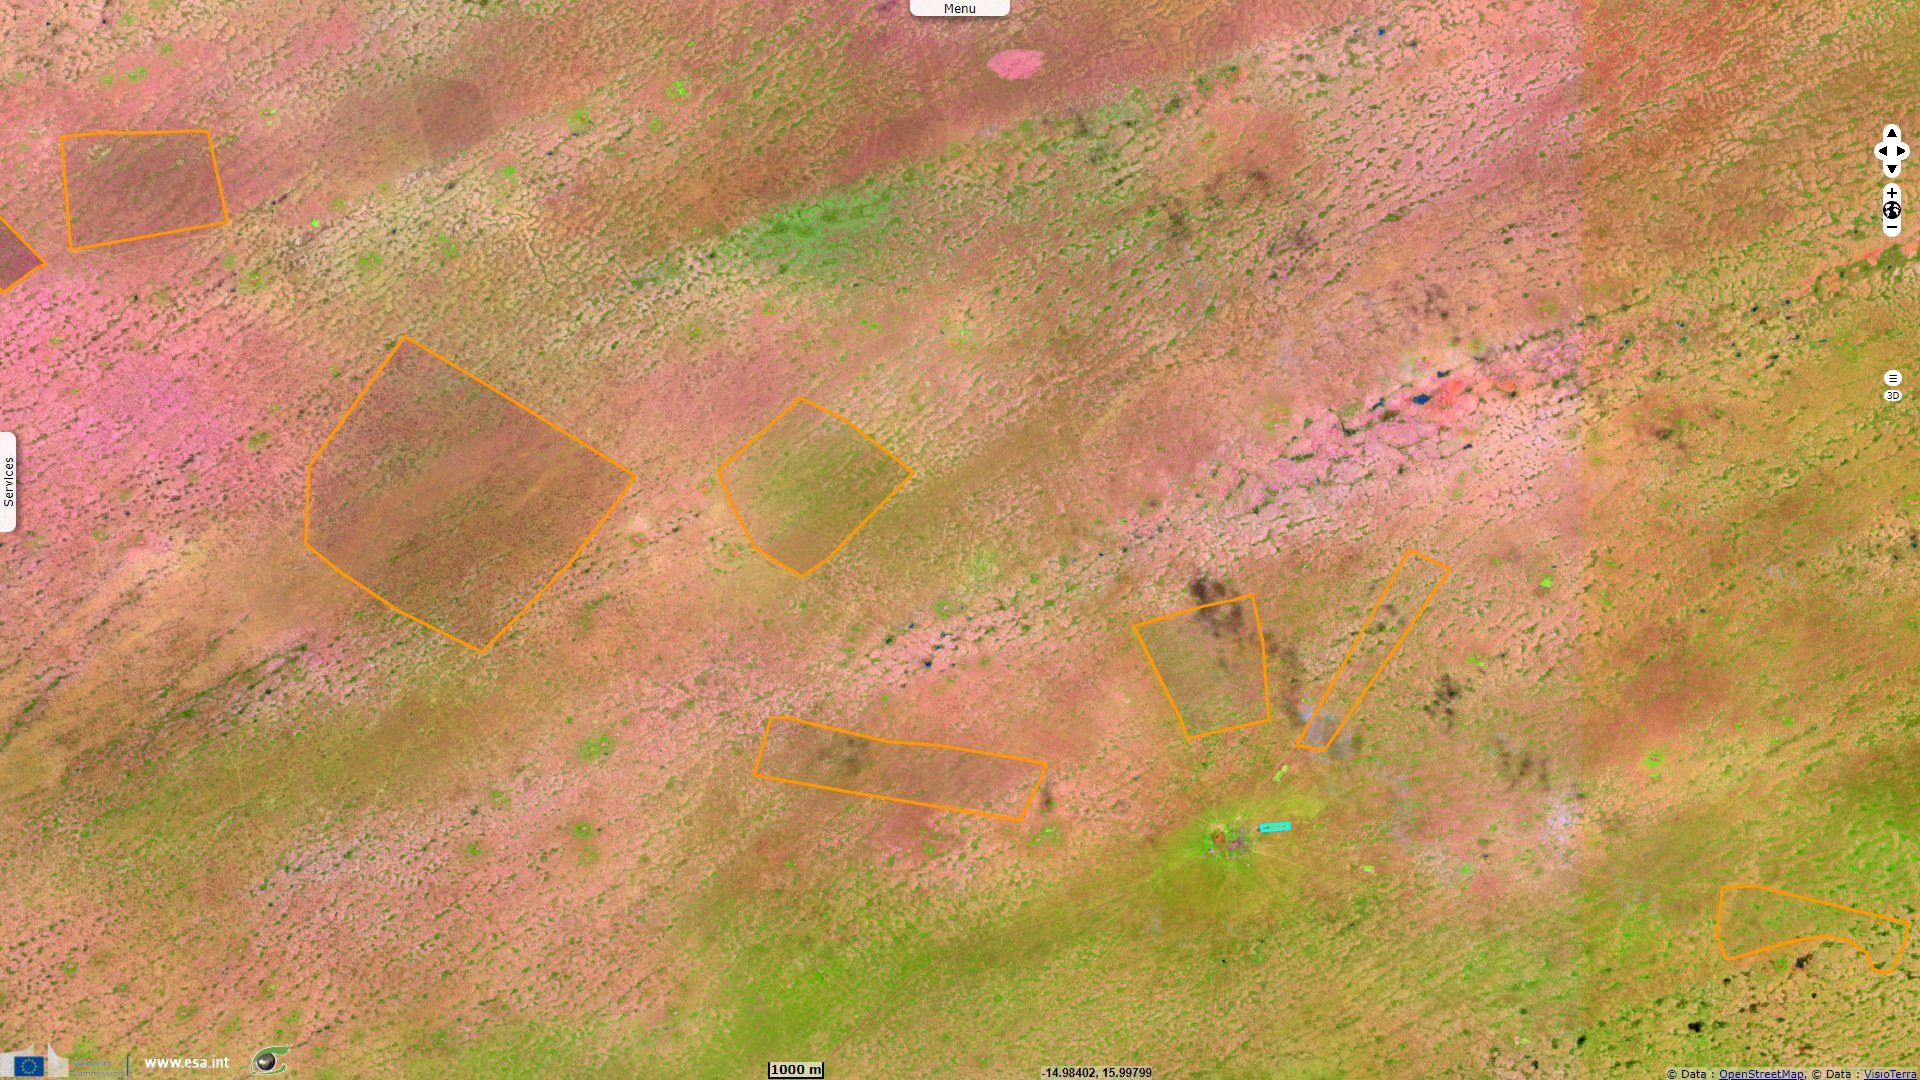
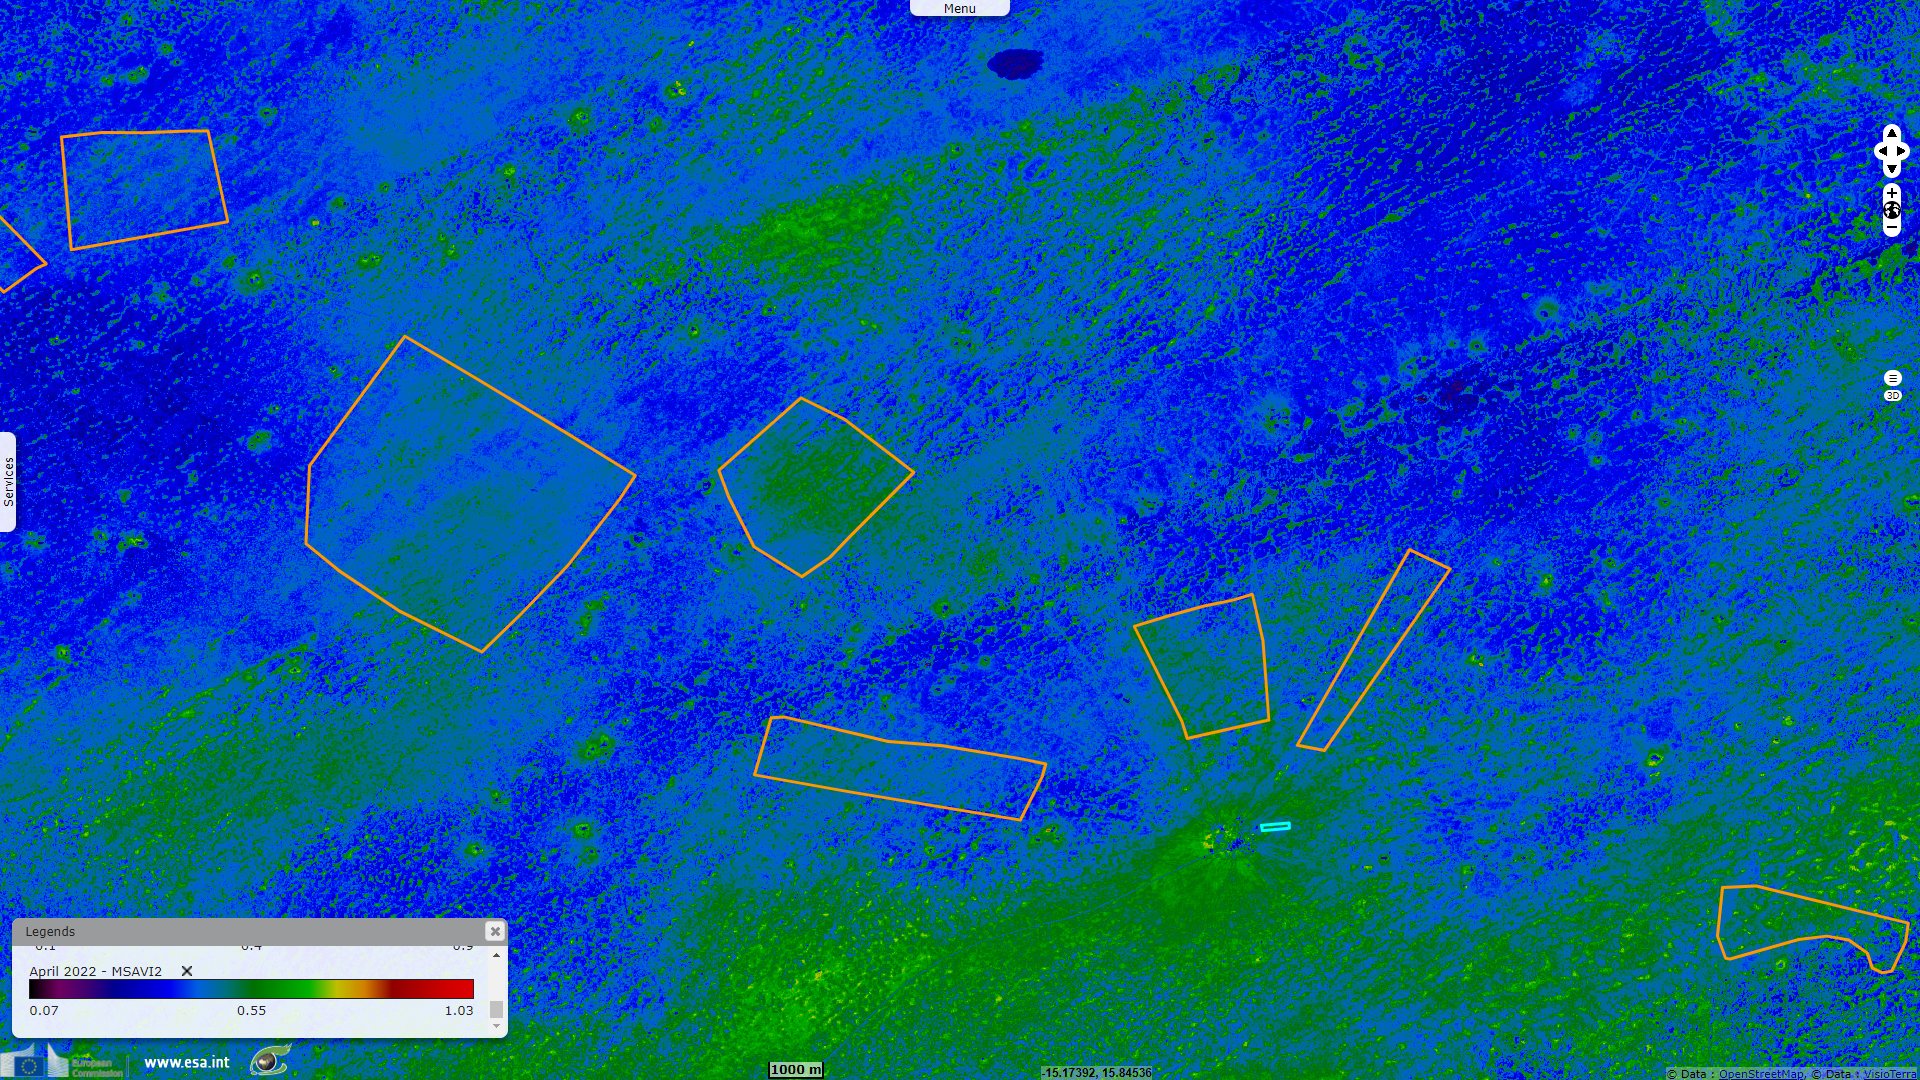
Sentinel-2 MSI acquired on 24 April 2022 at 11:21:09 UTC
Sentinel-2 MSI acquired on 27 September 2016 at 11:21:12 UTC
Sentinel-3 OLCI FR acquired on 19 March 2018 at 10:48:03 UTC
Sentinel-2 MSI acquired on 24 September 2021 at 11:33:21 UTC
Sentinel-2 MSI acquired on 24 April 2022 at 11:21:09 UTC
Keyword(s): Land, desertification, forestry, agriculture, reforestation, Senegal
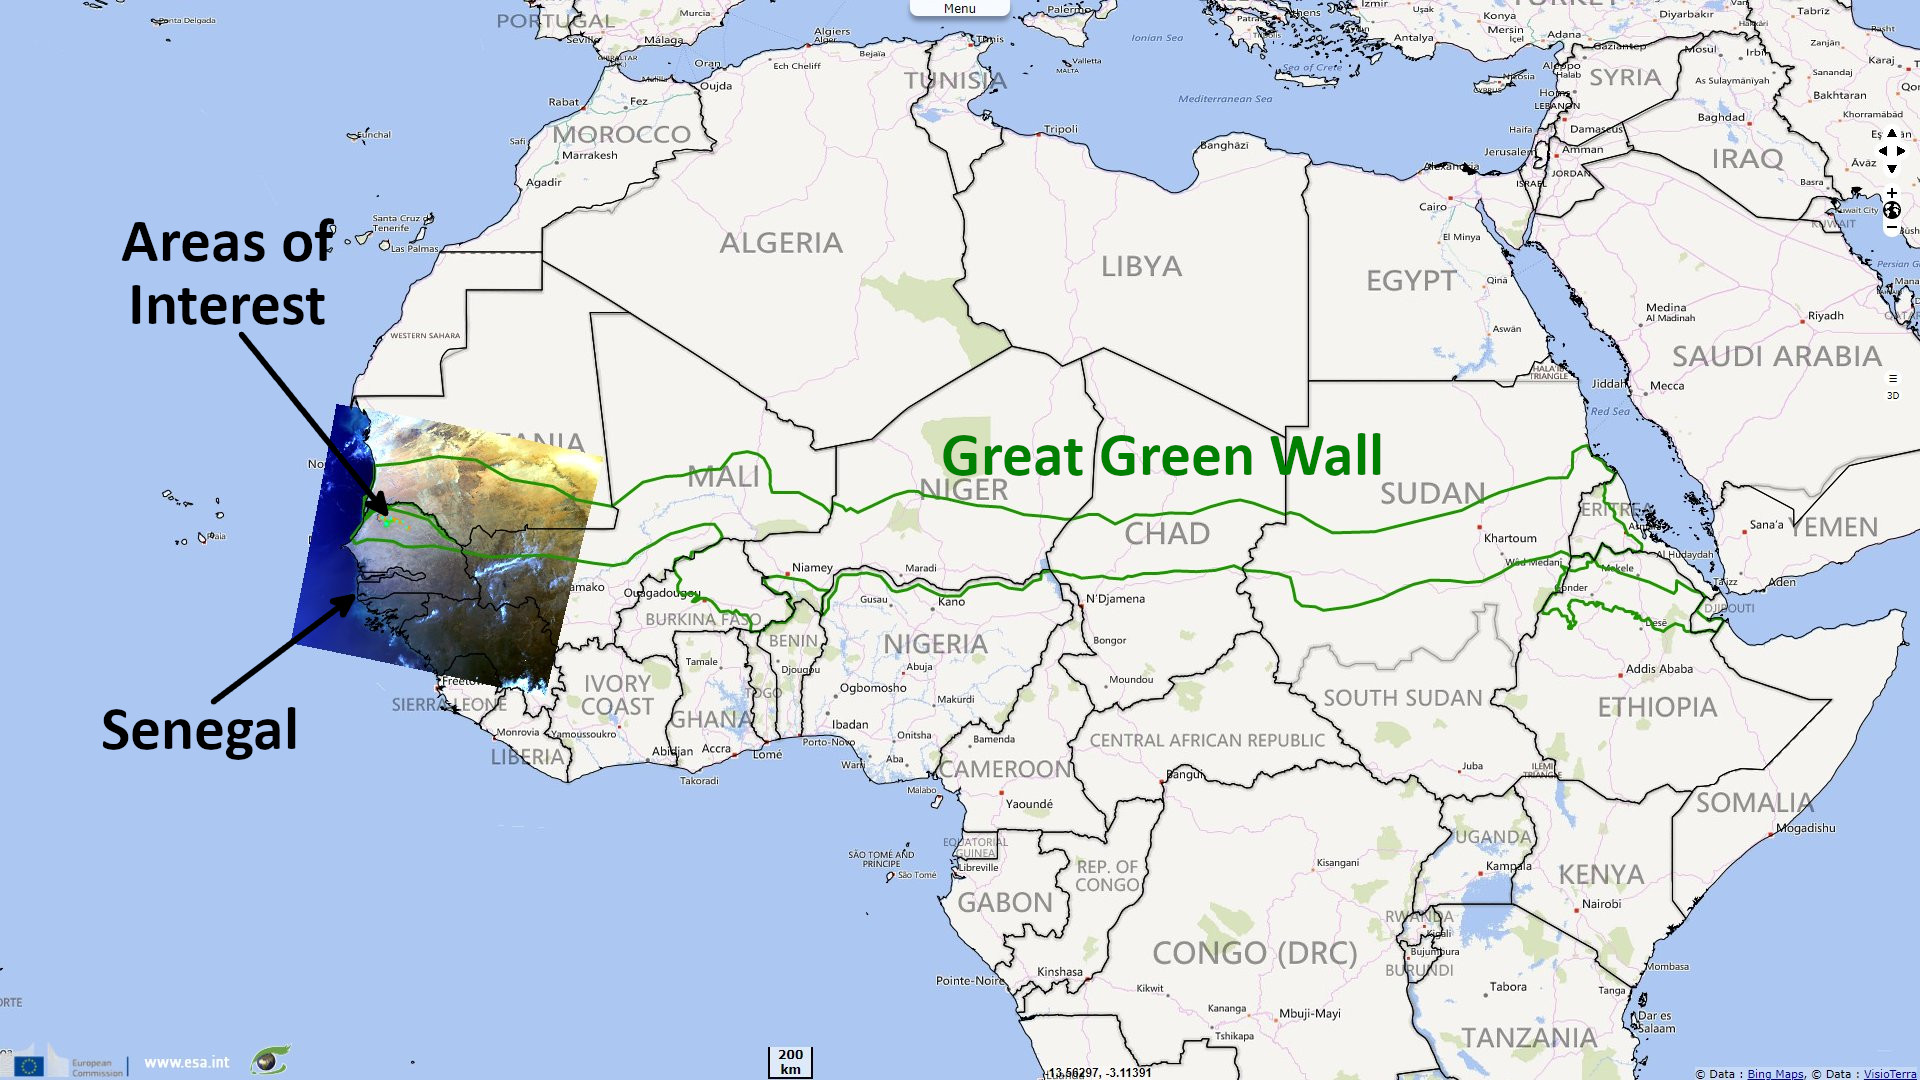
The African Union is "leading the implementing of initiatives that will build the resilience of communities and ecosystems in the dry lands of Africa by combating land degradation, desertification, loss of bio-diversity and climate change through the promotion of Sustainable Land Management and Restoration. Under our Great Green Wall (GGW) initiative the AU is implementing actions to end or reverse land degradation, loss of biodiversity in African drylands and to ensure that ecosystems are resilient to climate change, continue to provide essential services and contribute to human well-being and the elimination of poverty and hunger. The GGW Initiative aims to support over 425 million Africans living in the drylands to embrace sustainable development practices that protect the environment and fight against hunger and poverty.", wrote the African Union.
The website dedicated to this project completes: "Desertification, climate change and land degradation have a strong impact on the main levers of economic growth, social cohesion, stability and security of Sahelo-Saharan States. The recurrence and resurgence of impacts despite various control action plans reminded us of the urgency of a regional approach based on a common commitment and concerted action. The Heads of State and Government of Burkina Faso, Djibouti, Eritrea, Ethiopia, Mali, Mauritania, Niger, Nigeria, Senegal, Sudan and Chad, referring to the decision of the 7th CEN-SAD Summit of June 1 and 2 2005 in Ouagadougou (Burkina Faso) set up the Great Green Wall Initiative (IGGW), endorsed in 2007 by the African Union as the Great Green Wall Initiative for the Sahara and the Sahel."
"In order to provide the Initiative with mechanisms for coordinating, harmonizing actions and supporting the mobilization of resources, the Pan-African Agency for the Great Green Wall (APGMV) was created on June 17, 2010 in N'Djamena, Chad, under the auspices of the African Union and CEN-SAD. The PAGGW is an interstate organization with international legal capacity."
"The mitigative GGW is the expression of cooperation between States in the fight against environmental and climatic challenges based on the ''GMV Concept''. The concept, in its vision and its objectives integrates the three (03) Rio Conventions and is part of the logic of national and sub-regional policies of Restoration-Conservation-Protection of Natural Capital (RCPCN), and Local Economic Development of lands. It globally targets the Saharo-Sahelian zone of the Circum-Sahara, between isohyets 100 and 400 mm."
"The overall objective of Land Management is to stabilize and then reverse the current process of land degradation with a view to achieving Land Degradation Neutrality. Sensitization and supervision of populations to the best techniques and practices for the sustainable management of natural resources and land and rural production systems most suited to the land are given priority. This is essentially based on the Operational Information and Communication System (DOIC), the creation and monitoring of experimental perimeters at the CADT level."
"The Logical Framework of Intervention provides for a framework of coherence, a model of local governance and a framework of orientations and Monitoring-Evaluation of itineraries and impacts through a multi-modular system including a Geographic Information System, a Climate Observatory /LED and an Early Warning and Response System."
"The financing of the Five-Year Plan of Activities (PAQ) 2016-2020 estimated at approximately three (03) billion US dollars is the subject of a specific GGW financial intervention plan, accompanied by a mobilization strategy through mechanisms and innovative instruments focused on climate finance. It is a GGW Carbon Bank, a GGW Fund for Climate Adaptation and Resilience and Local Development, accreditation for Climate Funds and admission to an Executing Agency for implementation activities. implementation of the GGW. In support of these mechanisms and instruments, a round table of technical and financial partners is planned."
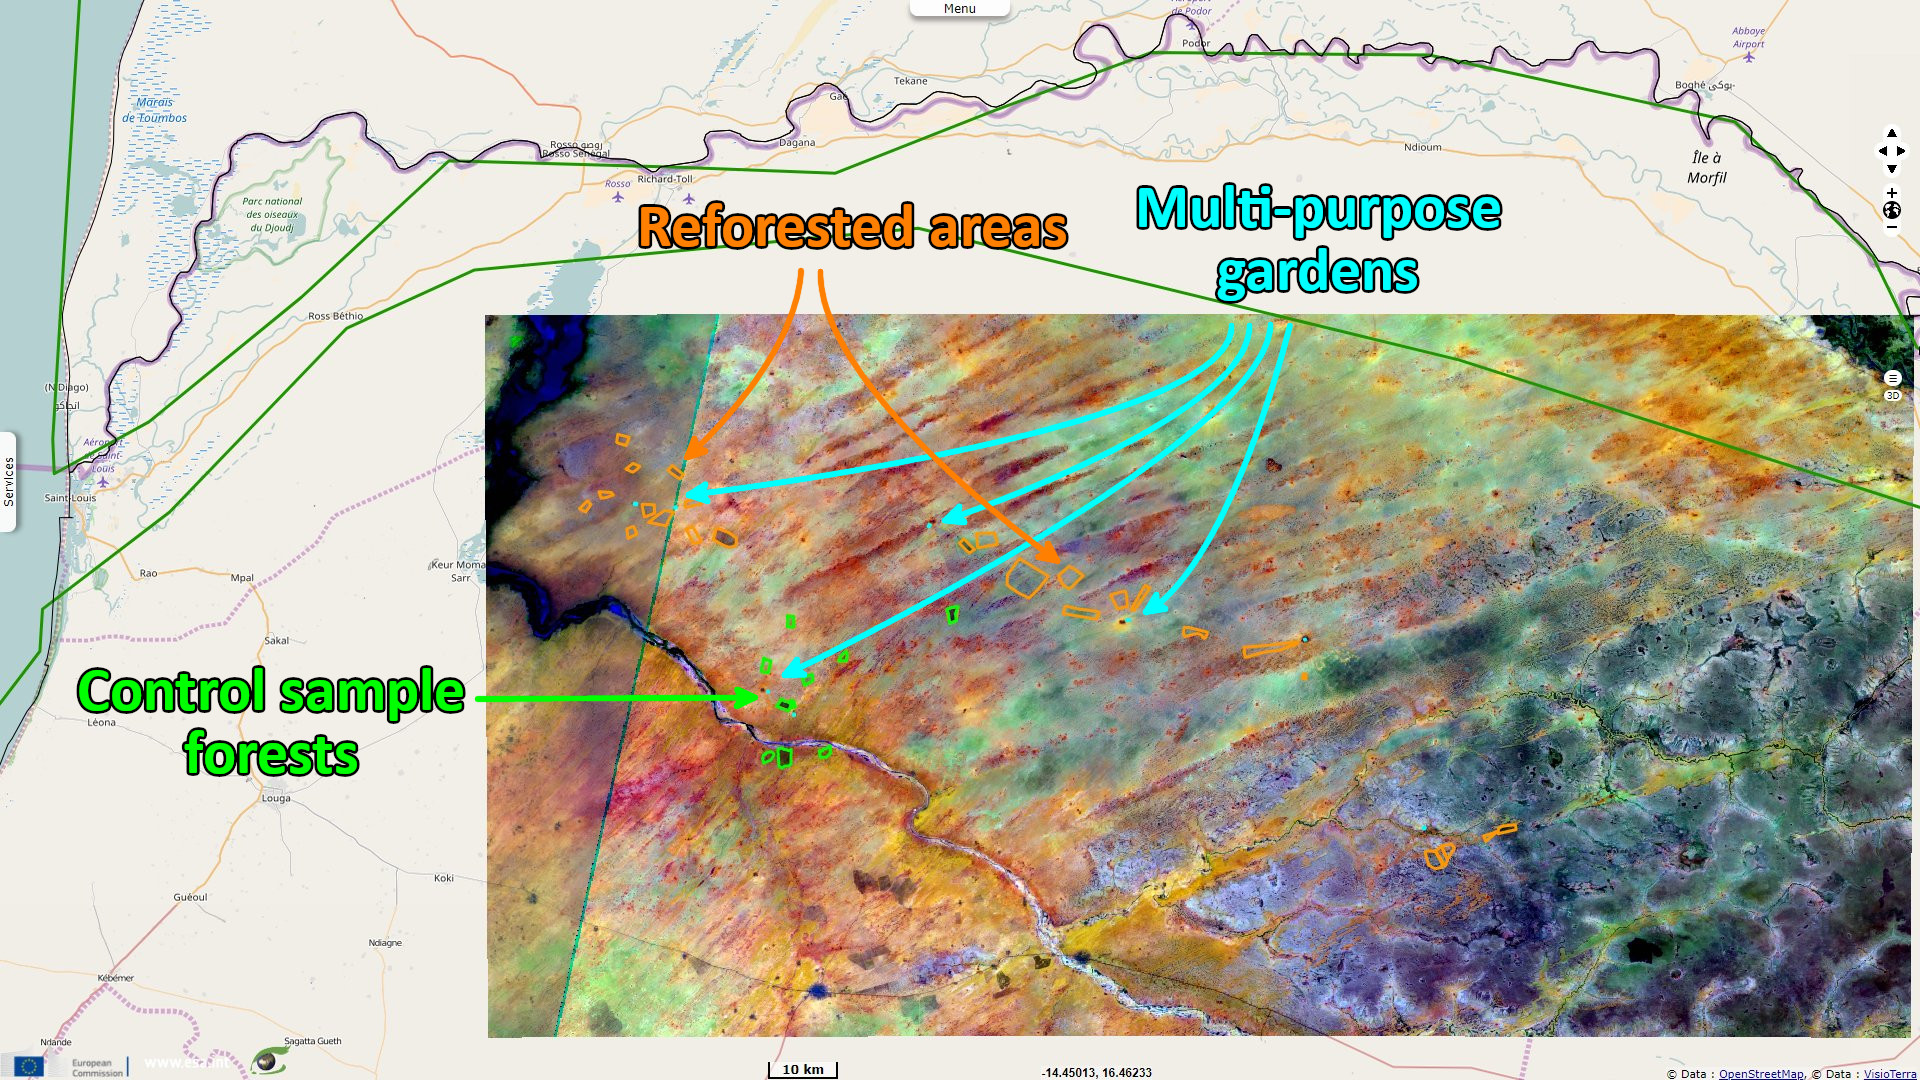
As a pioneer country in the implementation of the Great Green Wall, Senegal plants nearly 2 million Senegal Acacia trees every year, especially in the north of the country. This tree species is particularly well adapted to the arid climate. And some positive results are already beginning to be seen, particularly in terms of fauna, with some extinct birds reappearing.
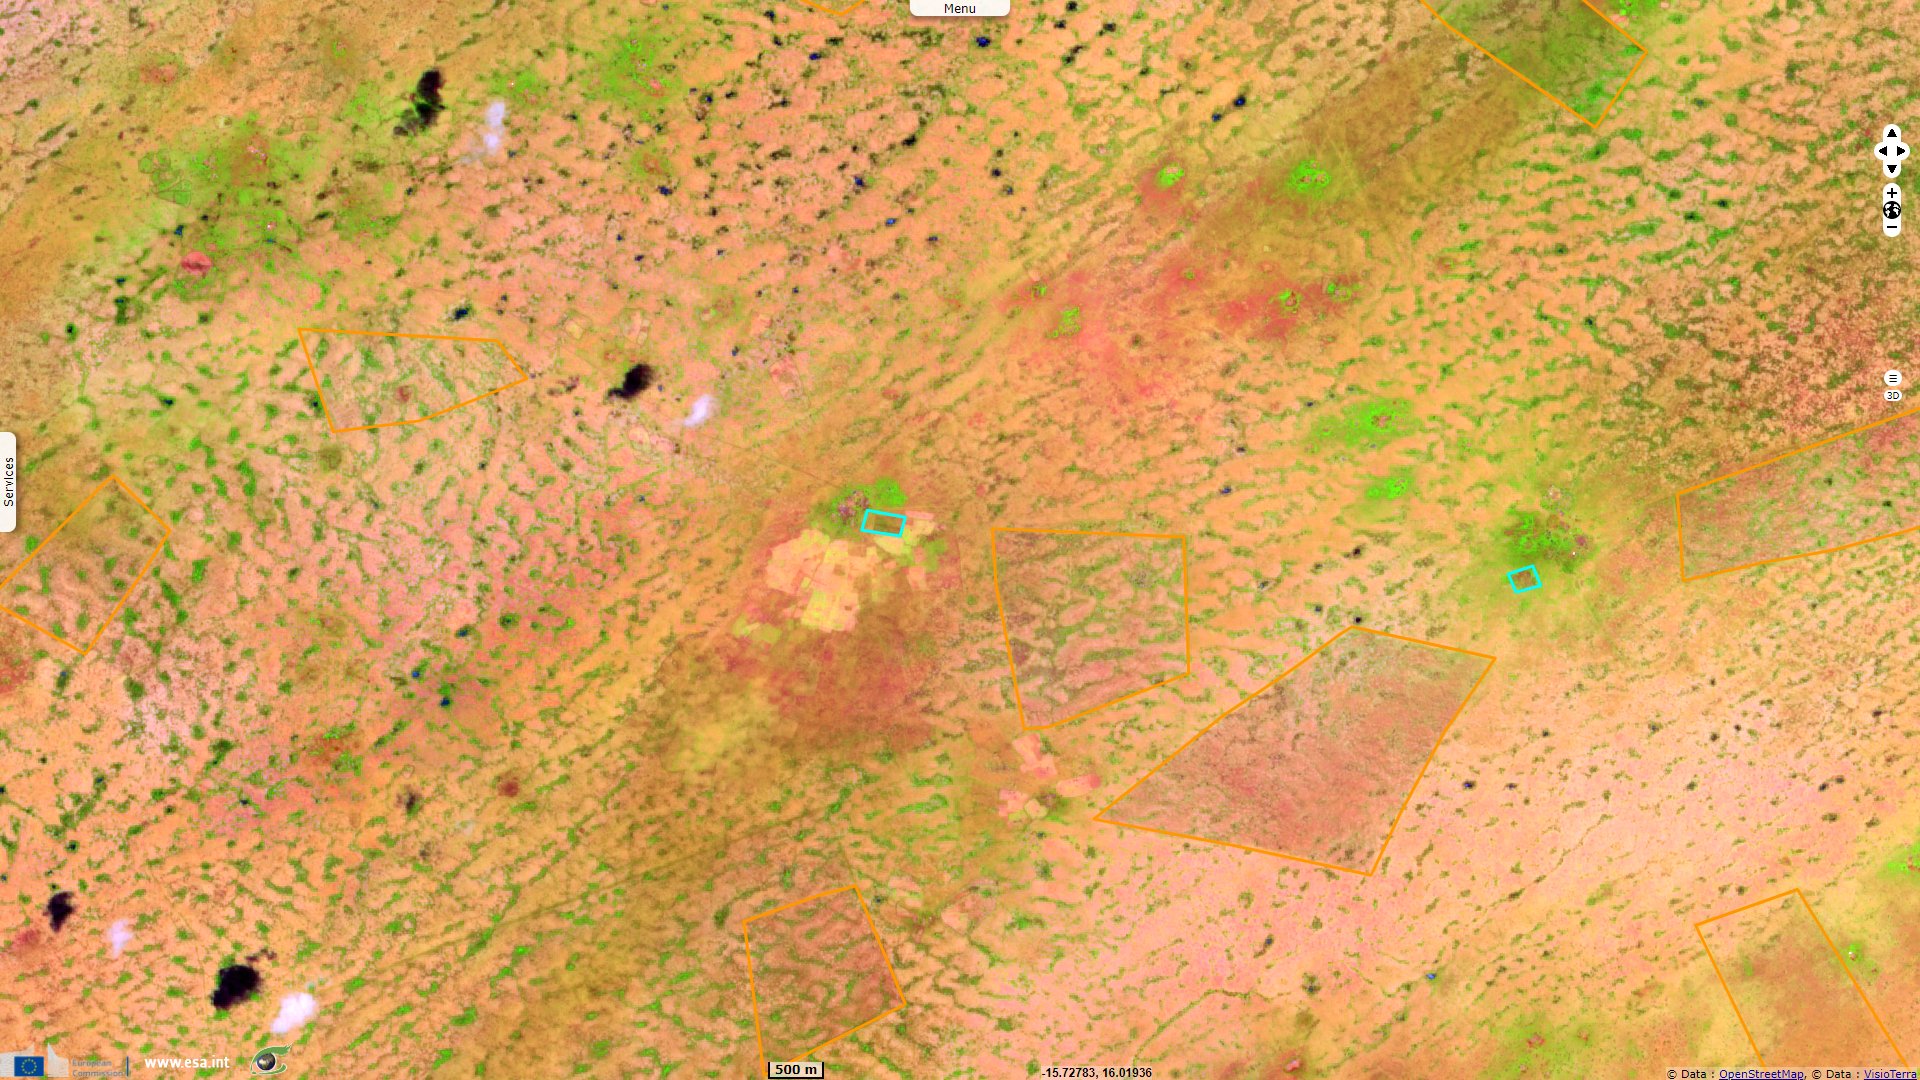
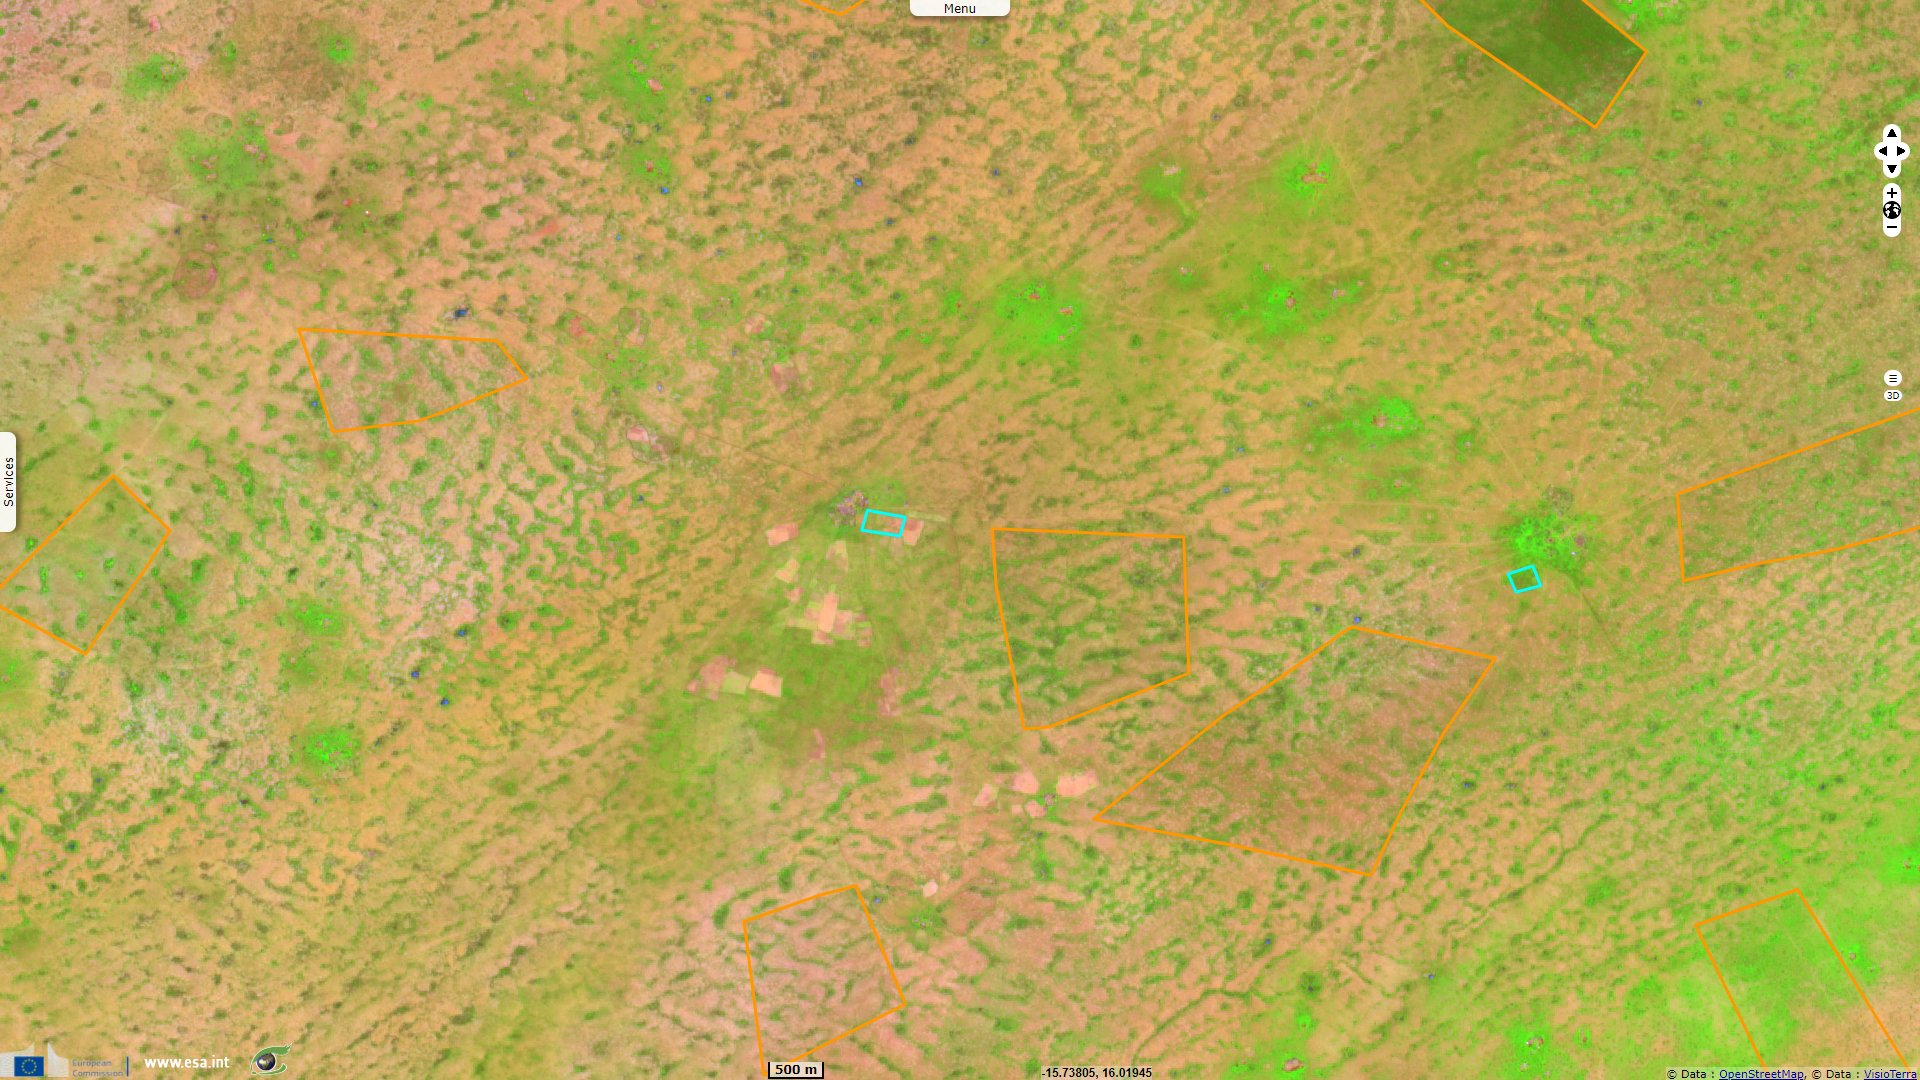
Multipurpose gardens are much smaller entities than reforestation plots. They are often located near towns or villages. These multi-purpose gardens are rendered at a larger scale (100 m scale), whereas the reforestation plots in the previous figures were rendered at a smaller scale (200 m scale). These gardens produce previously unknown fruits and vegetables, not all of which require watering. This is a new source of income for local people, for whom water scarcity is a major problem.
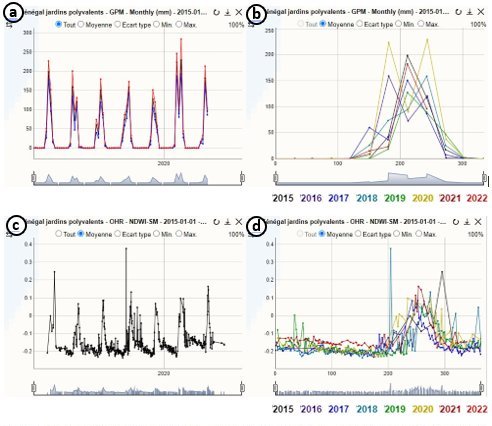
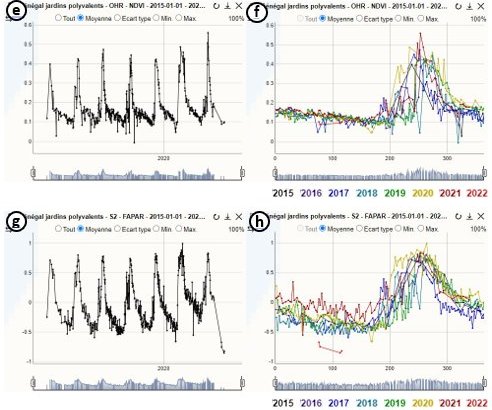
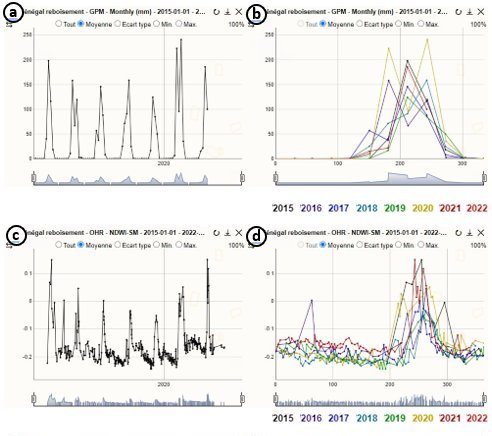
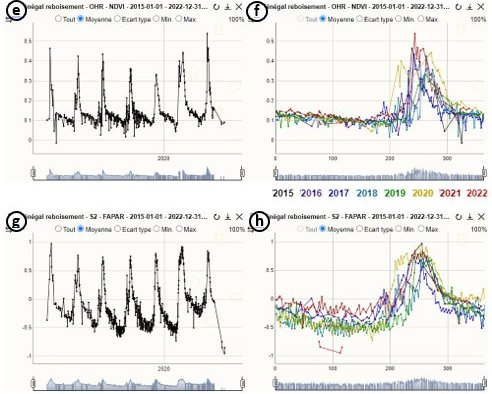
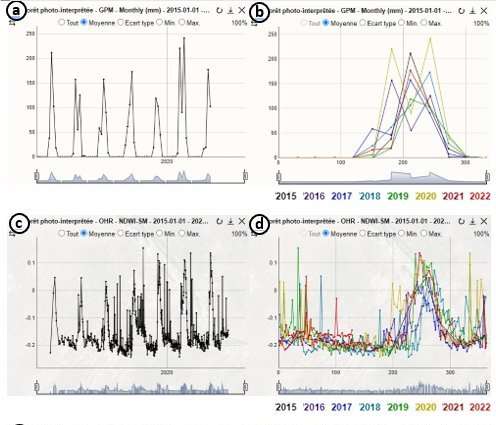
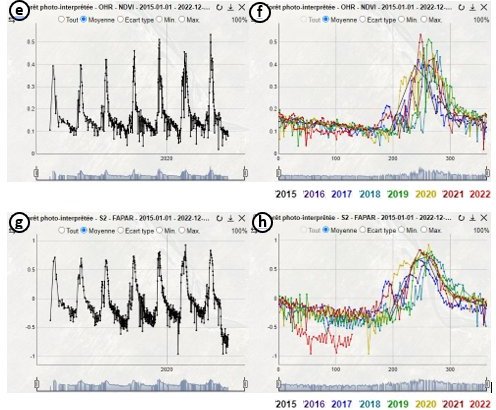
Time series analysis performed over several multipurpose gardens in Senegal using precipitations, a Sentinel-2 soil moisture index and two Sentinel-2 vegetation indices.
- a: GPM monthly precipitations time series calculated over the parcels from 2015 to 2022, chronological view.
- b: GPM monthly precipitations time series calculated over the parcels from 2015 to 2022, seasonal view.
- c: Normalized Difference Water Index - Soil moisture (NDWI-SM) time series calculated over the parcels from 2015 to 2022, chronological view.
- d: NDWI-SM time series calculated over the parcels from 2015 to 2022, seasonal view.
- e: Normalized Difference Vegetation Index (NDVI) time series calculated over the parcels from 2015 to 2022, chronological view.
- f: NDVI time series calculated over the parcels from 2015 to 2022, seasonal view.
- g: Fraction of Absorbed Photosynthetically Active Radiation (FAPAR) time series calculated over the parcels from 2015 to 2022, chronological view.
- h: FAPAR time series calculated over the parcels from 2015 to 2022, seasonal view.
Time series analysis performed over several reforesting parcels in Senegal using precipitations, a Sentinel-2 soil moisture index and two Sentinel-2 vegetation indices.
- a: GPM monthly precipitations time series calculated over the parcels from 2015 to 2022, chronological view.
- b: GPM monthly precipitations time series calculated over the parcels from 2015 to 2022, seasonal view.
- c: Normalized Difference Water Index - Soil moisture (NDWI-SM) time series calculated over the parcels from 2015 to 2022, chronological view.
- d: NDWI-SM time series calculated over the parcels from 2015 to 2022, seasonal view.
- e: Normalized Difference Vegetation Index (NDVI) time series calculated over the parcels from 2015 to 2022, chronological view.
- f: NDVI time series calculated over the parcels from 2015 to 2022, seasonal view.
- g: Fraction of Absorbed Photosynthetically Active Radiation (FAPAR) time series calculated over the parcels from 2015 to 2022, chronological view.
- h: FAPAR time series calculated over the parcels from 2015 to 2022, seasonal view.
Time series analysis performed over several control panel forests in Senegal using precipitations, a Sentinel-2 soil moisture index and two Sentinel-2 vegetation indices.
- a: GPM monthly precipitations time series calculated over the parcels from 2015 to 2022, chronological view.
- b: GPM monthly precipitations time series calculated over the parcels from 2015 to 2022, seasonal view.
- c: Normalized Difference Water Index - Soil moisture (NDWI-SM) time series calculated over the parcels from 2015 to 2022, chronological view.
- d: NDWI-SM time series calculated over the parcels from 2015 to 2022, seasonal view.
- e: Normalized Difference Vegetation Index (NDVI) time series calculated over the parcels from 2015 to 2022, chronological view.
- f: NDVI time series calculated over the parcels from 2015 to 2022, seasonal view.
- g: Fraction of Absorbed Photosynthetically Active Radiation (FAPAR) time series calculated over the parcels from 2015 to 2022, chronological view.
- h: FAPAR time series calculated over the parcels from 2015 to 2022, seasonal view.
The views expressed herein can in no way be taken to reflect the official opinion of the European Space Agency or the European Union.
Contains modified Copernicus Sentinel data 2026, processed by VisioTerra.
Contains modified Copernicus Sentinel data 2026, processed by VisioTerra.
| More on European Commission space: |  |
 |
 |
||||
| More on ESA: | |
|
|
S-1 website | S-2 website | S-3 website | |
| More on Copernicus program: | |
|
|
Scihub portal | Cophub portal | Inthub portal | Colhub portal |
| More on VisioTerra: | |
|
|
Sentinel Vision Portal | Envisat+ERS portal | Swarm+GOCE portal | CryoSat portal |