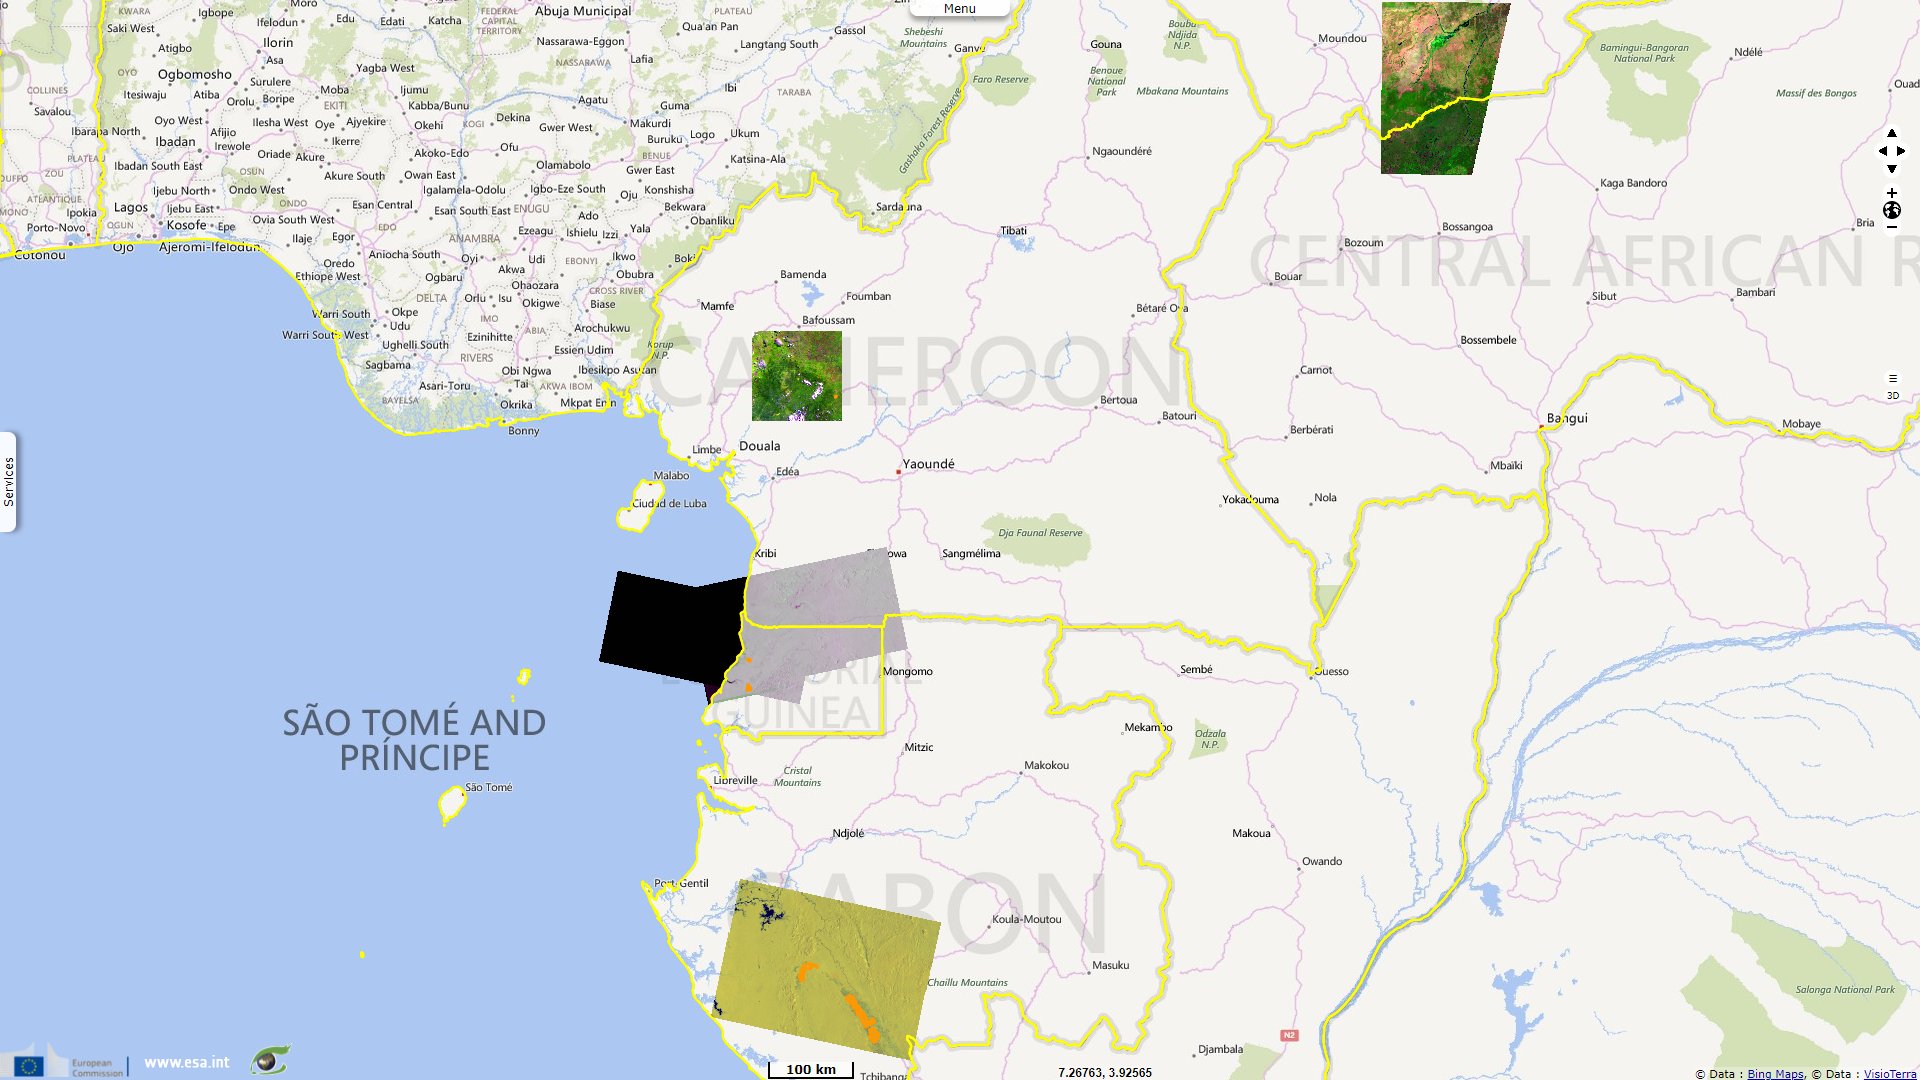
Monitoring and assessment of Central African forests
Sentinel-1 CSAR IW acquired on 11 June 2015 at 17:35:31 UTC
Sentinel-2 MSI acquired on 23 November 2015 at 09:13:02 UTC
...
Sentinel-2 MSI acquired on 26 November 2021 at 09:12:19 UTC
Sentinel-1 CSAR IW acquired on 28 November 2021 from 04:39:18 to 04:39:43 UTC
Sentinel-2 MSI acquired on 23 November 2015 at 09:13:02 UTC
...
Sentinel-2 MSI acquired on 26 November 2021 at 09:12:19 UTC
Sentinel-1 CSAR IW acquired on 28 November 2021 from 04:39:18 to 04:39:43 UTC
Keyword(s): Forestry, deforestation, agriculture, Gabon, Cameroon, Equatorial Guinea, Chad.
The identified end users of SEFAC "are primarily national structures working on the environment, notably the General Forestry Directorates, NGOs, research laboratories, local authorities and ministries responsible for designing public policies on forest and water resource management." For these end users, the expected results are:
- "Spatial indicators;
- Cartographic products and publication of the State of Forests and Protected Areas with a focus on consolidated information from Earth Observation (EO) data;
- Sharing knowledge with users at regional level to optimise decision making through the establishment of a GEOportal;
- Capacity building in remote sensing and especially in the use of the different Sentinel data;
- Publication of the State of Forests and Protected Areas, which promotes the sustainability of data collection and processing, for informed decision-making".
In order to reach these goals, several activities are managed:
- "Production of basic data and indicators on Central African forests (land cover, forest cover, biomass, wetlands, mining activities, agricultural activities);
- Data organisation and dissemination (database, spatial data infrastructure);
- Popularisation and appropriation of the products and services developed (website, SMS alert system, mobile application, user training, communication media, communication operations);
- Training and capacity building (student training, continuous training of staff, improvement of university teaching)".
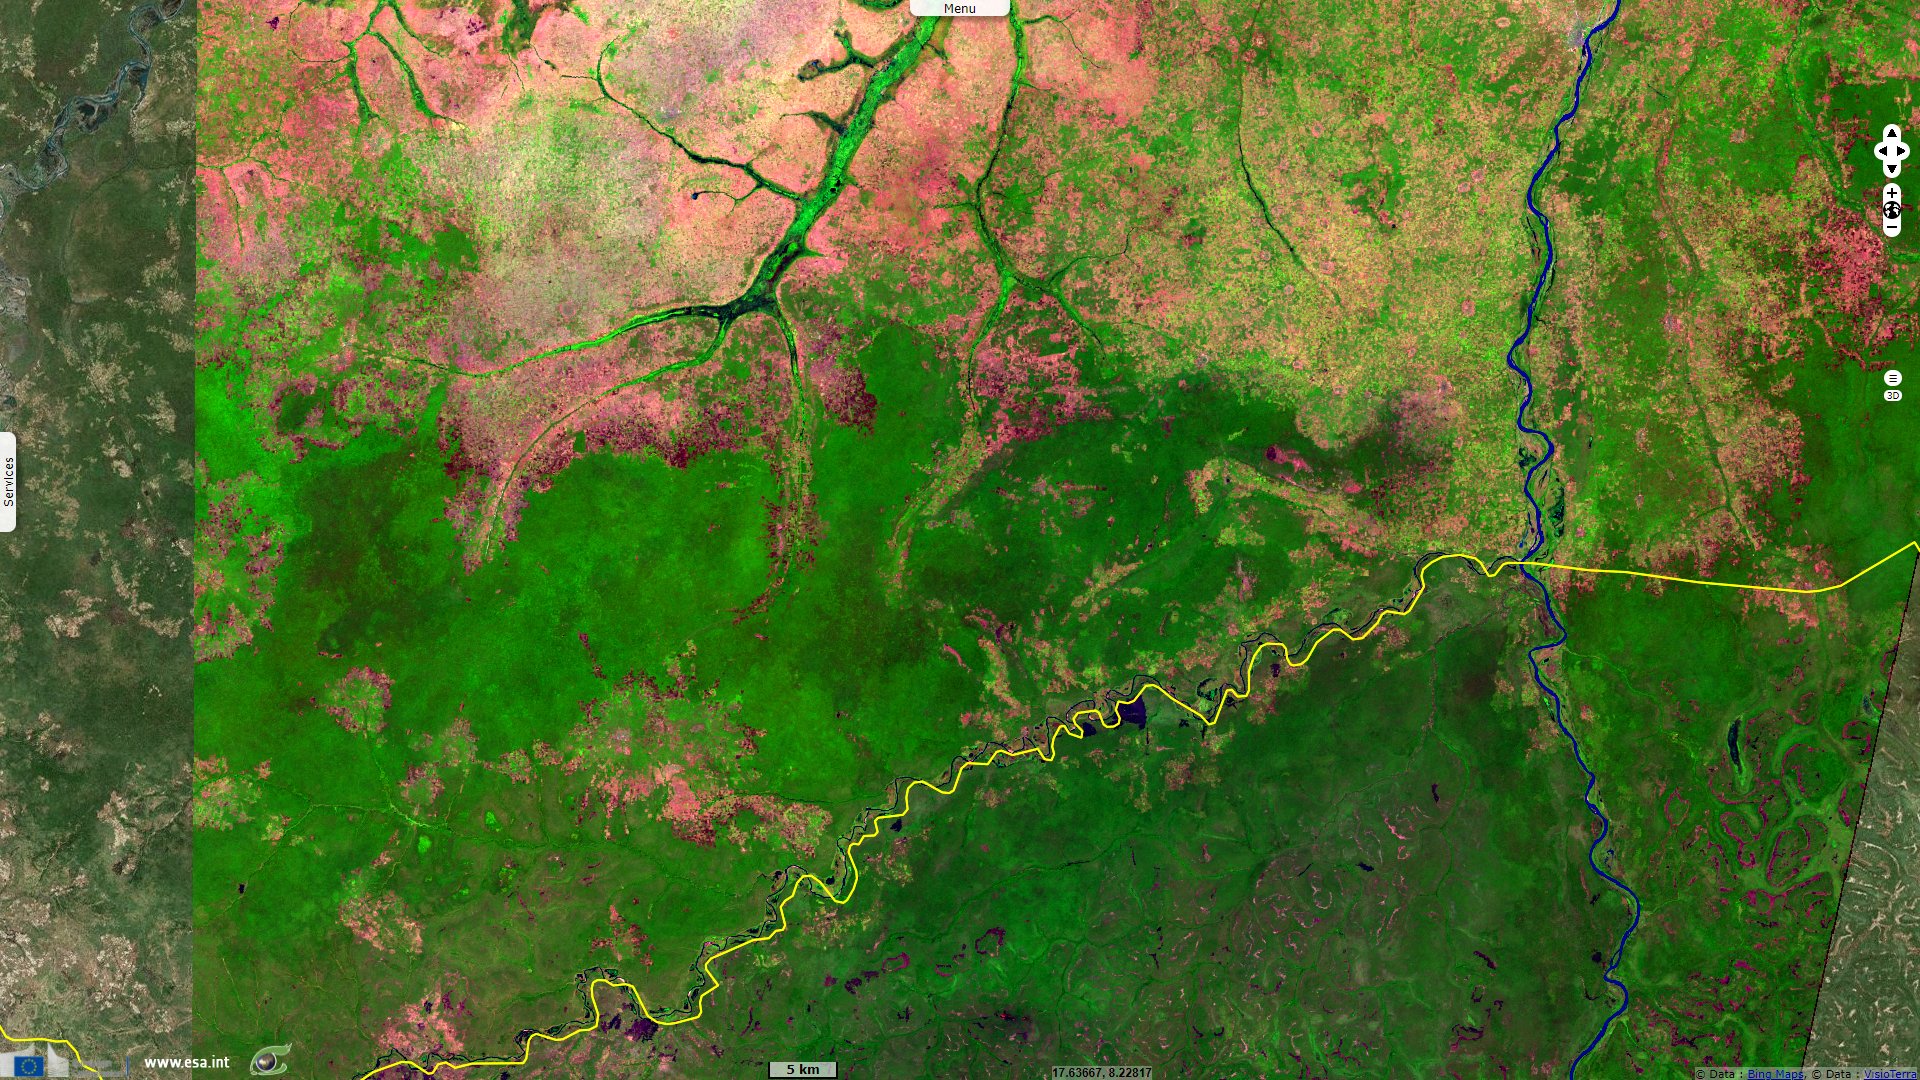
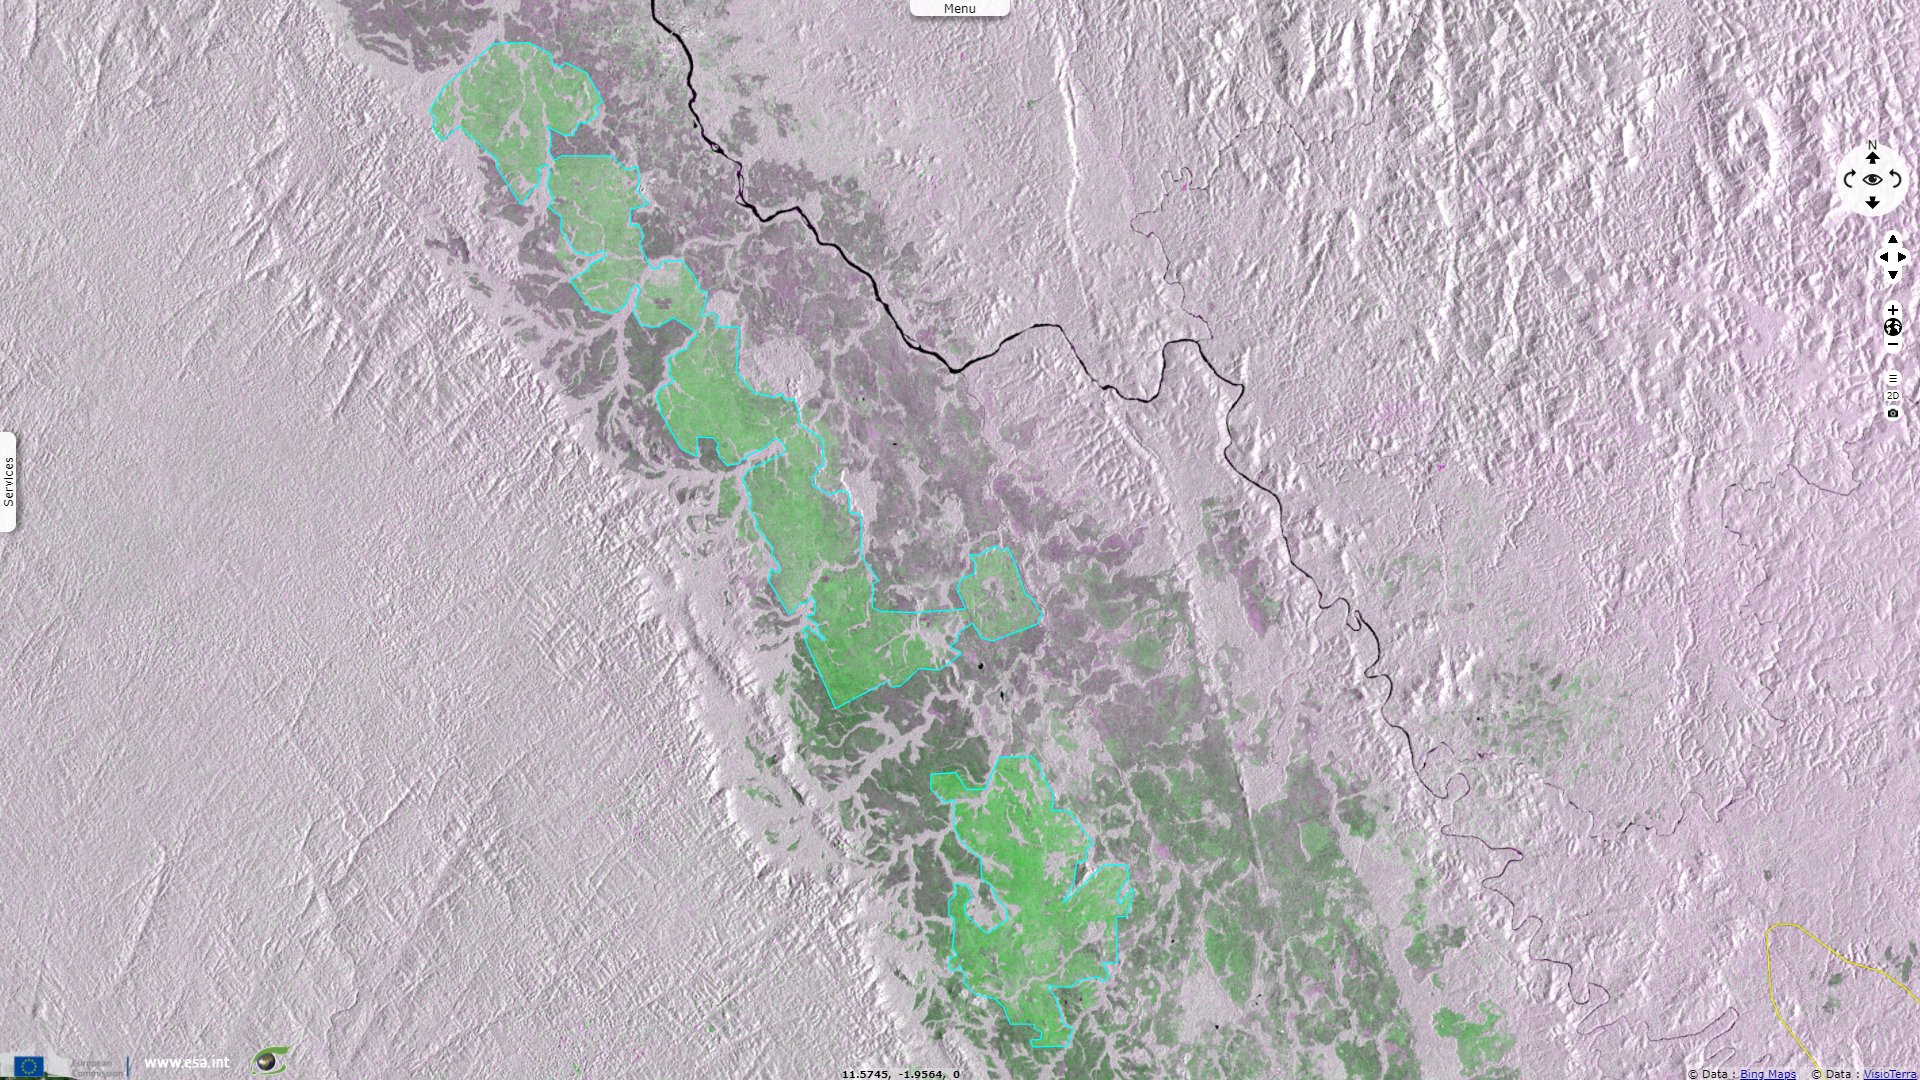
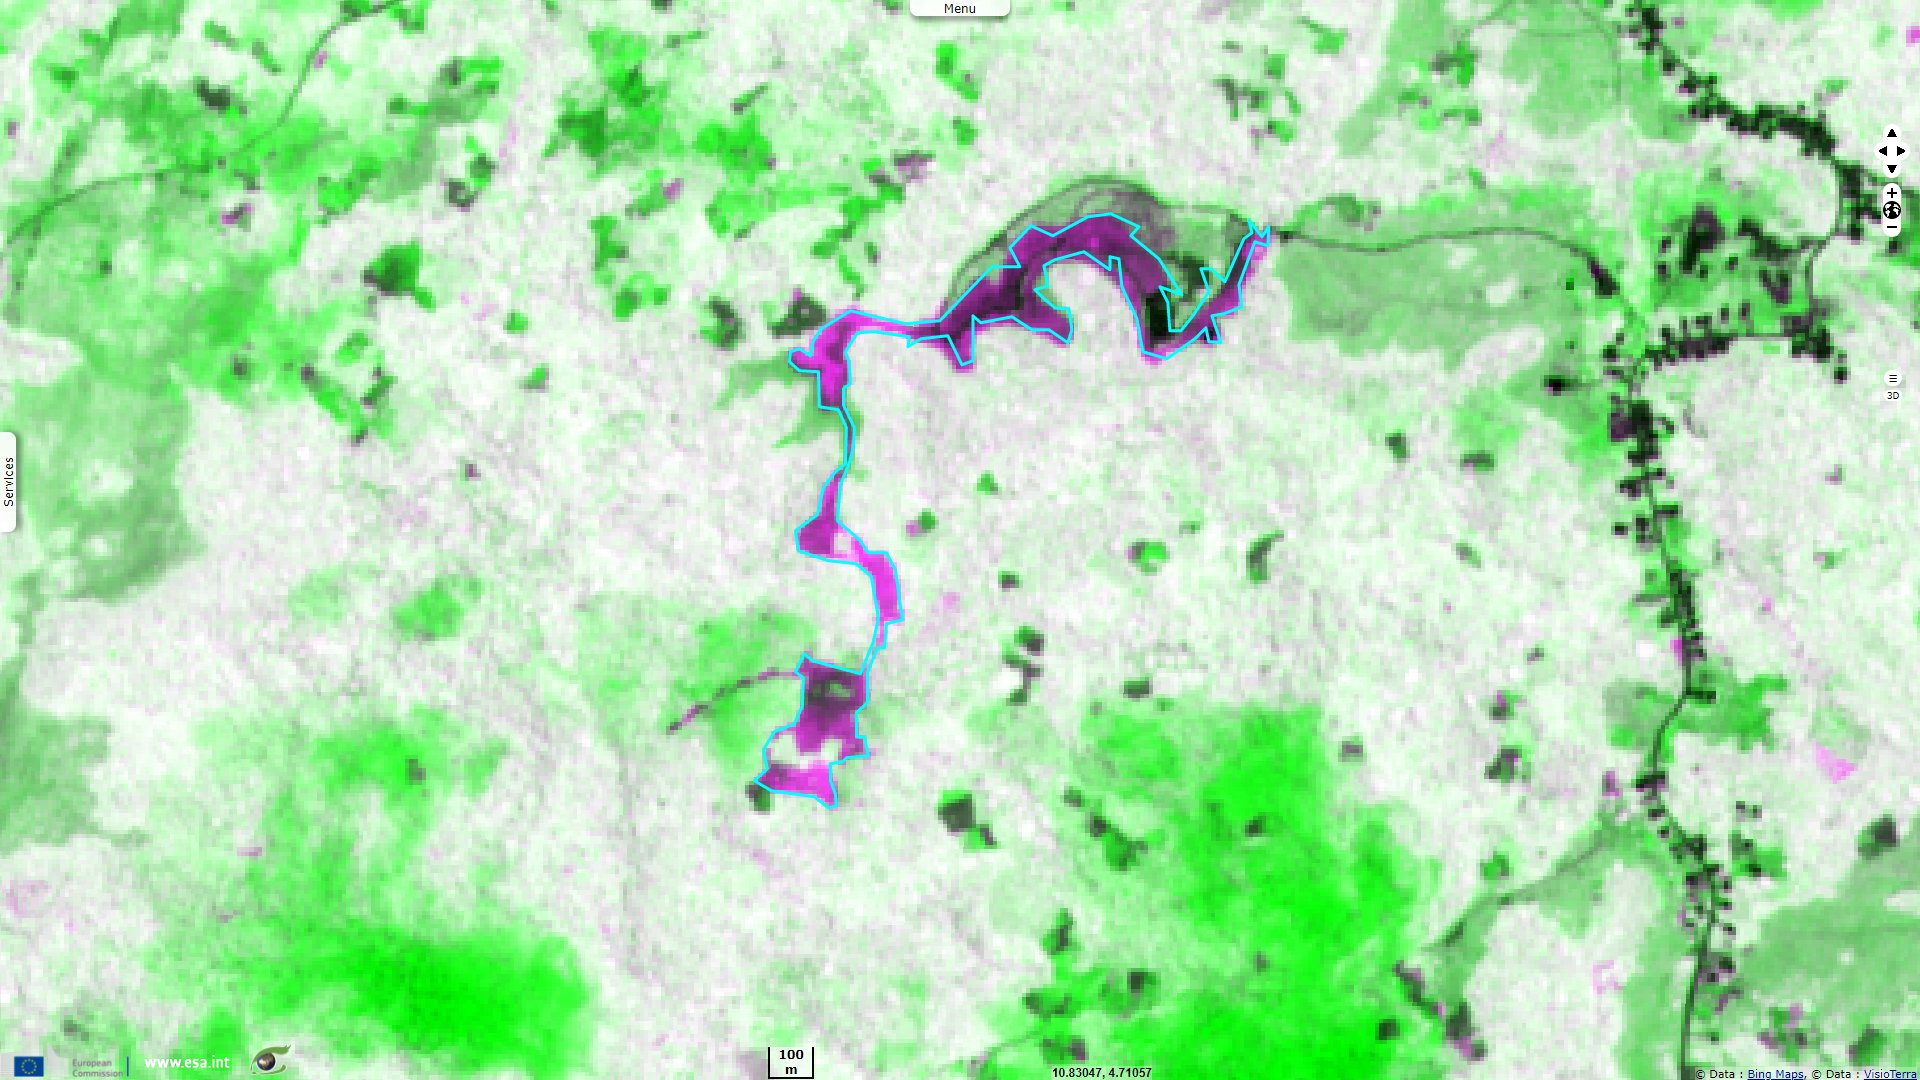
This multitemporal view shows the Normalized Difference Vegetation Index (NDVI) computed on the Sentinel-2 image acquired on 23 November 2015 in the red and blue bands, on the Sentinel-2 image acquired on 26 November 2021 in the green band.
In the areas where the vegetation cover has decreased between these five years, the NDVI decreases in the green band which shows in purple in the composite above. Where the vegetation has increased, it shows in green.
Large areas, mostly on the Chadian side of the border, appear in purple, indicating the a loss in the forested areas. Since these images have been acquired before the fire season, the forests are near their maximum extent and the loss of forest cover is caused by conversion to agriculture which is perennial rather than forest fire which varies from one year to the next.
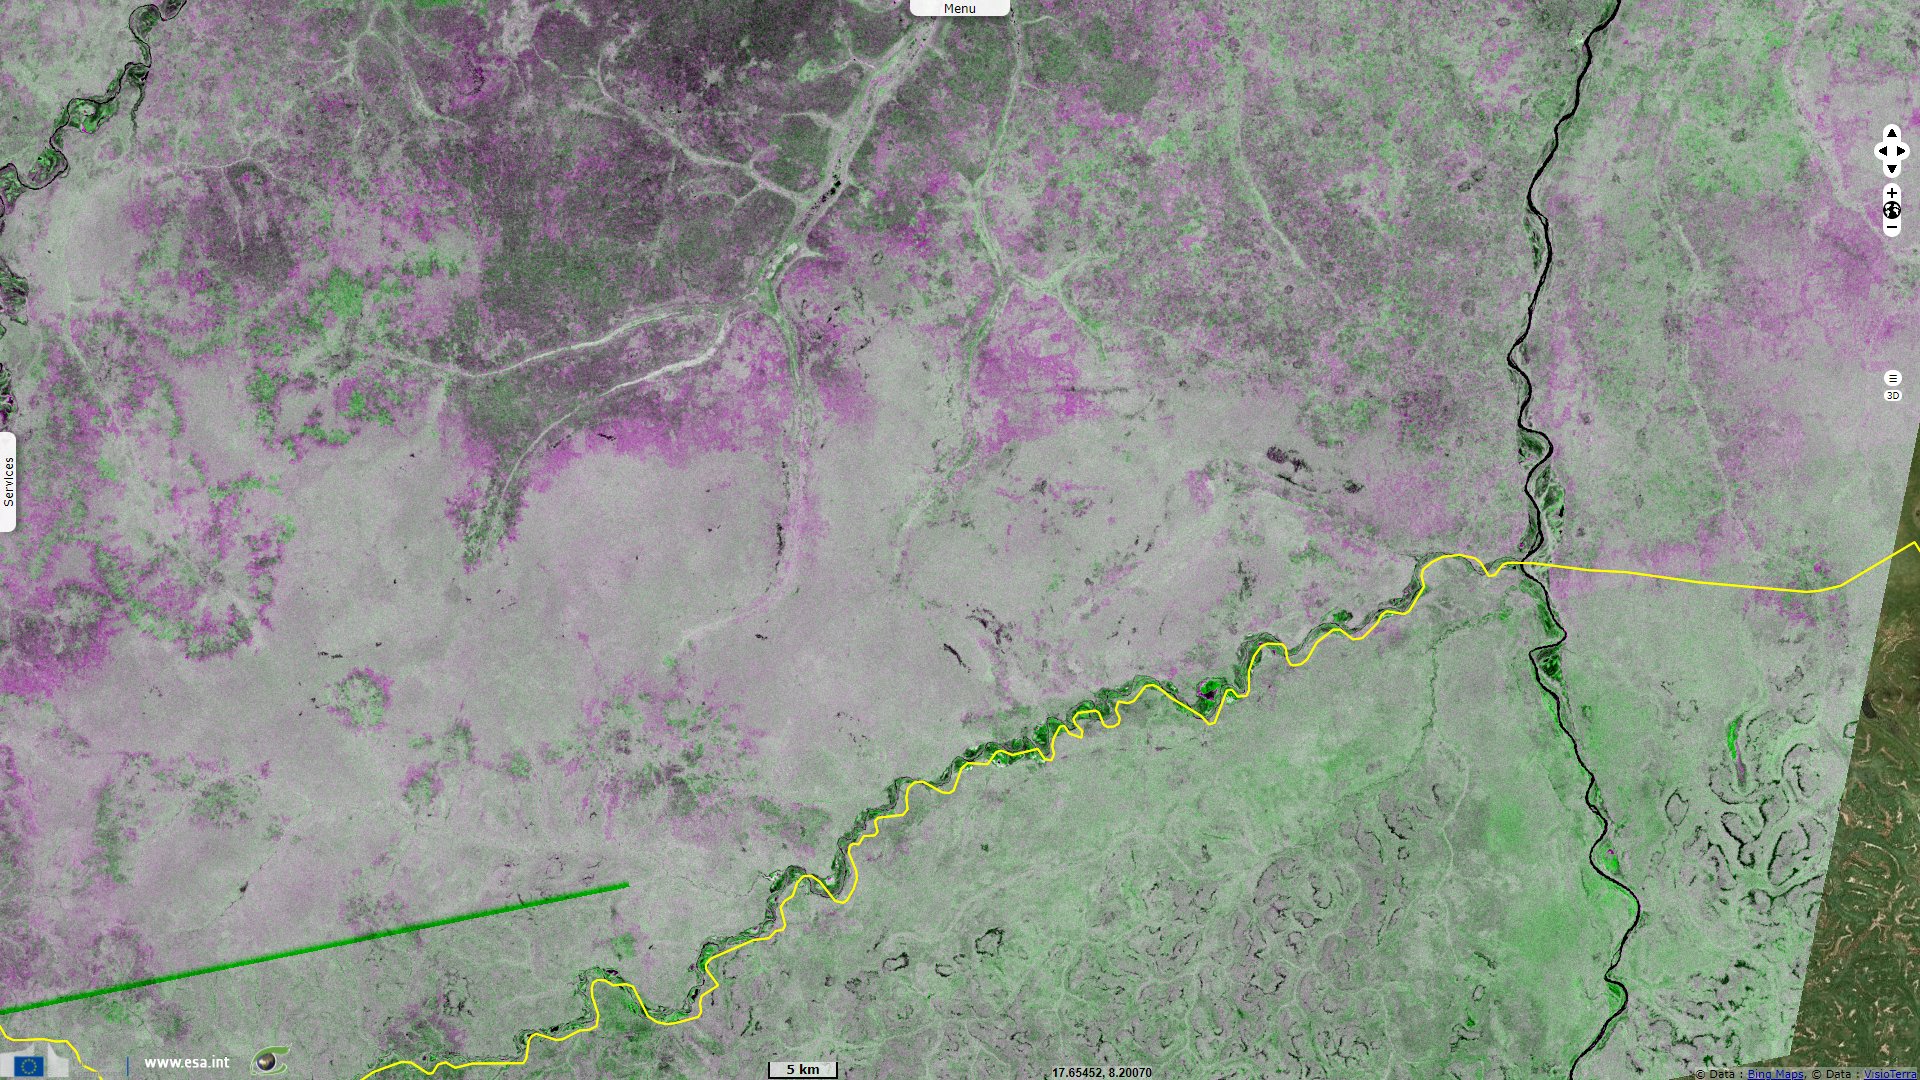
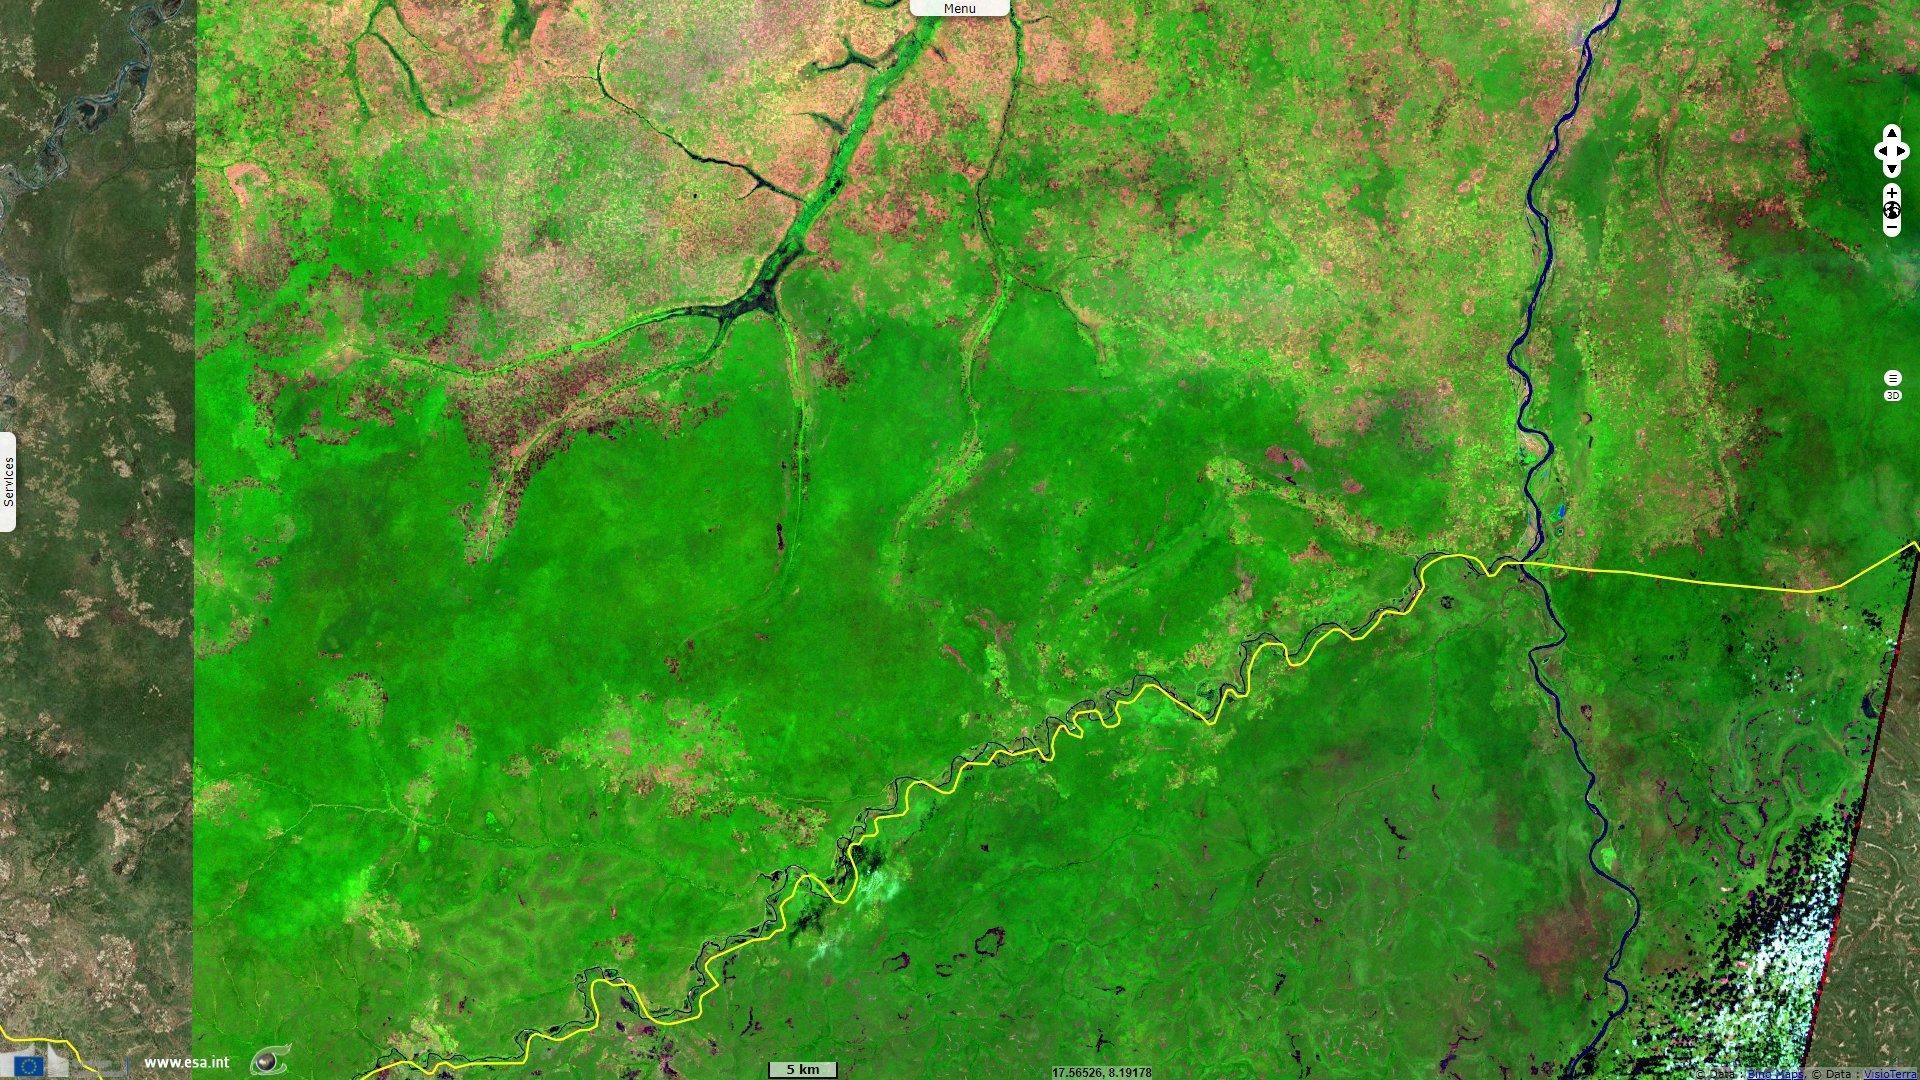
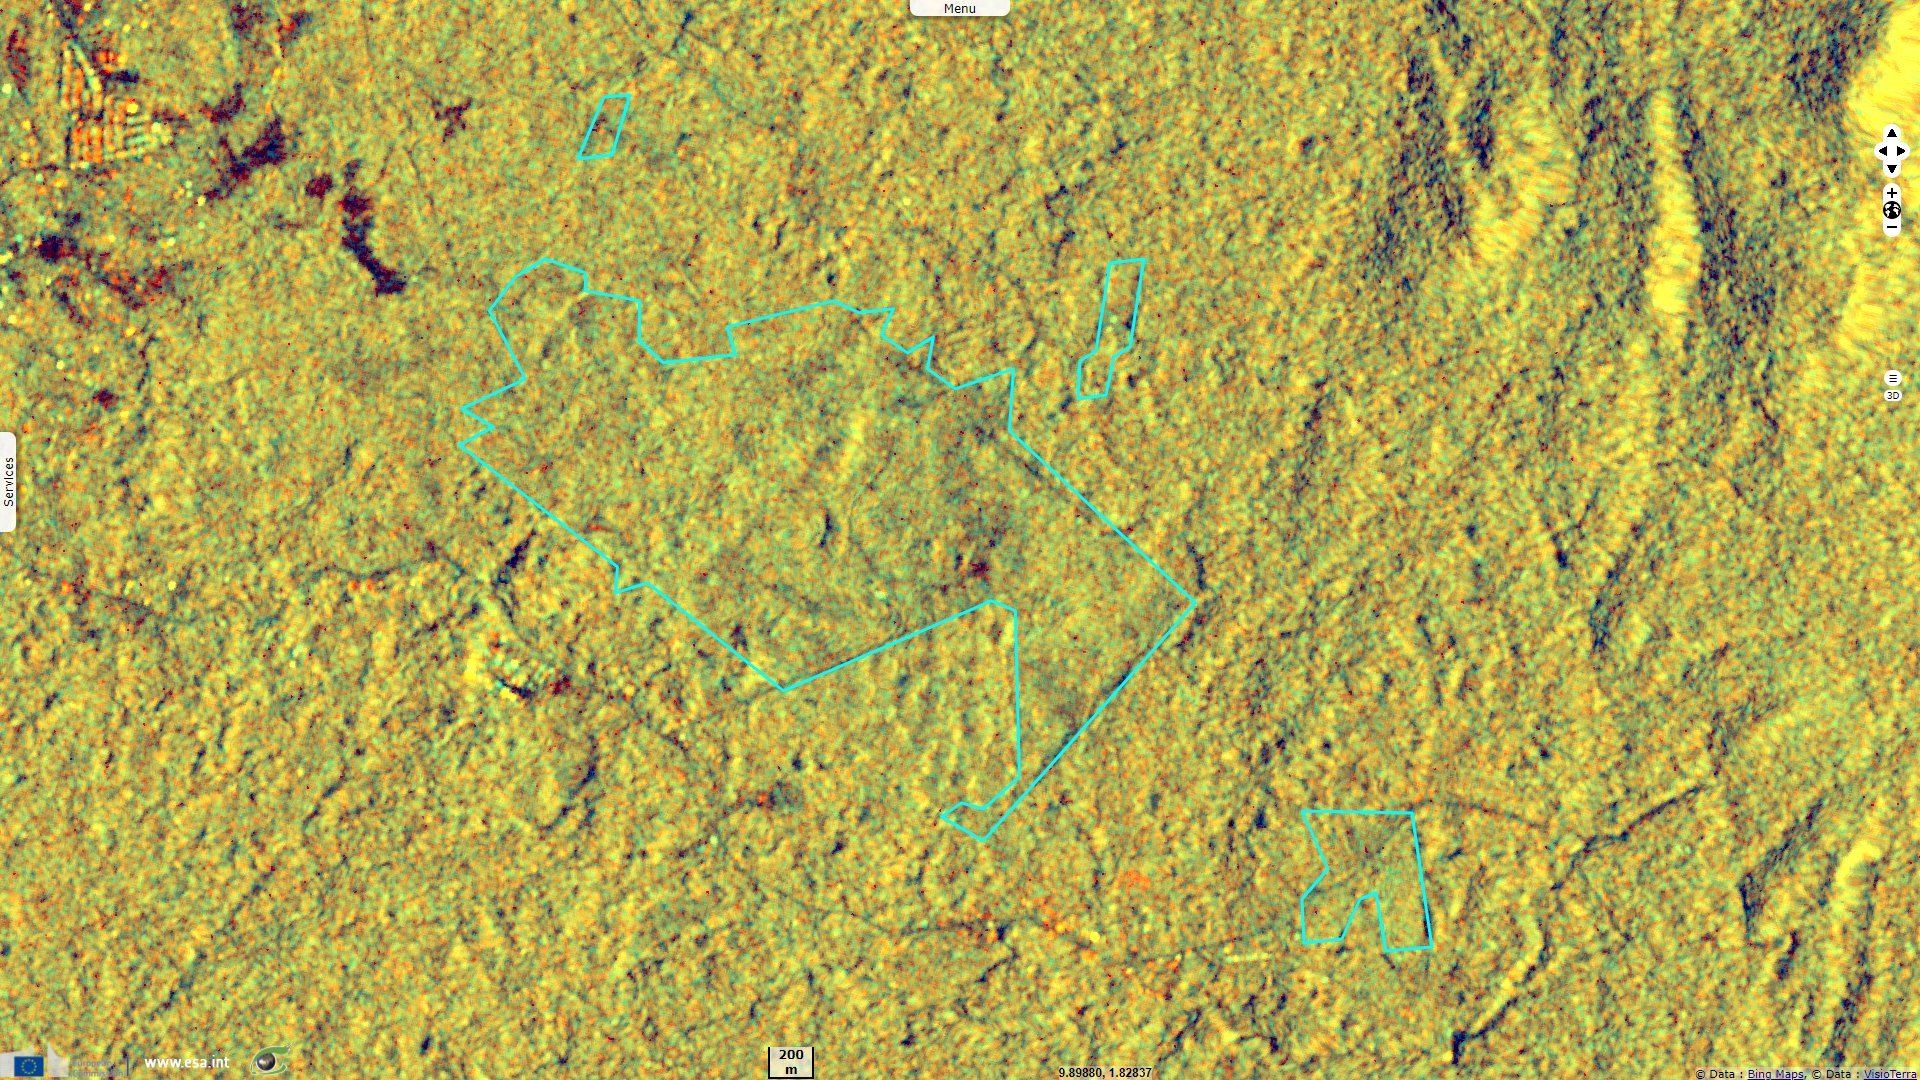
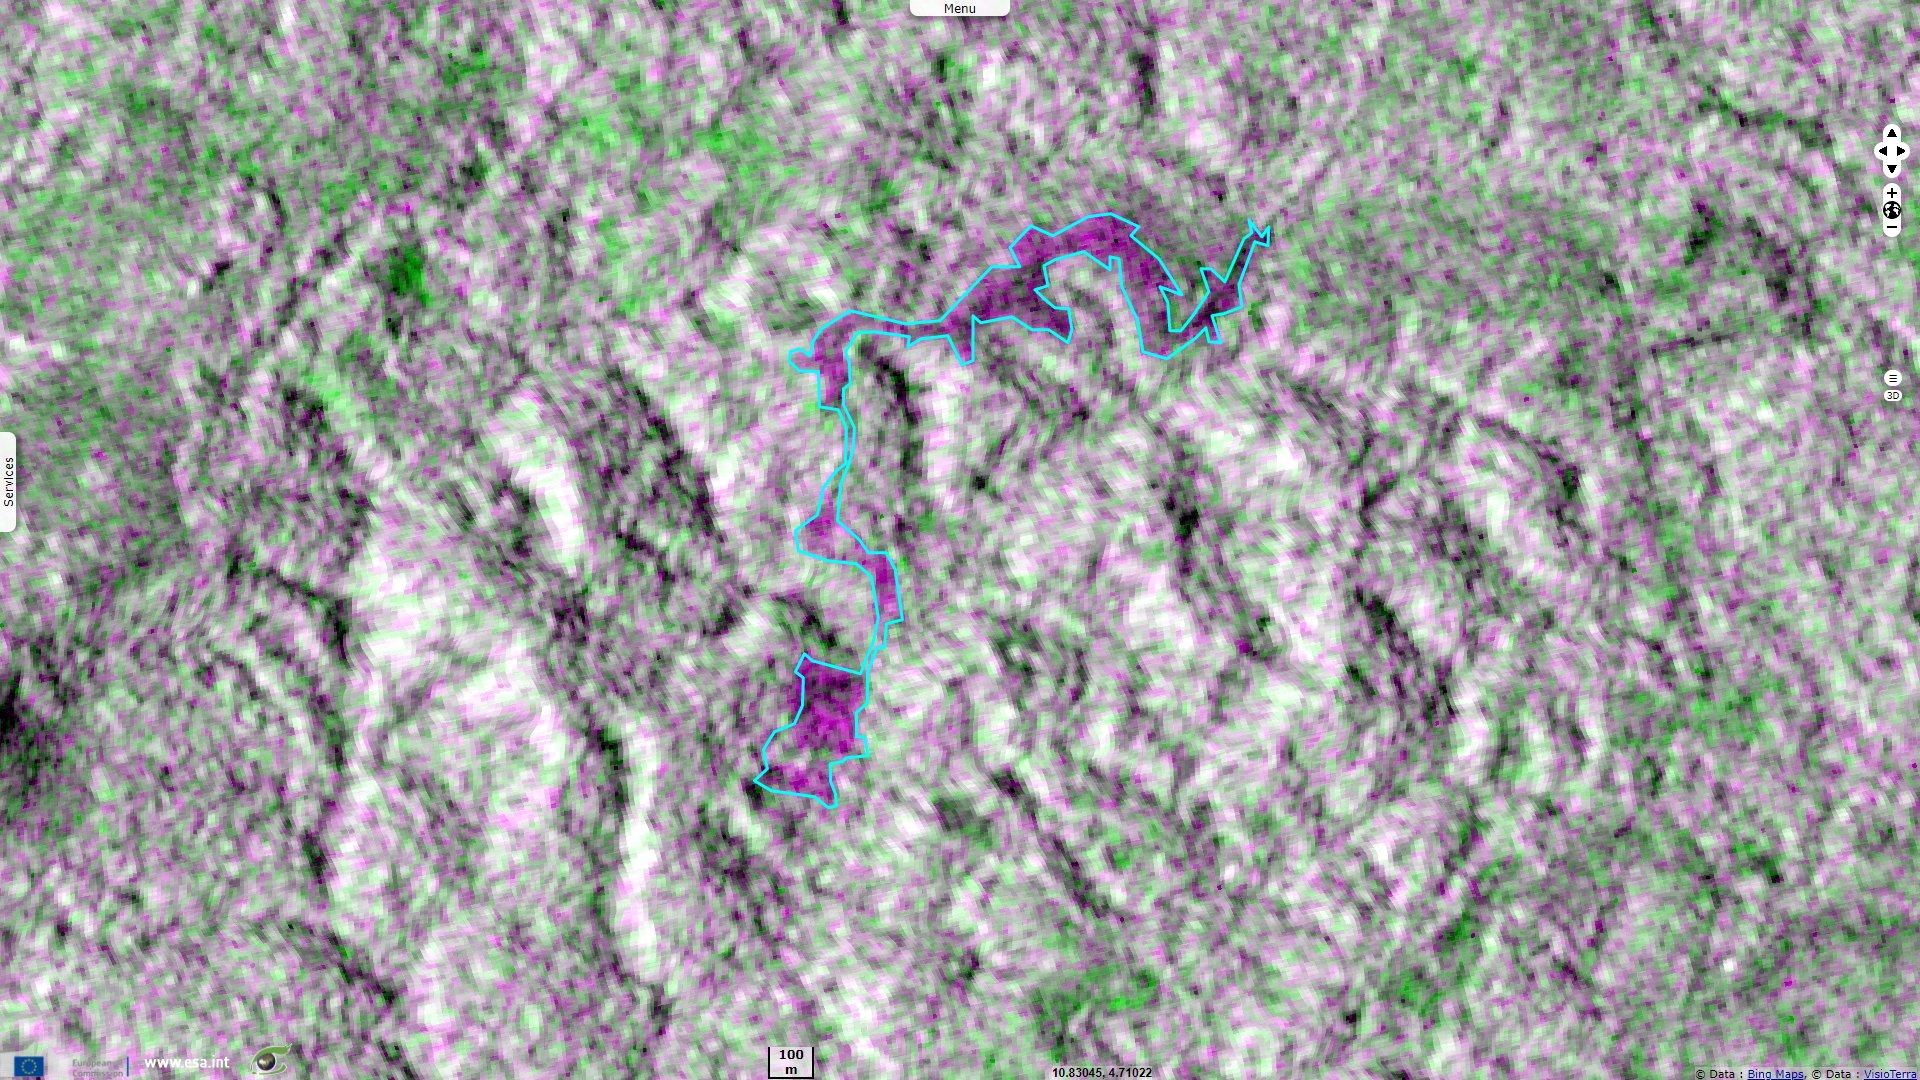
This multitemporal view shows the VV polarisation computed on the mean of Sentinel-1 images acquired on 06, 18 and 30 November 2015 in the red and blue bands, on the mean of Sentinel-1 images acquired on on 04, 16 and 28 November 2021 in the green band.
In the areas where the vegetation cover has decreased between these five years, the VV backscattering decreases in the green band which shows in purple in the composite above. Where the vegetation has increased, it shows in green.
It confirms the areas detected in the optical images are similar with the areas detected in the radar images. The advantage of the radar images is their ability to be acquired though clouds at the cost of a more difficult photo-interpretation.
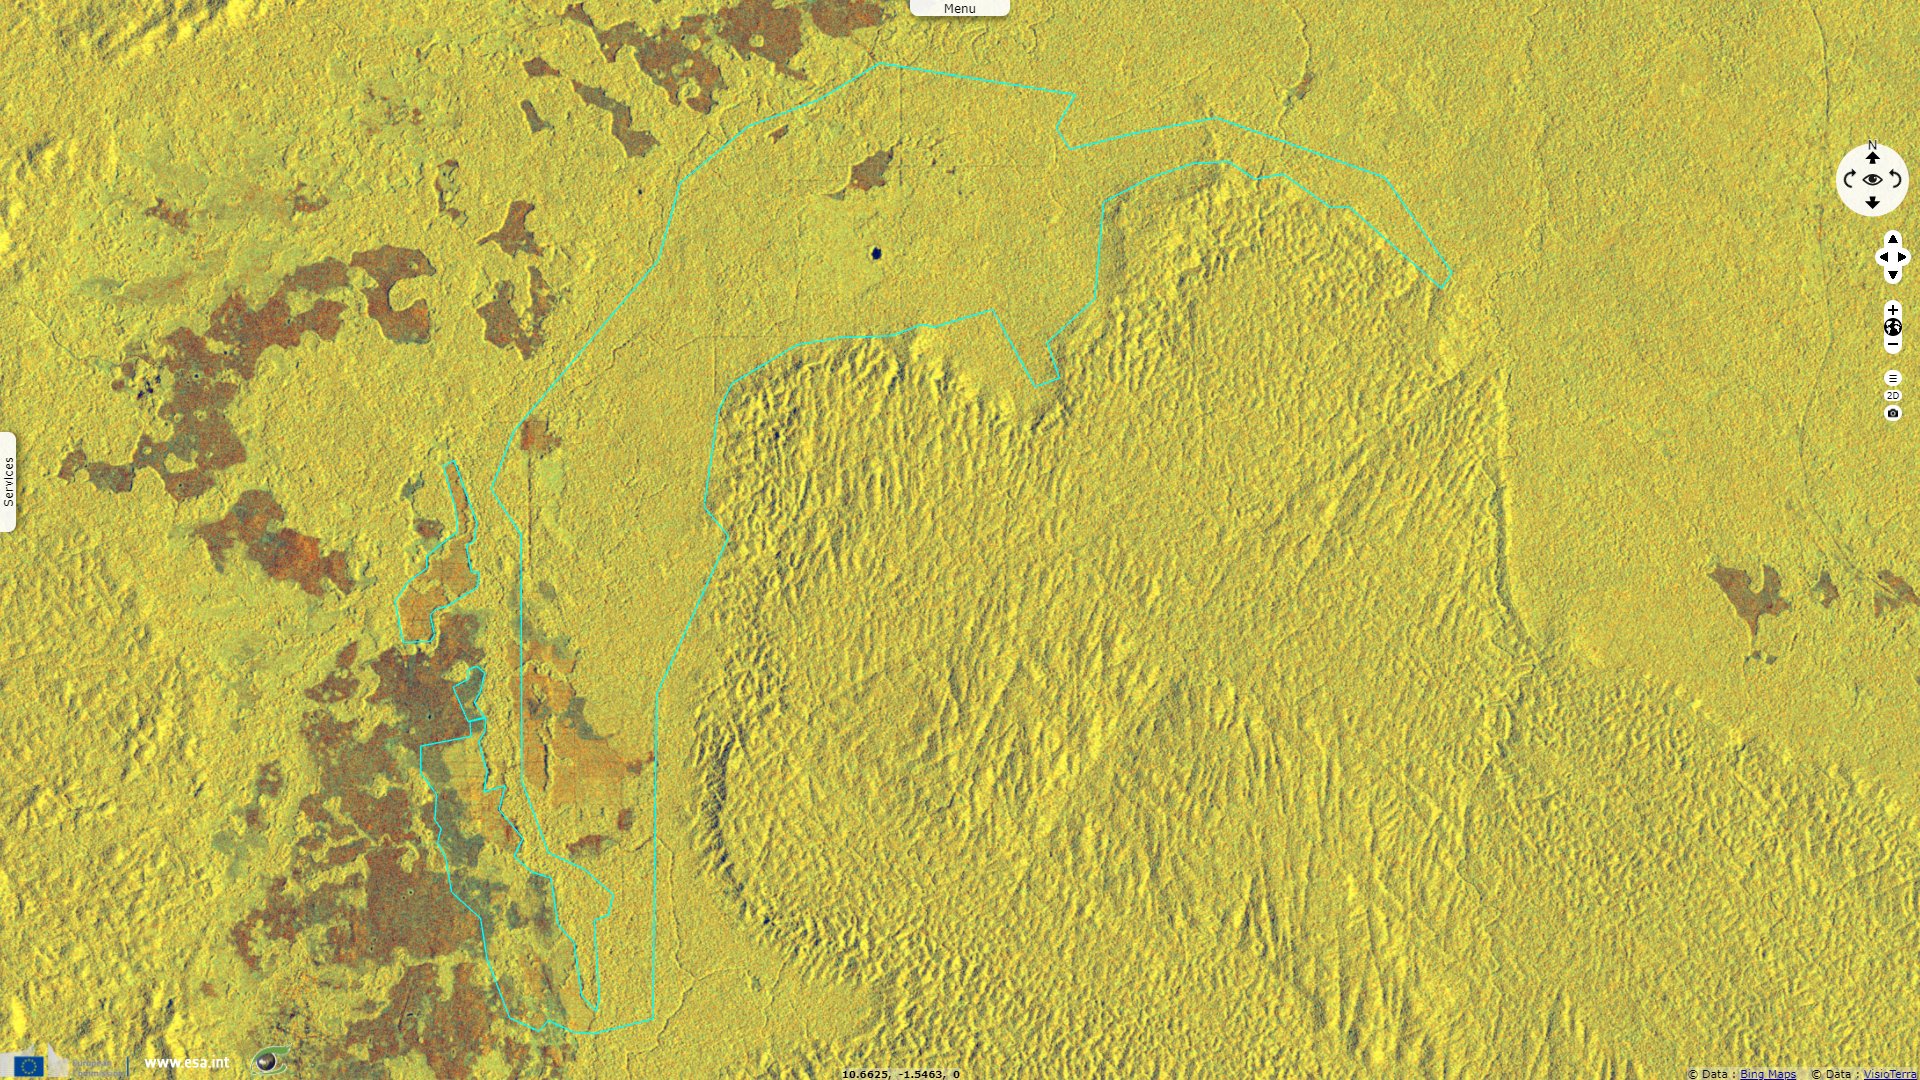
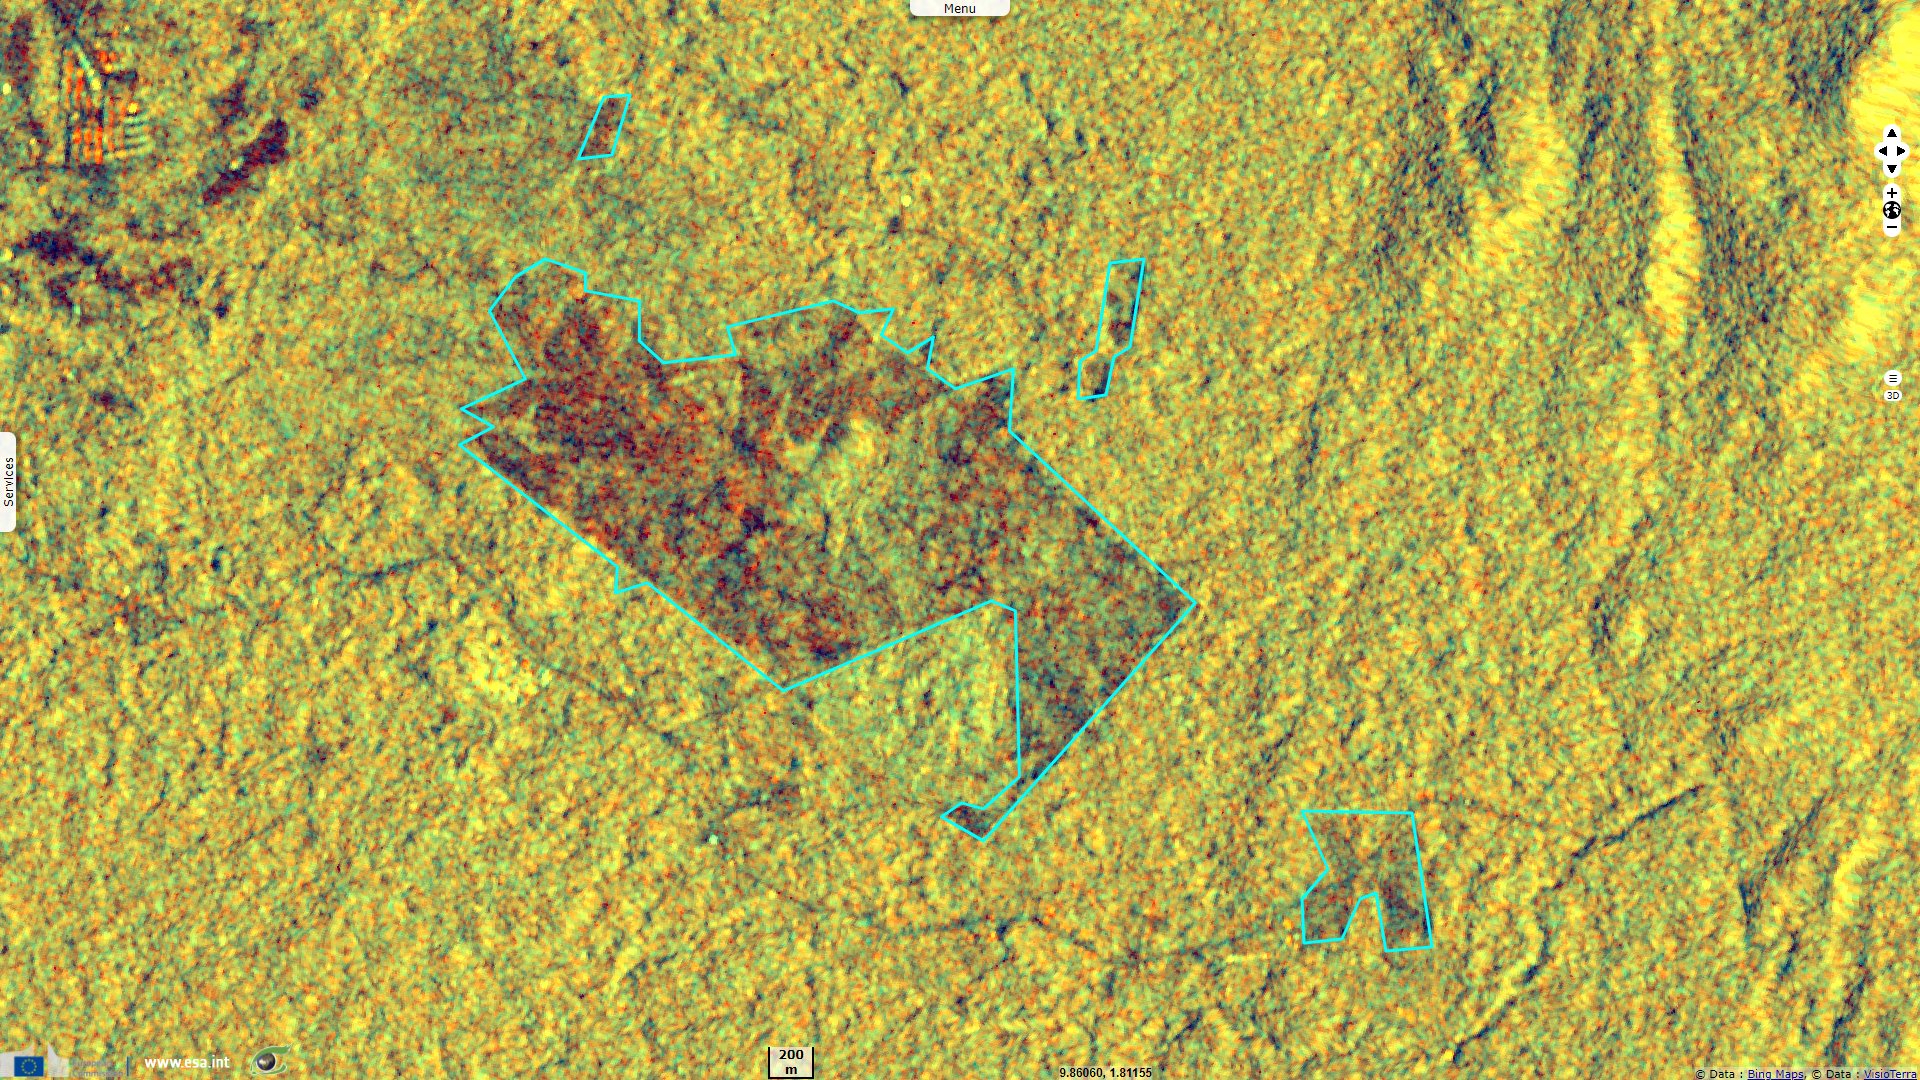
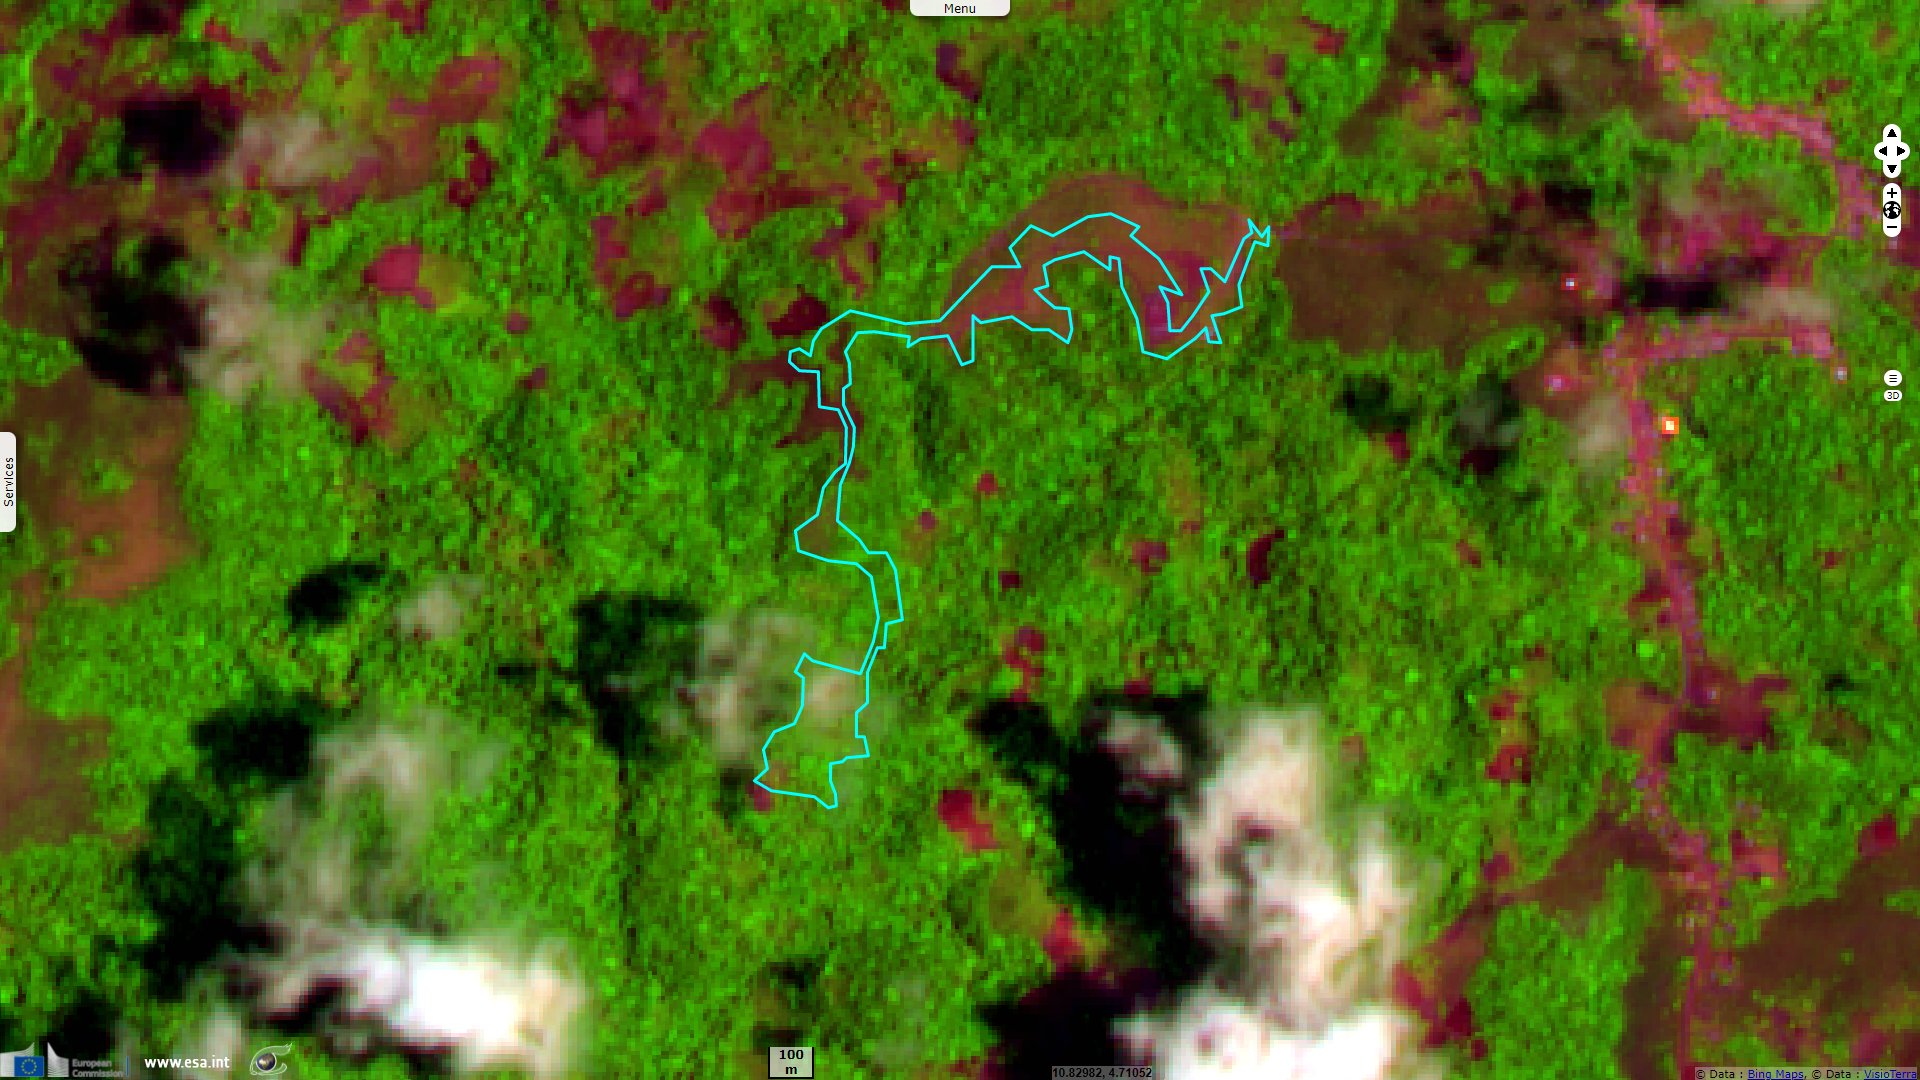
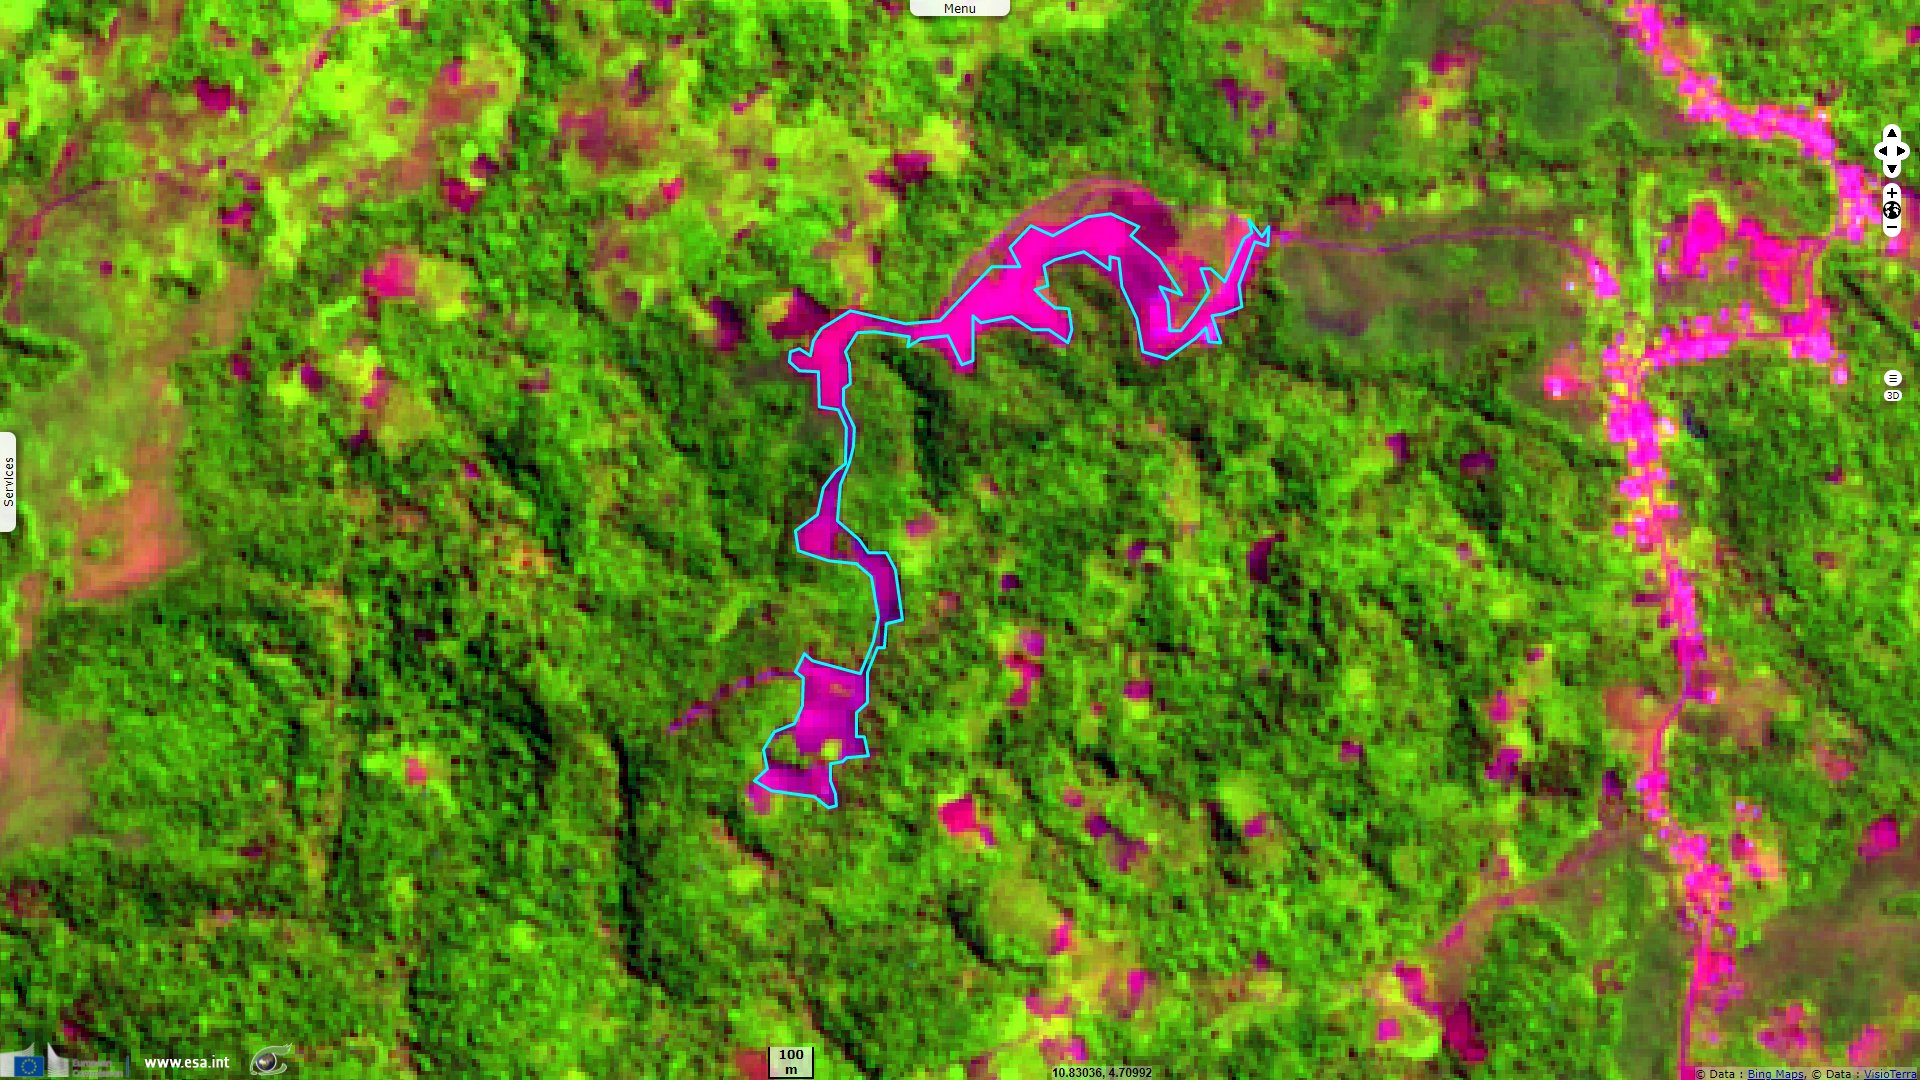
Near Tandoungana in Gabon, several roads are visible within the area enclosed in cyan. In the southern part, a part of the forest has been cleared to be converted to agriculture, mostly to large-scale palm oil plantations.
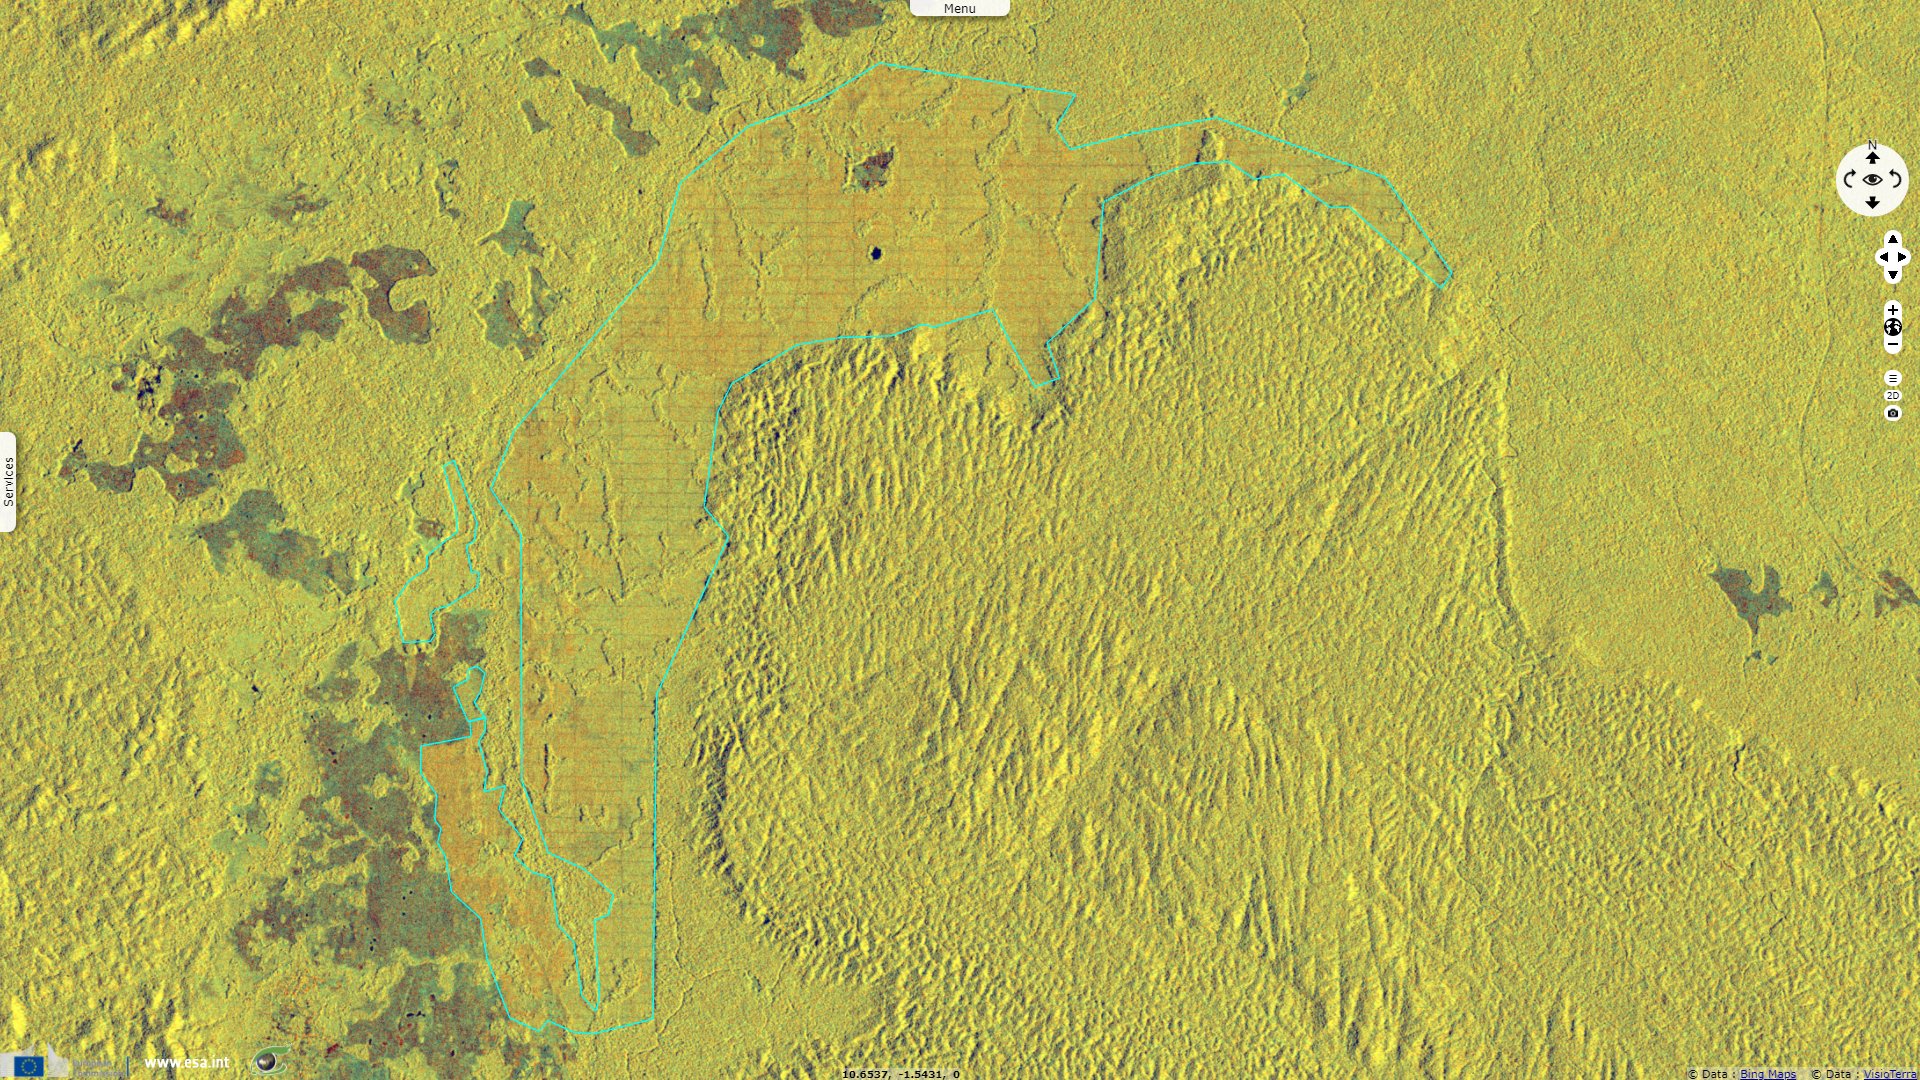
A rectangular pattern is visible inside the photo-interpreted area. It is caused by the transformation of this forested area in large-scale agriculture where the grid allows machines to access the trees.
Agro-industry areas show in orange within the cyan polygon. The dark brownish areas correspond to the loss of forest cover, mostly caused by forest fires.
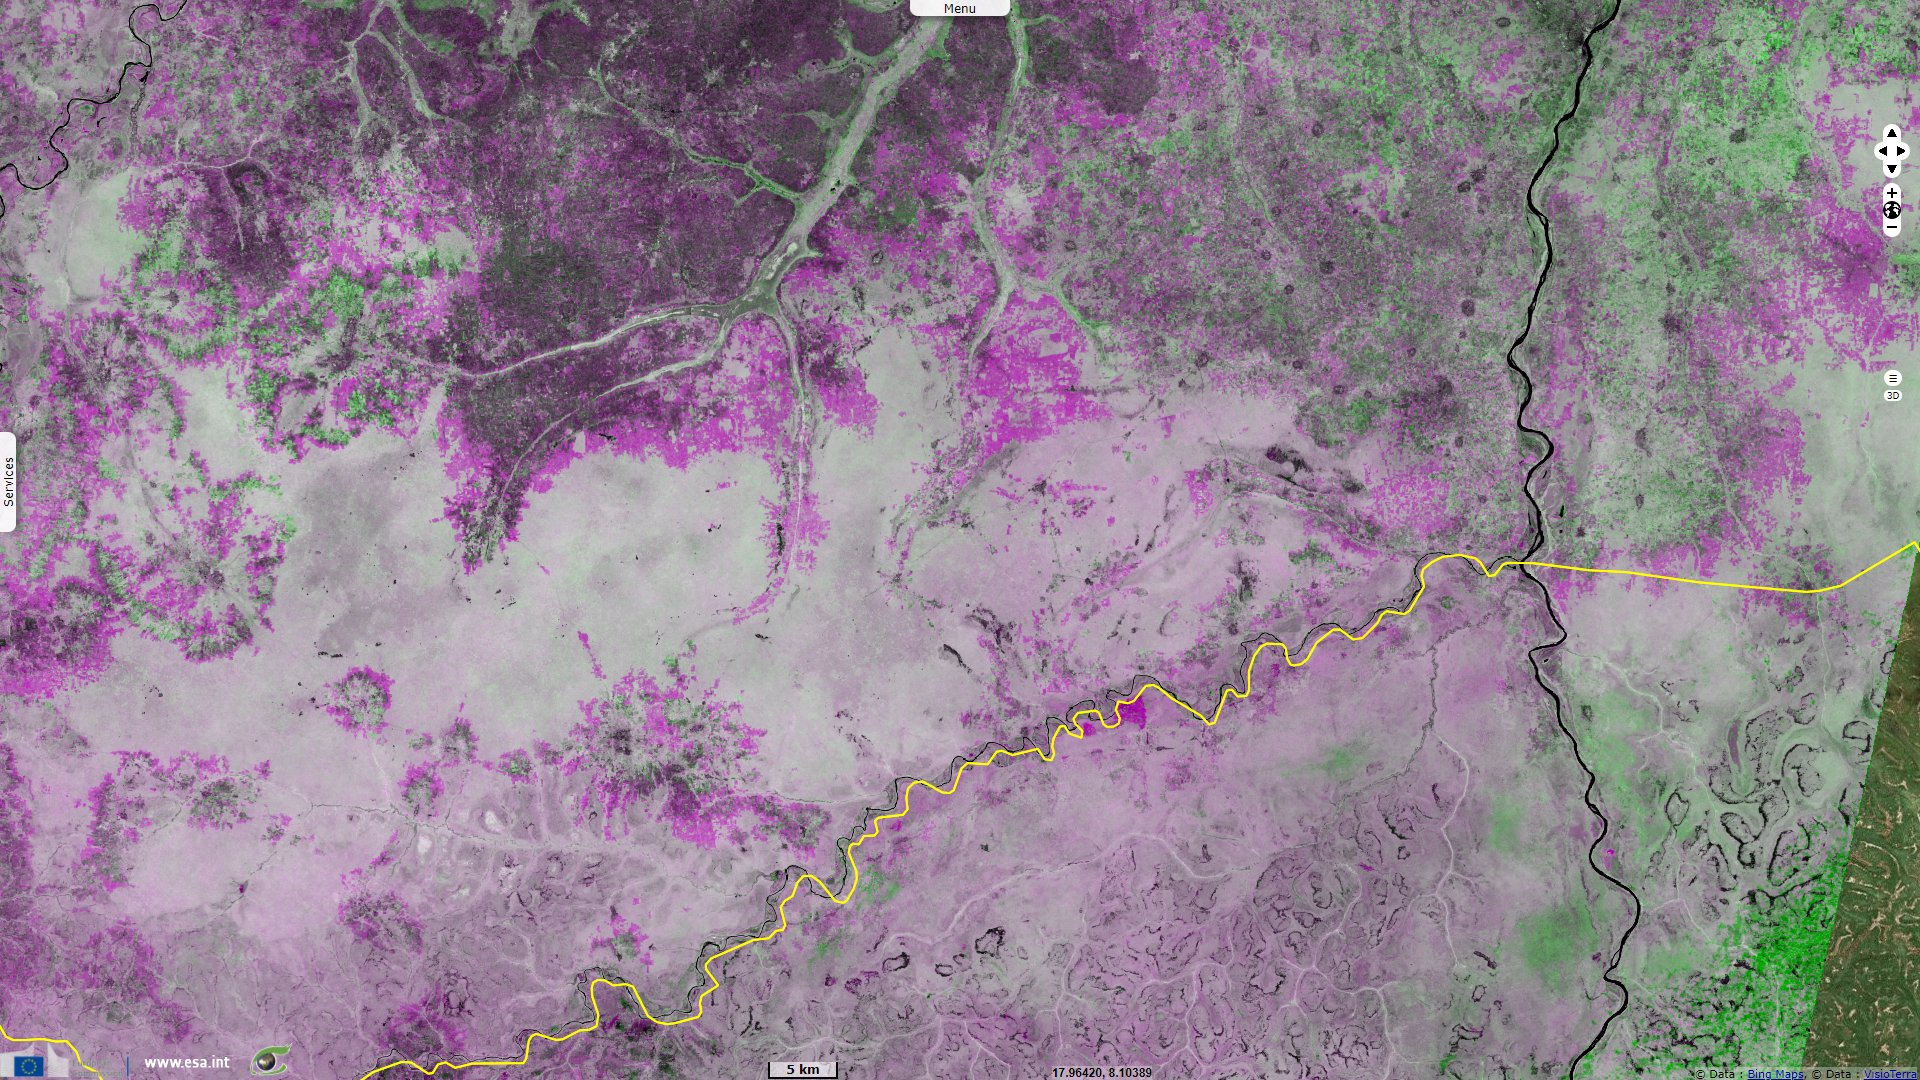
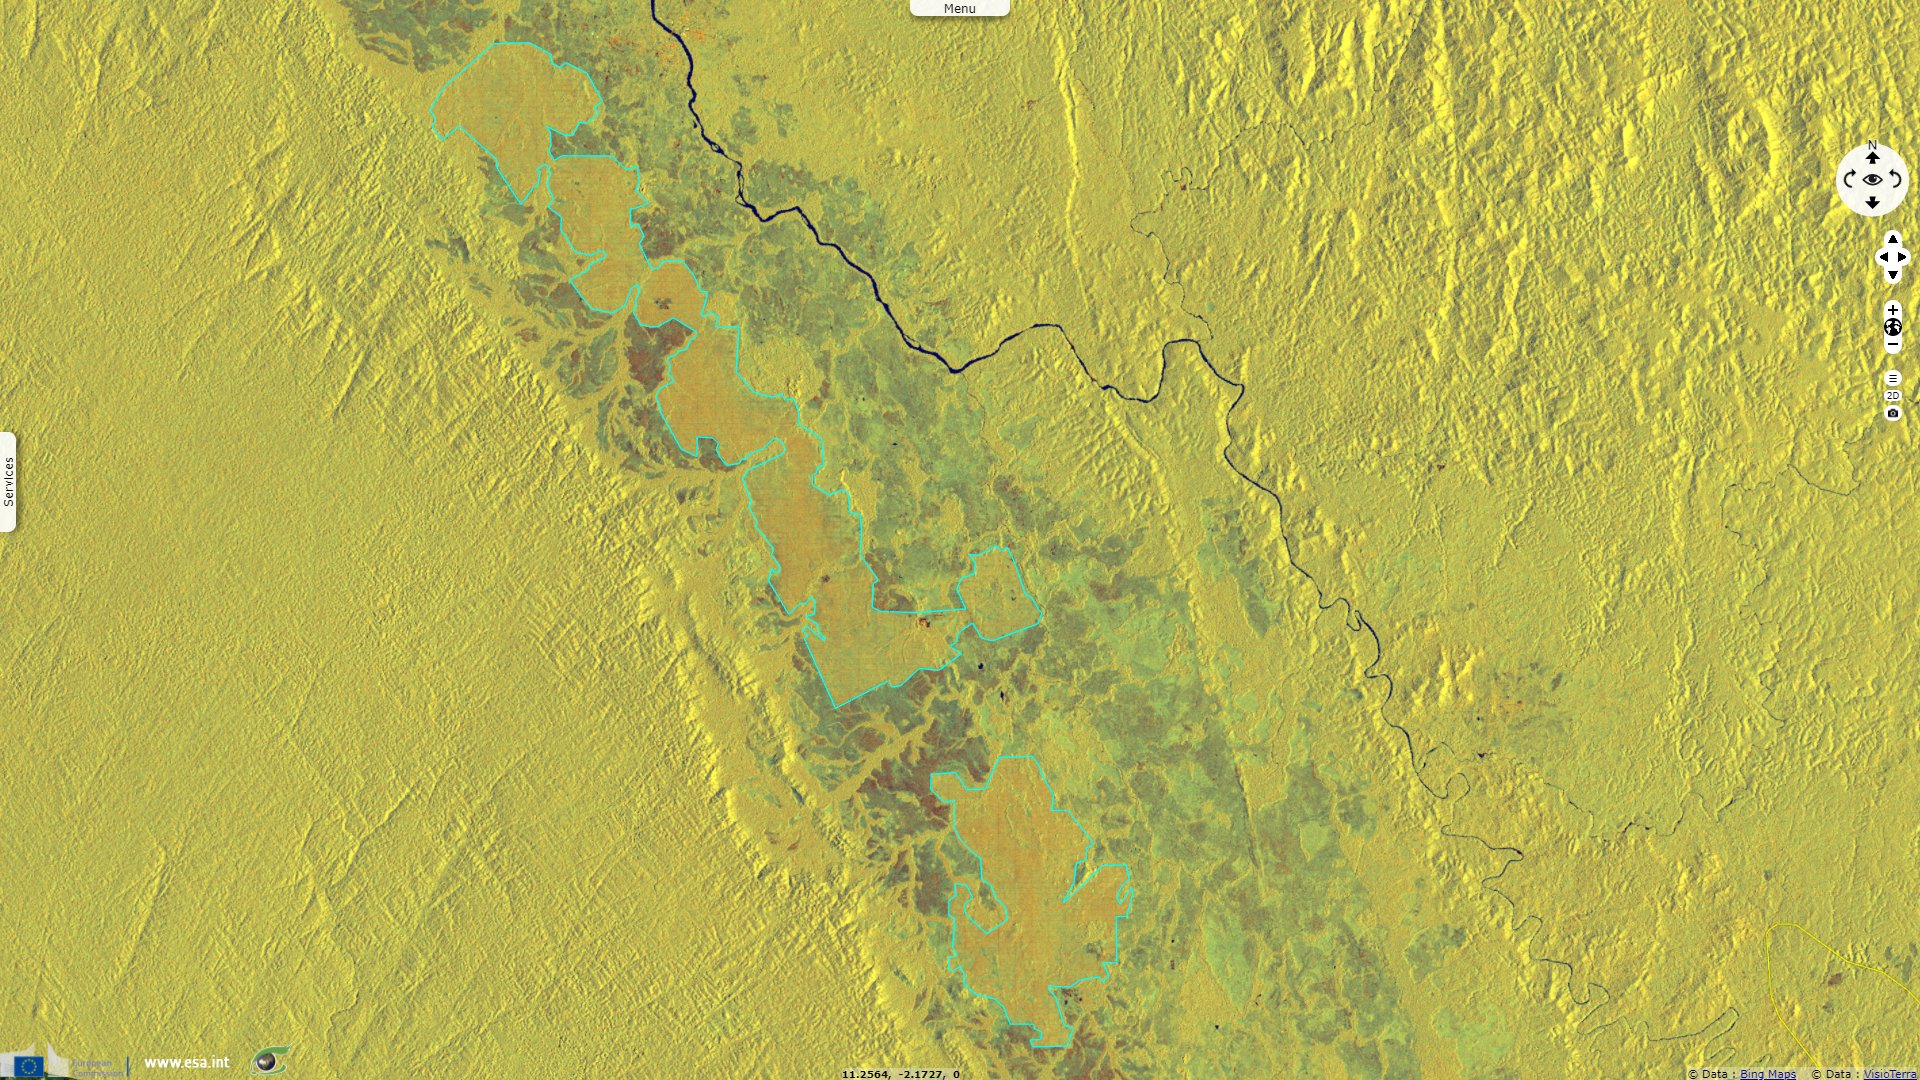
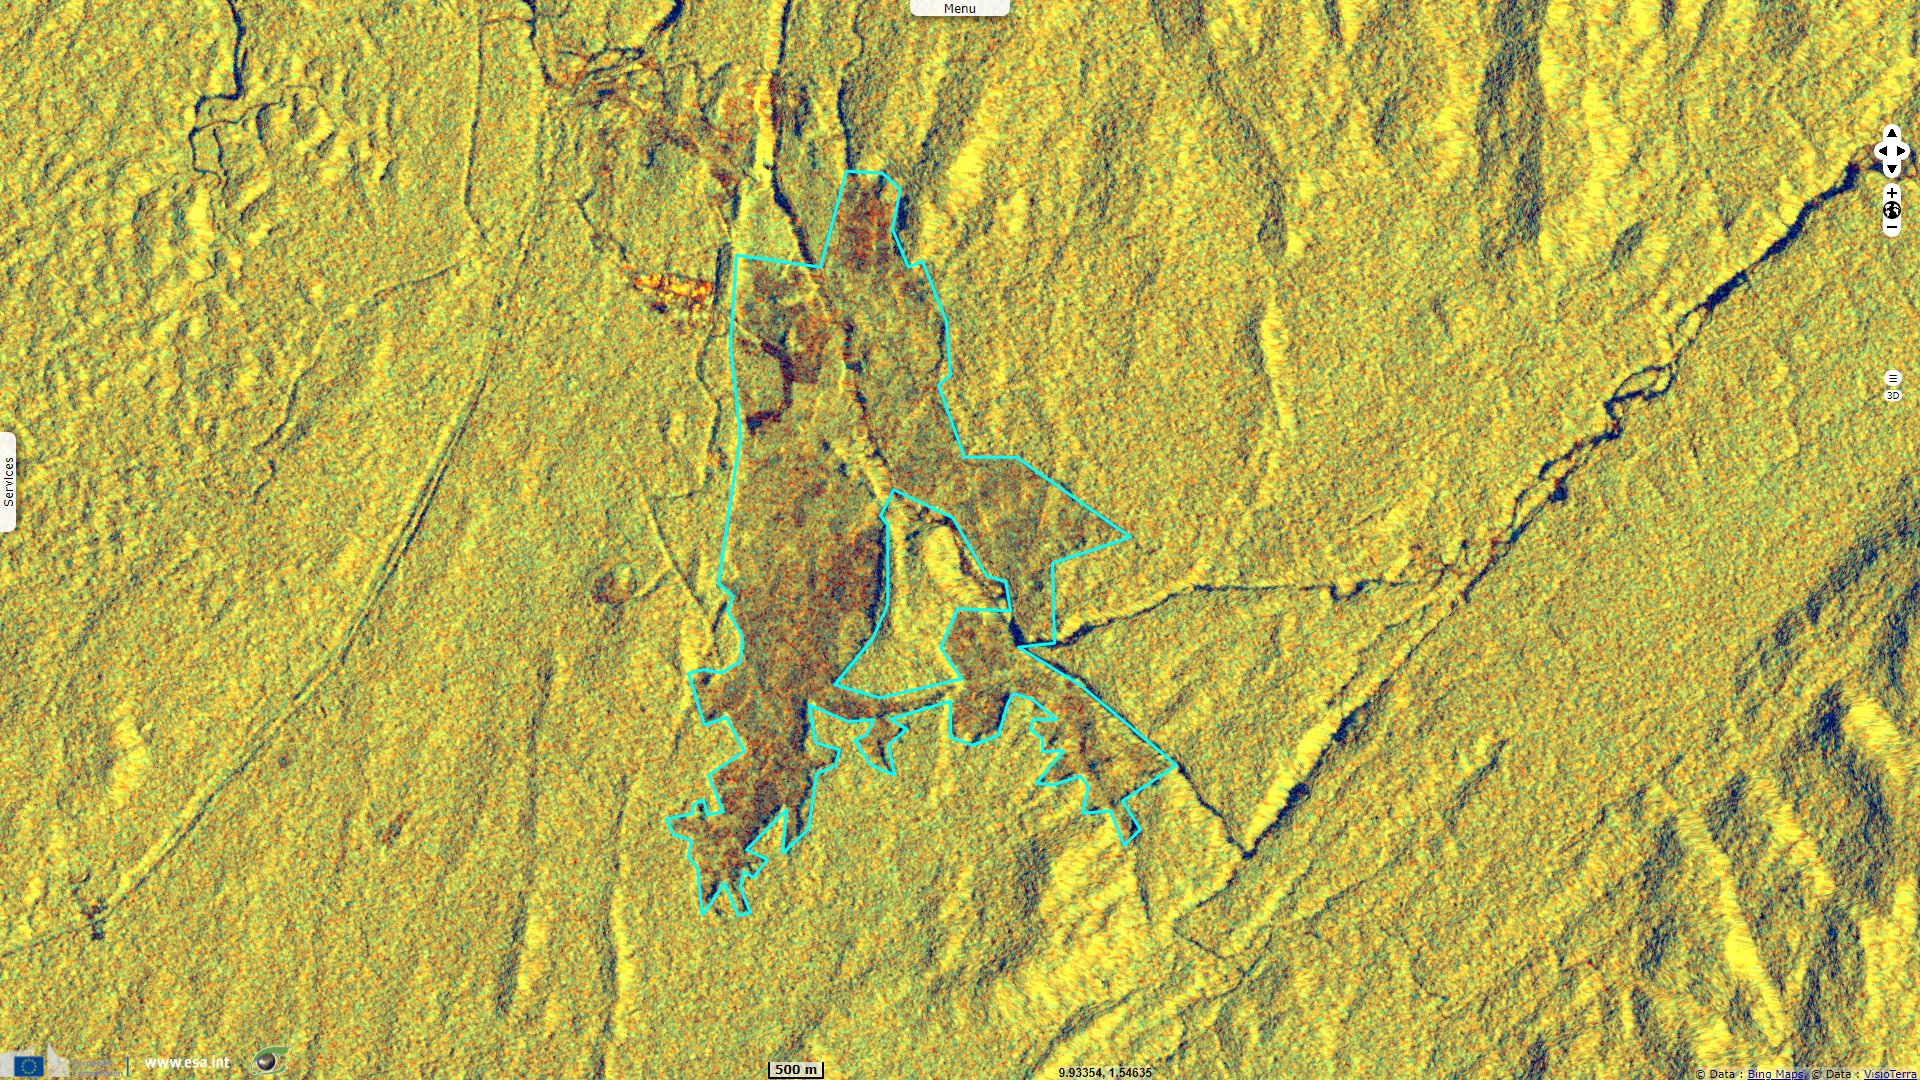
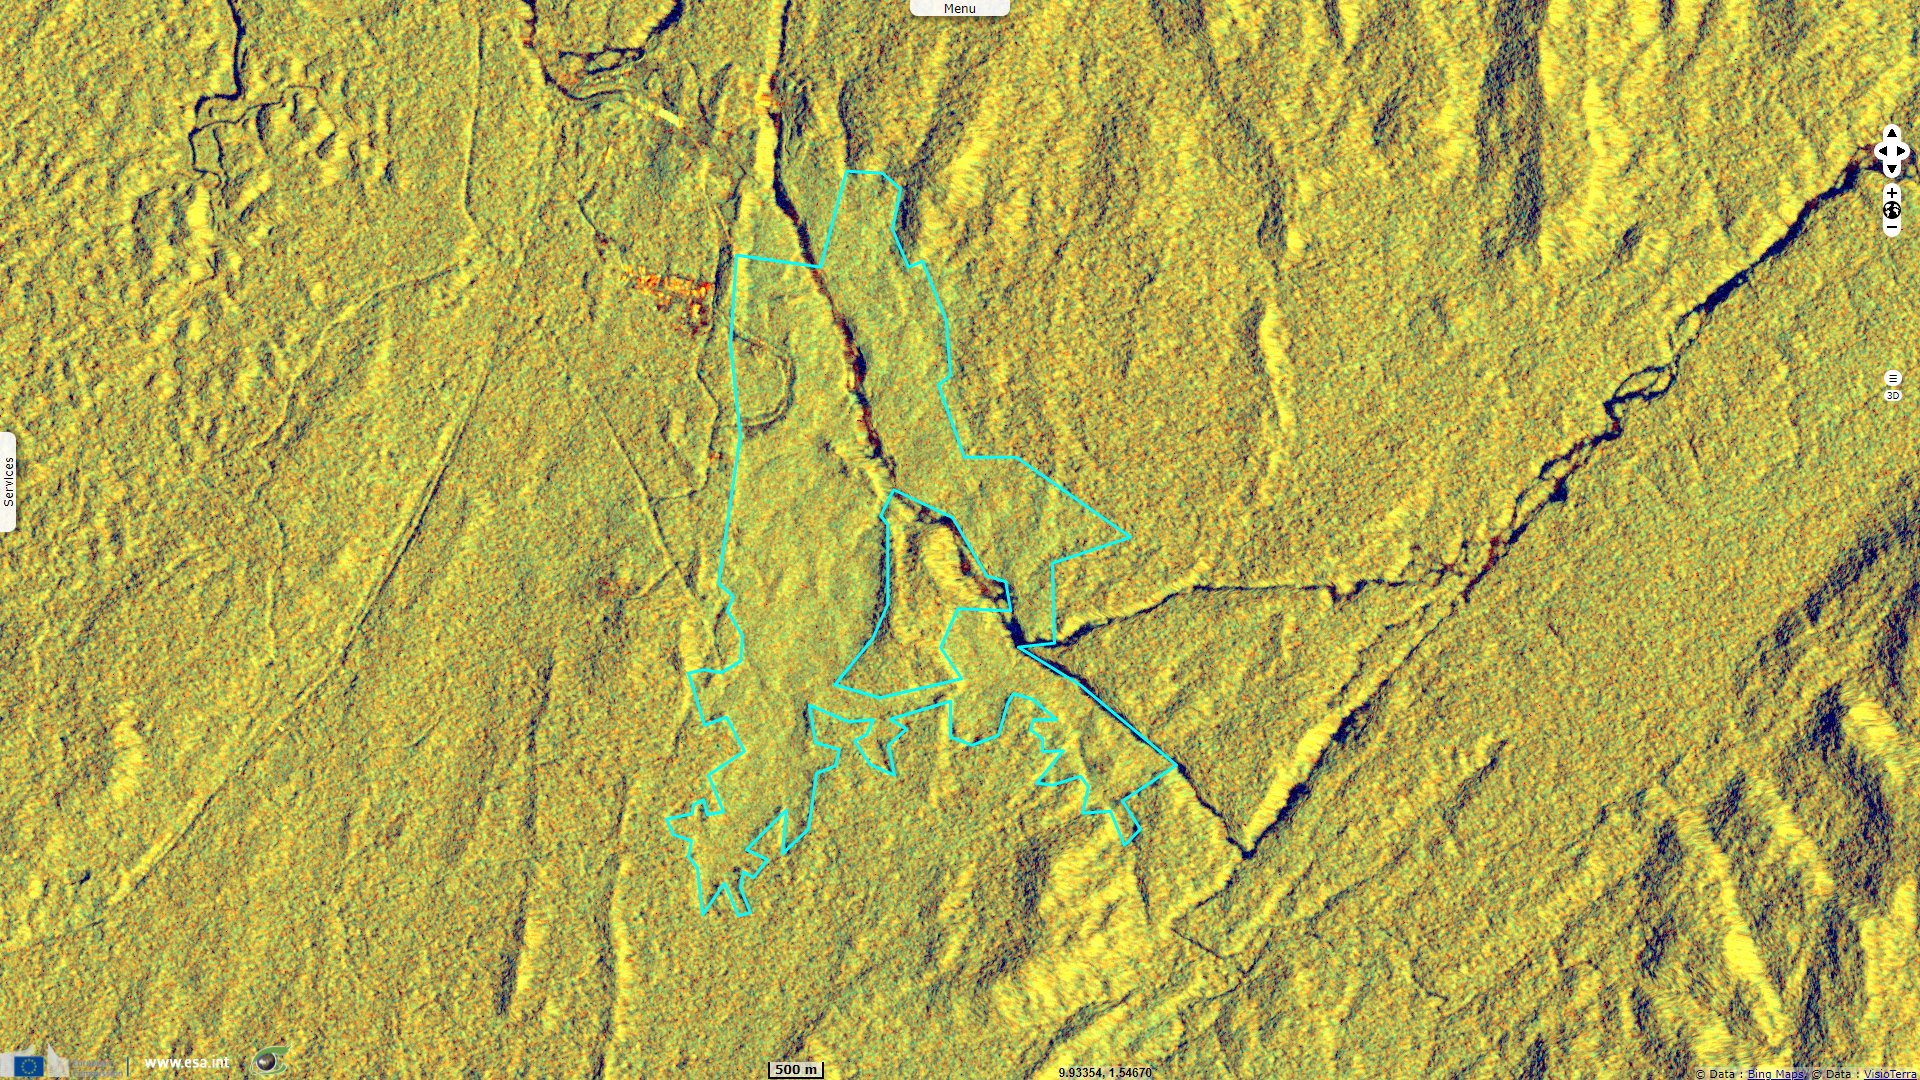
This multitemporal view shows the VV polarisation computed on the mean of Sentinel-1 images acquired on 23 October, 04 and 16 November 2015 in the red and blue bands, on the mean of Sentinel-1 images acquired on on 27 October, 08 and 20 November 2021 in the green band.
In the areas where the vegetation cover has decreased between these five years, the VV backscattering decreases in the green band which shows in purple in the composite above. Where the vegetation has increased, it shows in green.
It shows burnt areas that had low backscattering in VV polarisation in 2015 have been converted to agriculture which increased their radar backscattering in 2021.
On this area, brownish areas show deforested land. At south of the largest polygon, an area with a smoother texture shows with a different hue of yellow, more greenish (VH polarisation) and less reddish (VV polarisation) than the surrounding forest. It can be inferred it is a large agriculture plot.
The above site of change in forest cover has been detected automatically by the FLEGT Watch software, developed by VisioTerra. It makes use of systematic Sentinel-1 acquisitions to allow regular monitoring of Western and Central African forests. Developed during the year 2018 according to the user specifications of CIDT and Tropenbos International, FLEGT Watch is operational since January 1st, 2019.
When a deforestation event is detected in an area to be monitored, FLEGT Watch Web warns the observers in that area. They can comment on the event and decide to go and check the reality on the field with a mobile FLEGT Watch App for smartphones that allows them to organize field missions, collect in-situ observations and share them with the community.
Previous examples showed large deforested areas between images acquired several years apart. In contrast, FLEGT Watch uses short series of consecutive images to find even small scale loss of tree cover with a high temporal resolution.
The SEFAC project uses the Central Africa Forest Warning System (CAWFS) developed by African EO Services. It allows users to make multiyear time series of indicators of their choice such as vegetation indices, active fire fronts or burnt area indices inside an area of interest.
The large decrease of NDVI between the end of March 2020 and mid May 2021 is shown in magenta in the image above. CAWFS allows to follow the evolution of an area of interest, to discriminate causes of change in land cover, whether they are converted to bare soil, agriculture, temporarily burnt of flooded.
The views expressed herein can in no way be taken to reflect the official opinion of the European Space Agency or the European Union.
Contains modified Copernicus Sentinel data 2026, processed by VisioTerra.
Contains modified Copernicus Sentinel data 2026, processed by VisioTerra.
| More on European Commission space: |  |
 |
 |
||||
| More on ESA: | |
|
|
S-1 website | S-2 website | S-3 website | |
| More on Copernicus program: | |
|
|
Scihub portal | Cophub portal | Inthub portal | Colhub portal |
| More on VisioTerra: | |
|
|
Sentinel Vision Portal | Envisat+ERS portal | Swarm+GOCE portal | CryoSat portal |
- To produce products and basic information in the form of relevant indicators of the state of forests in Central Africa from earth observation data;
- To ensure the dissemination of the extracted products, information and indicators to as many beneficiaries and users as possible;
- Ensure the appropriation by the greatest number of beneficiaries and users of the data, tools, information and indicators extracted;
- Ensure training and capacity building of consortium partners and associates as well as other stakeholders in the use of Earth observation data
".