Hurricane Florence crosses Atlantic to rock Virginia
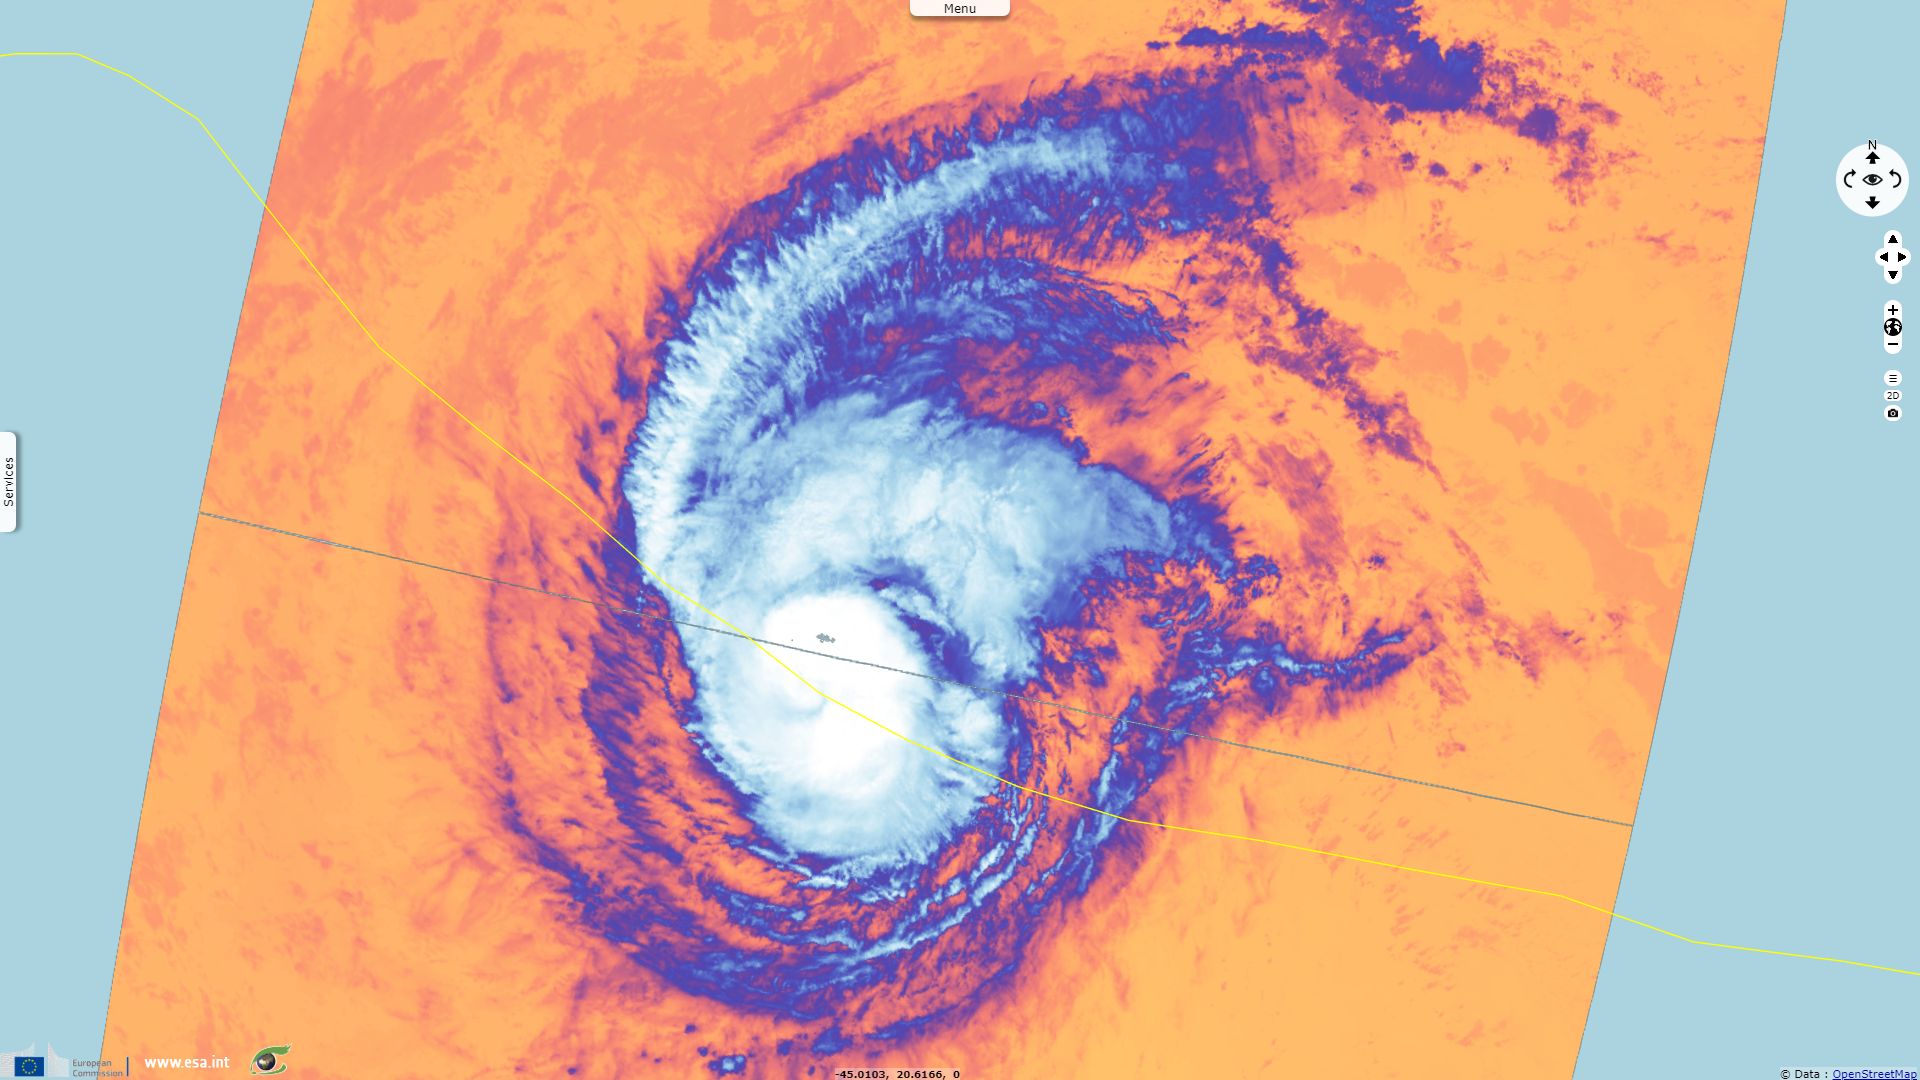
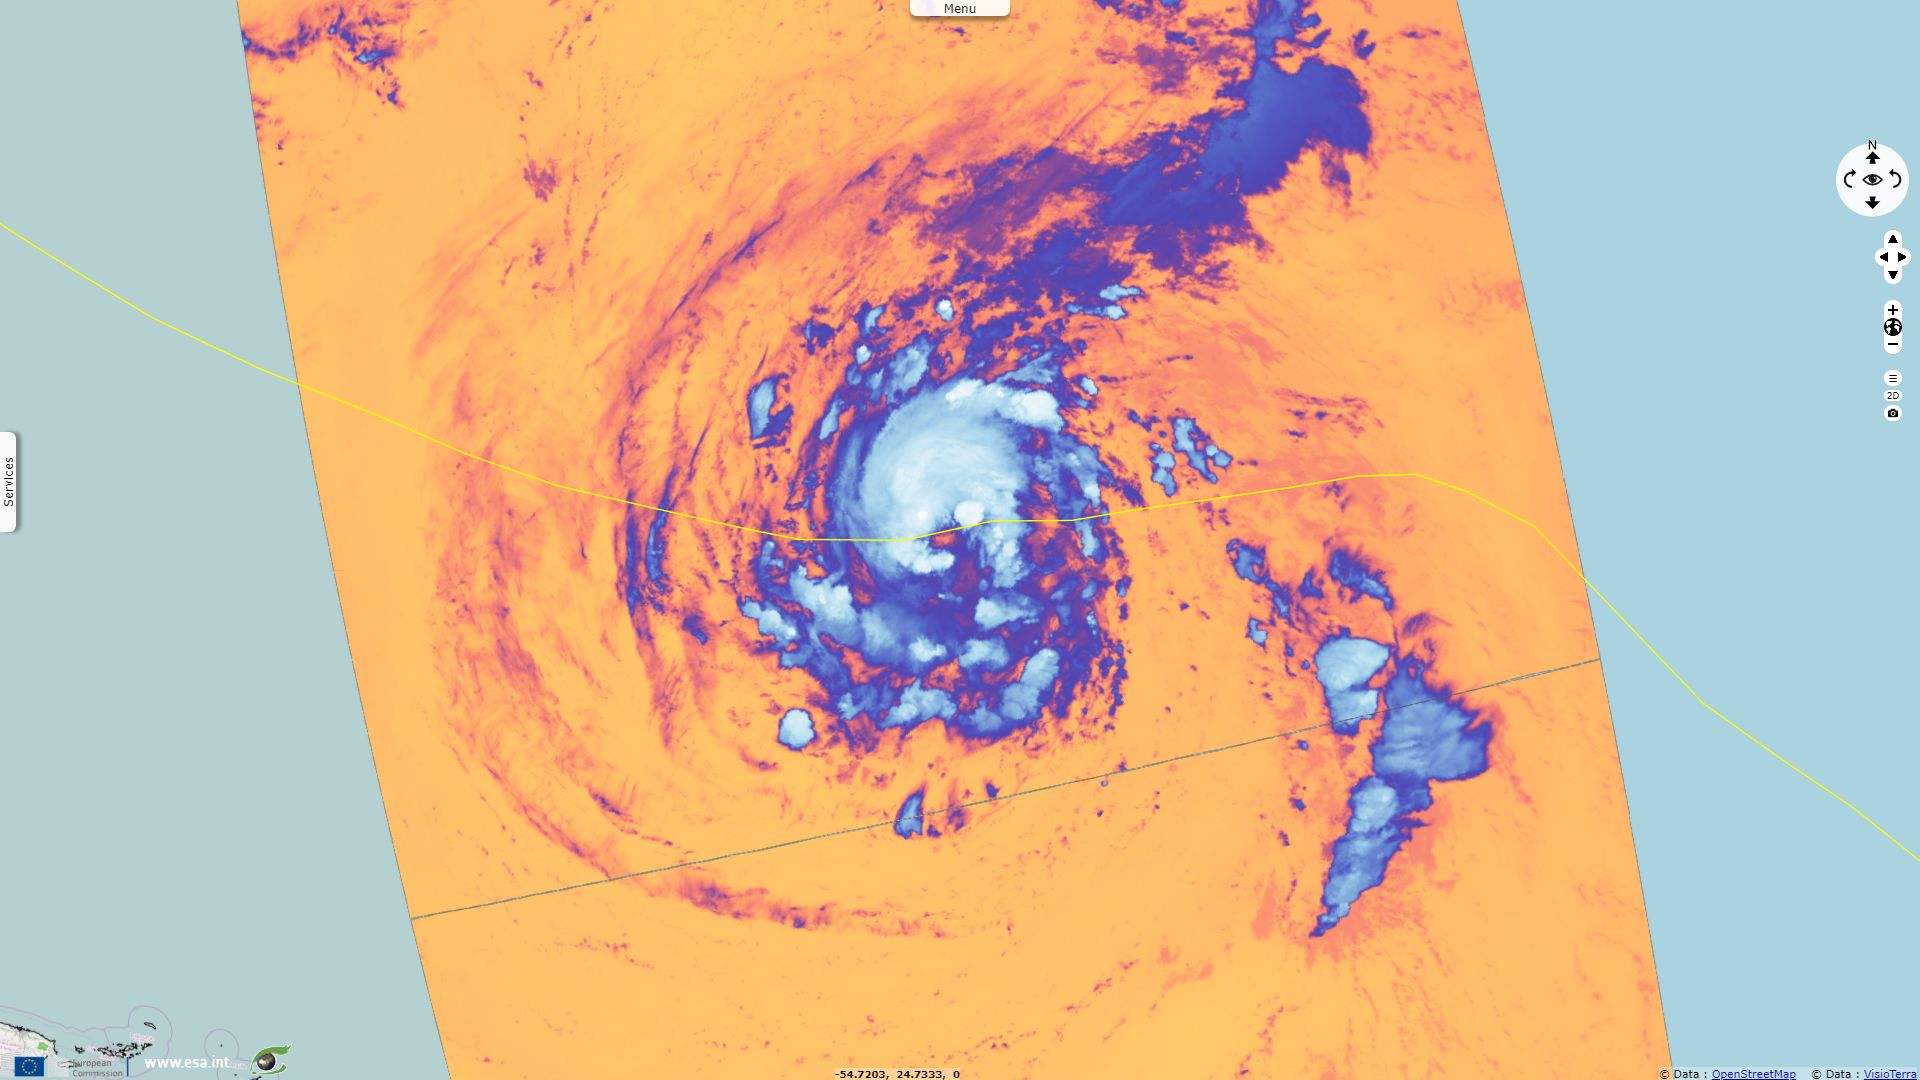
Sentinel-3 SLSTR RBT acquired on 04 September 2018 from 12:44:48 to 12:47:48 UTC
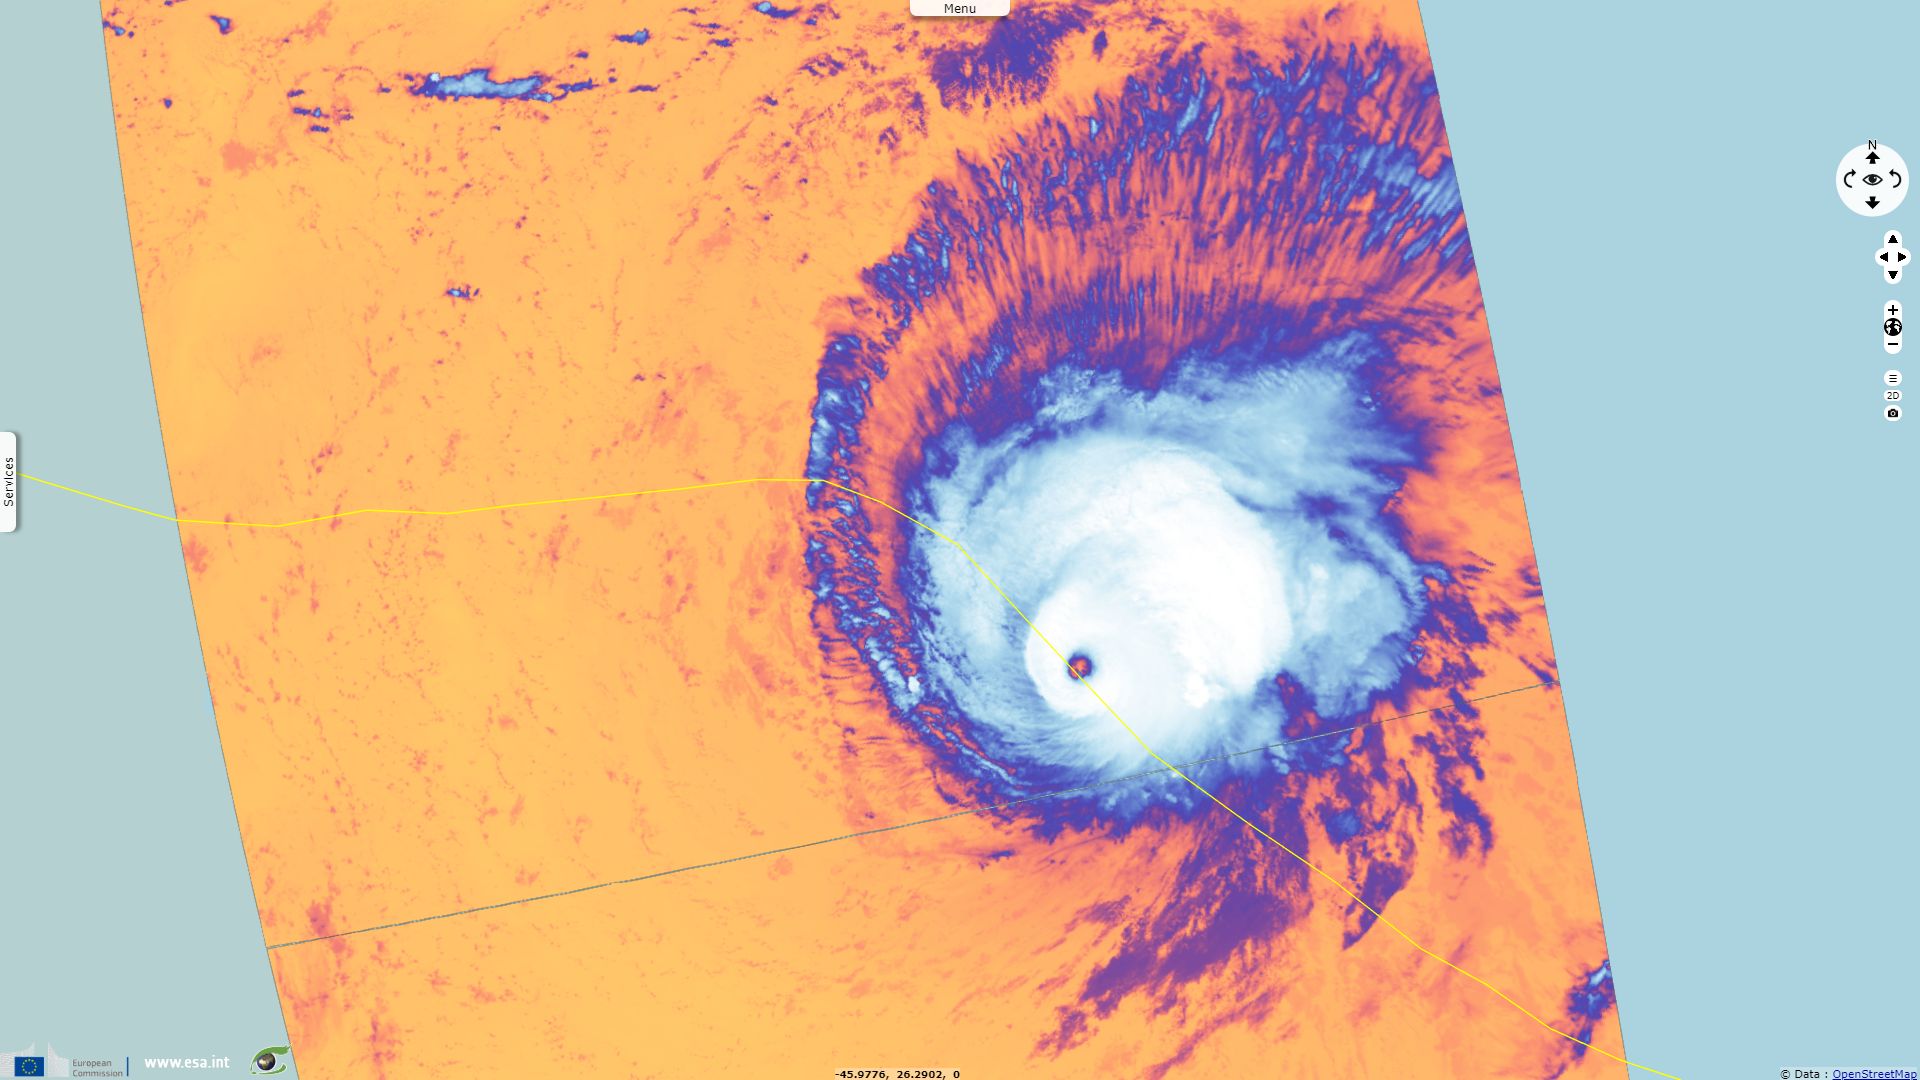
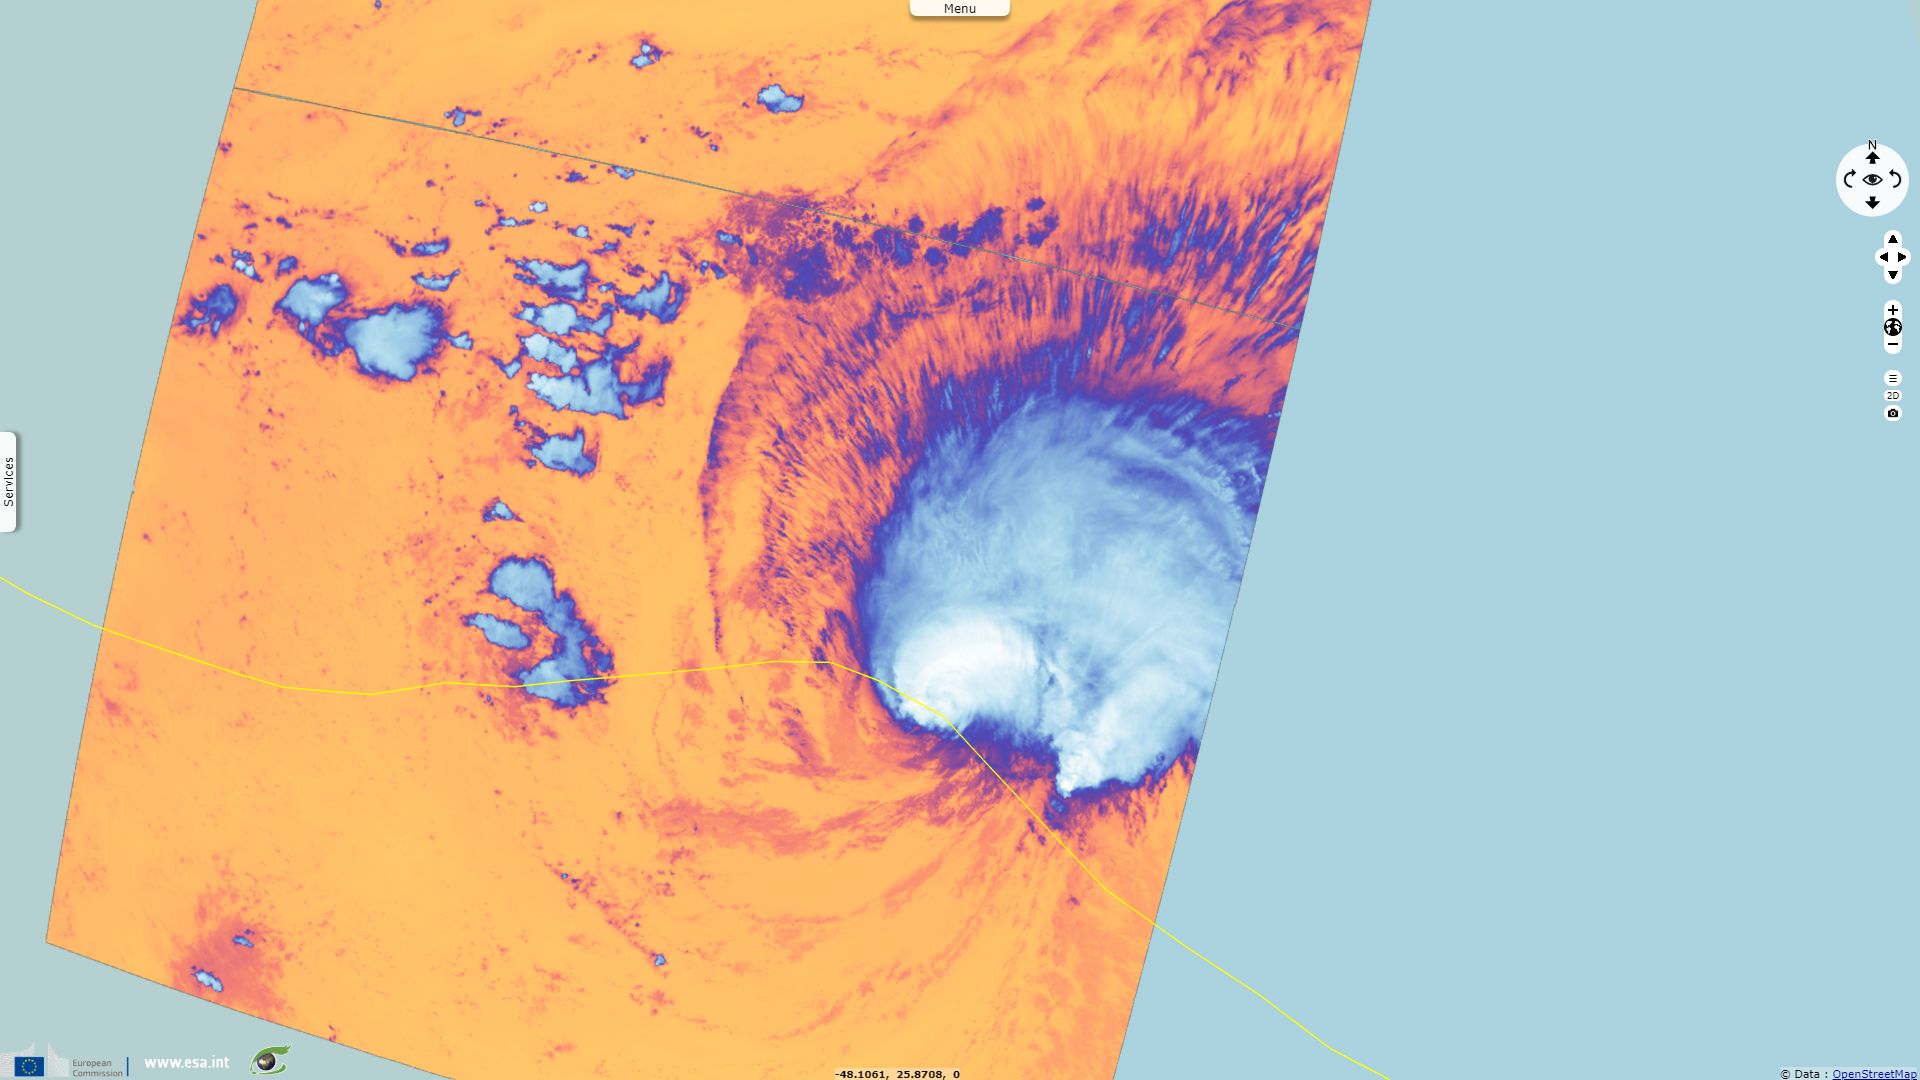
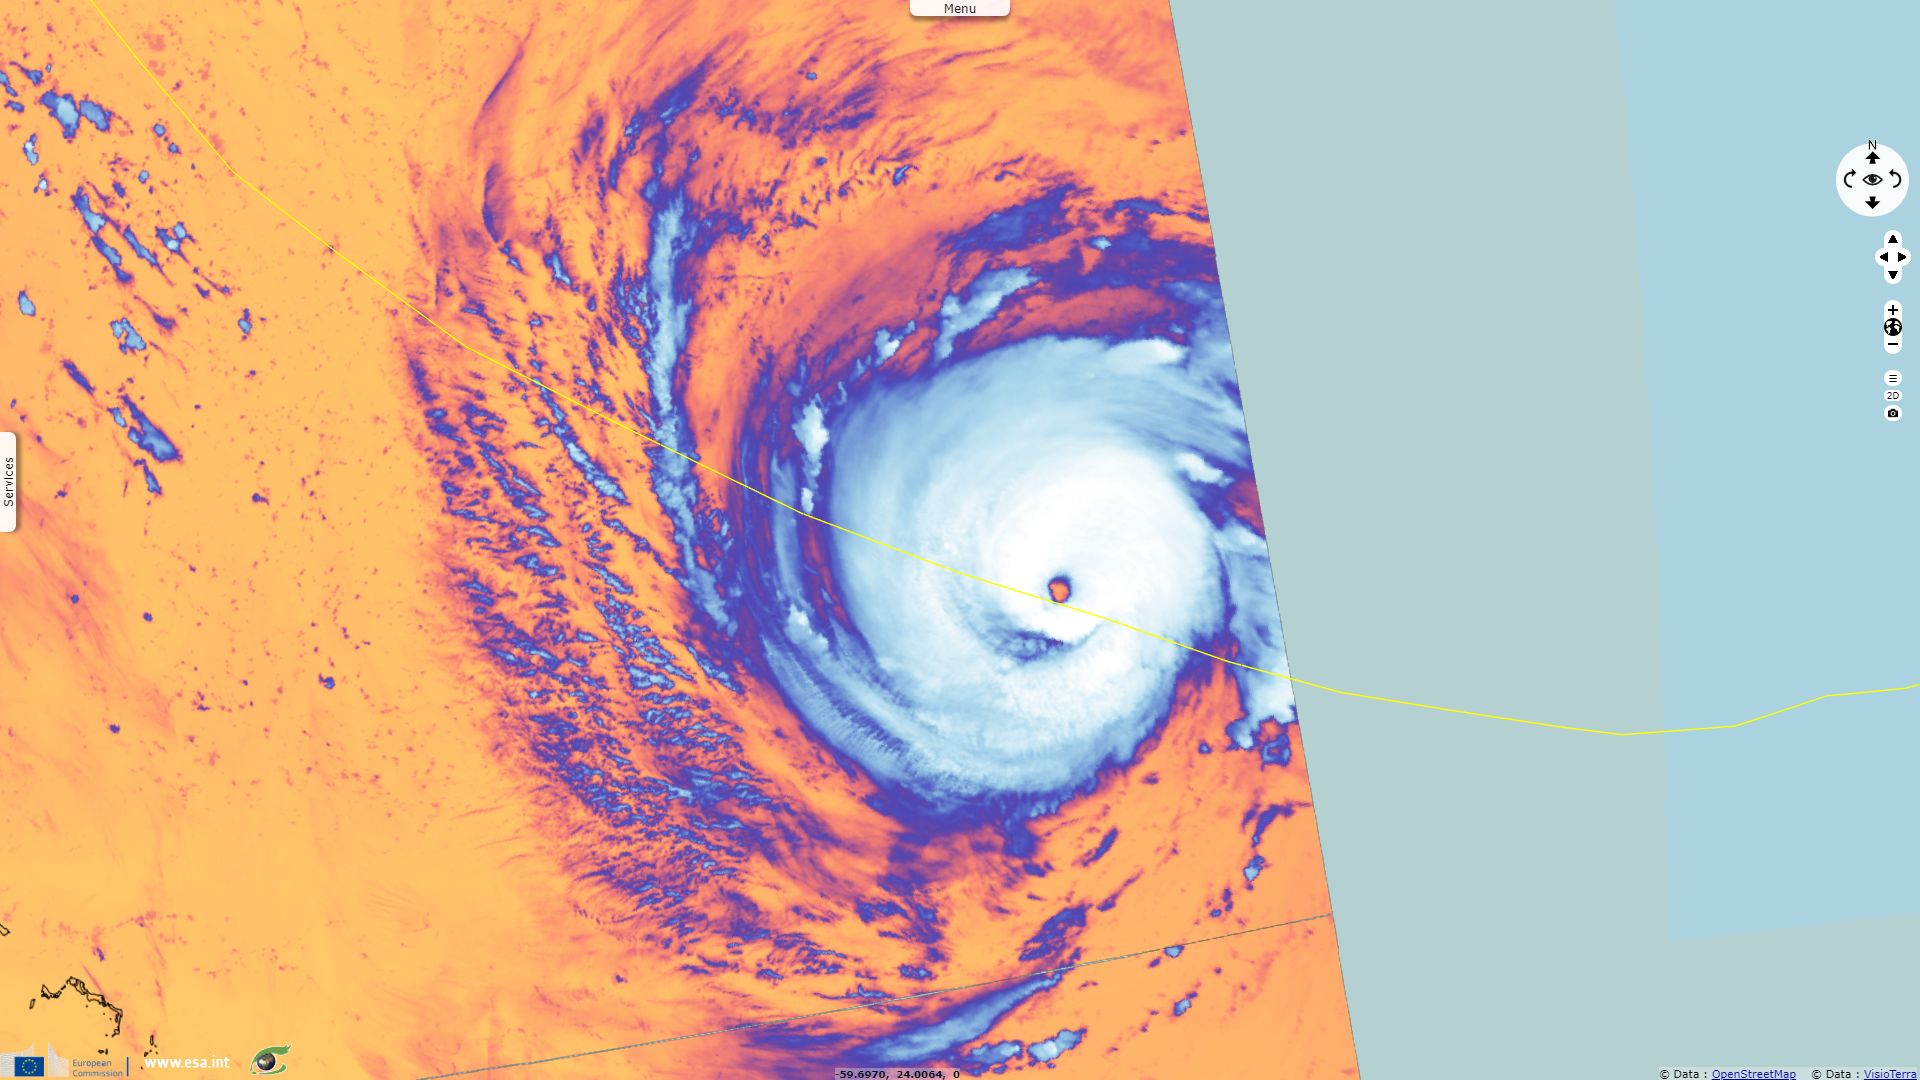
Sentinel-3 SLSTR RBT acquired on 06 September 2018 from 01:07:31 to 01:10:31 UTC & from 13:30:26 to 13:33:26 UTC
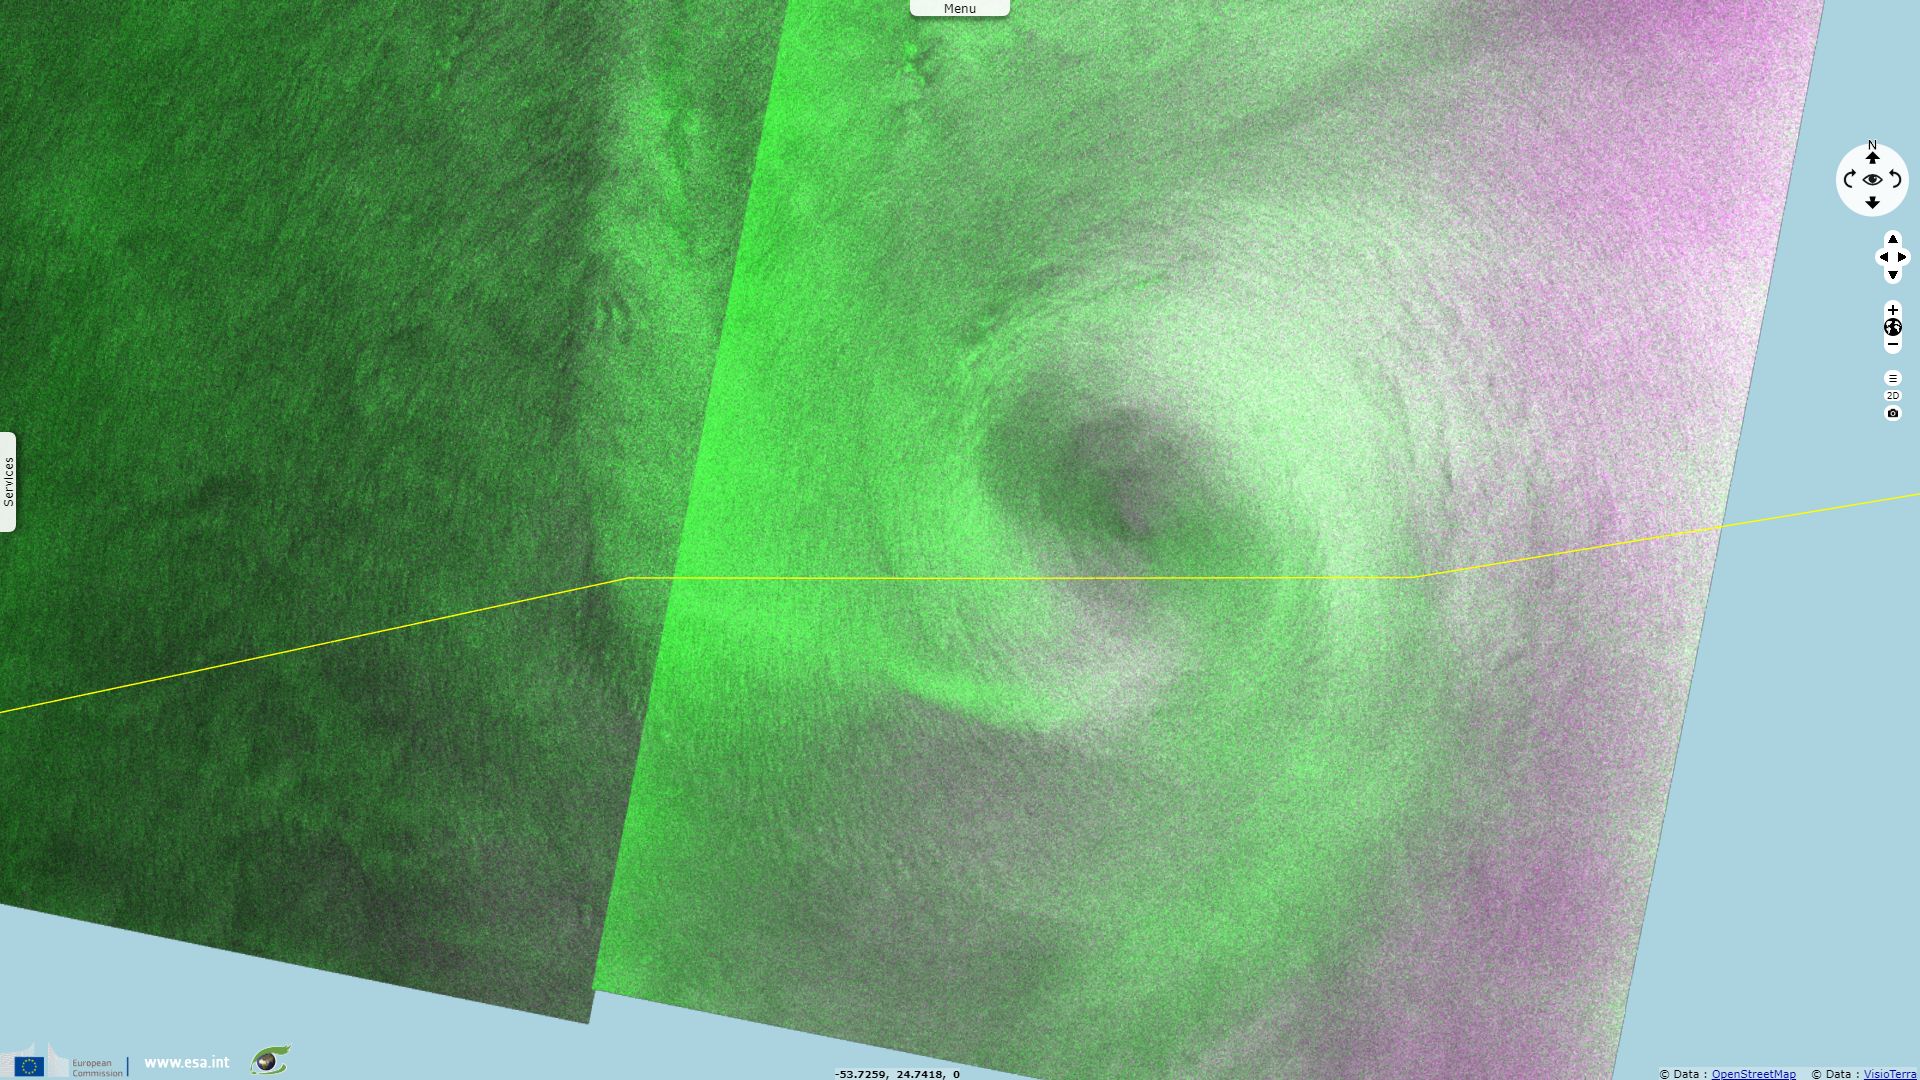
Sentinel-1 CSAR EW acquired on 07 September 2018 from 21:32:05 to 21:33:09 UTC
...
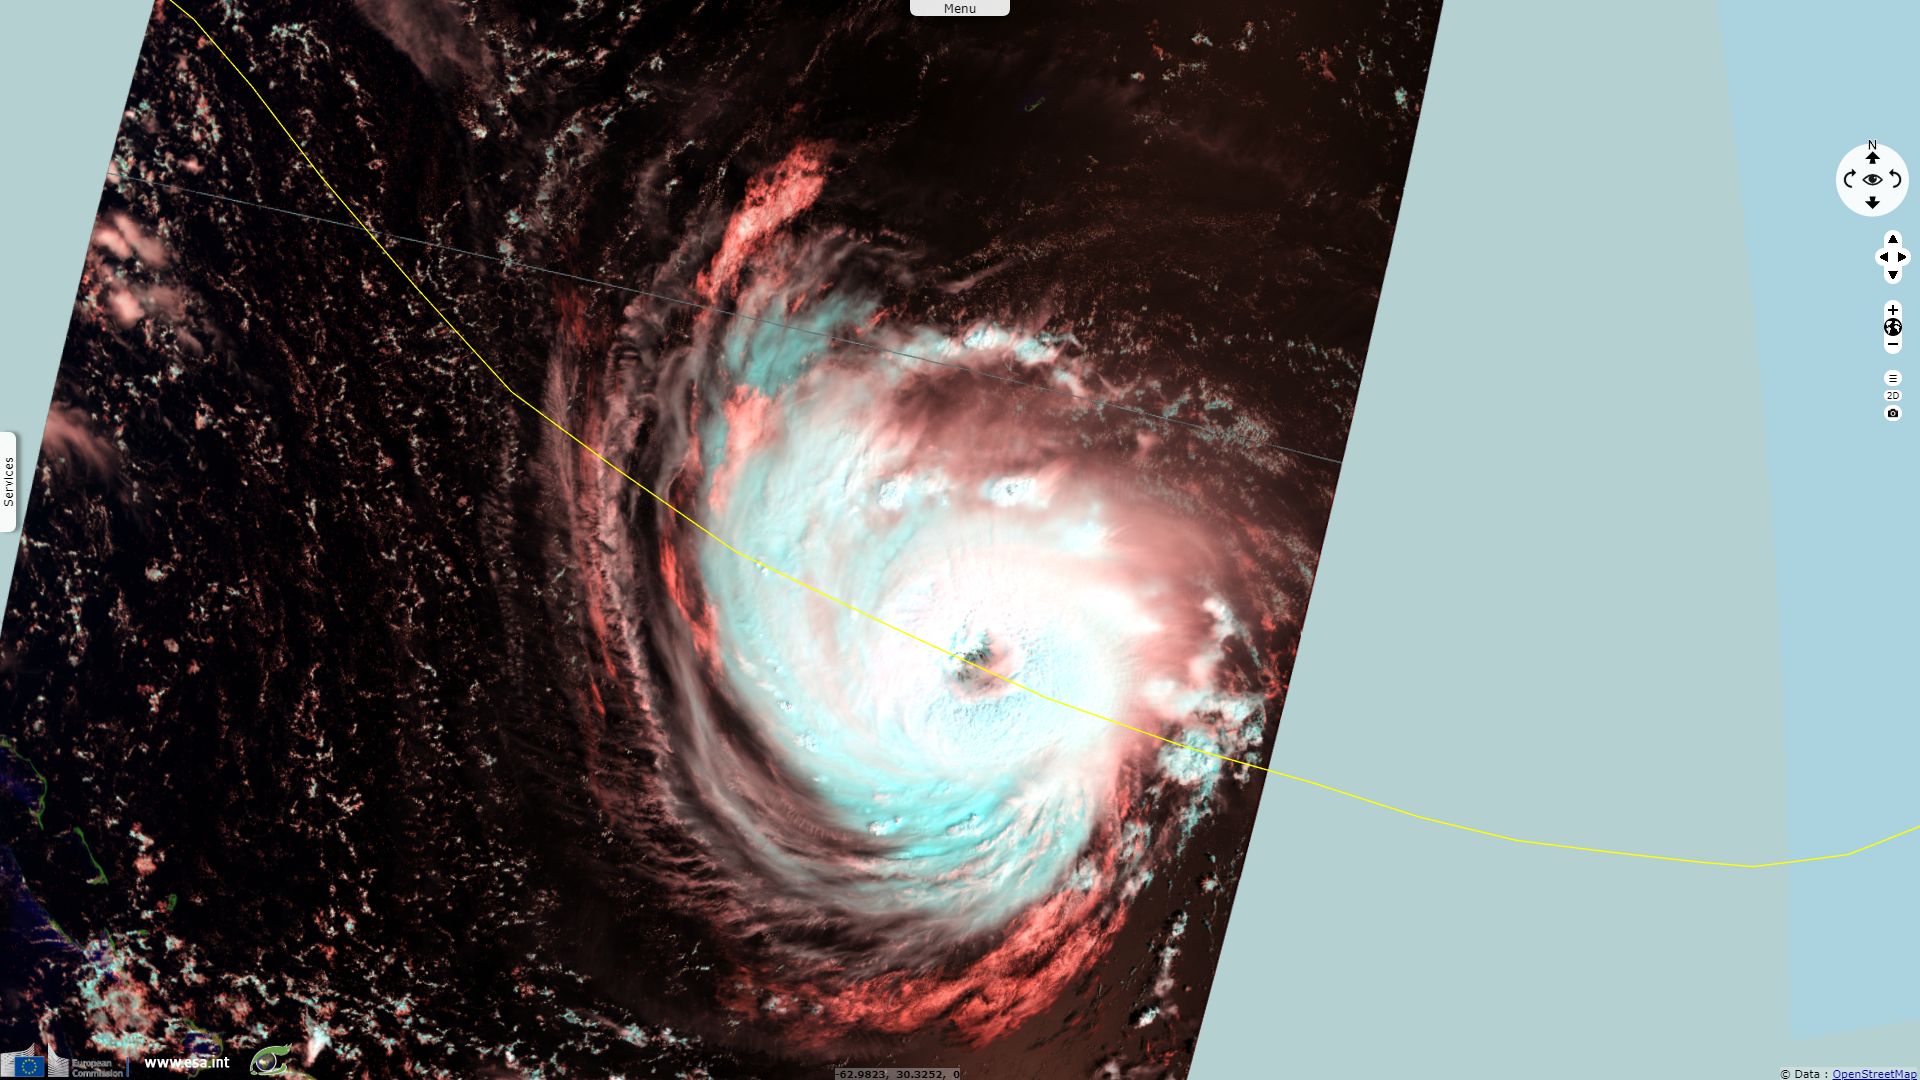
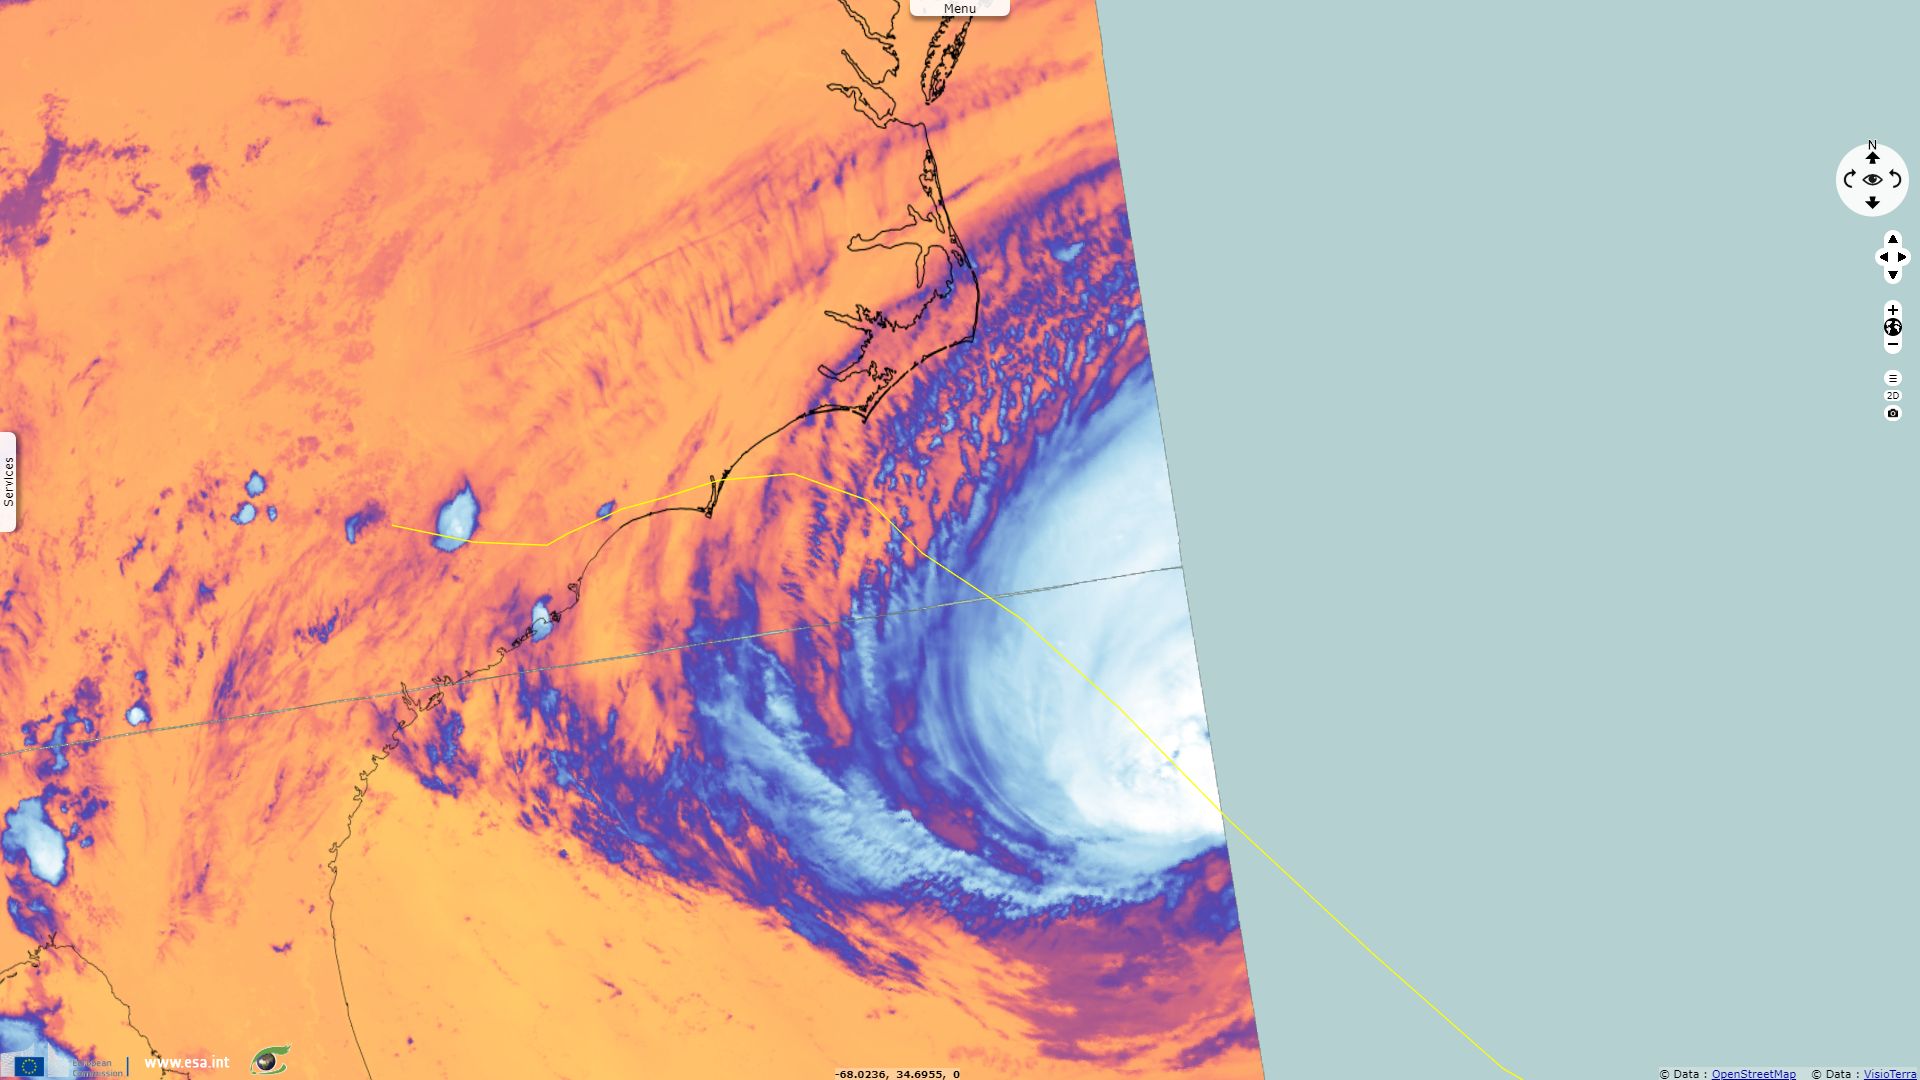
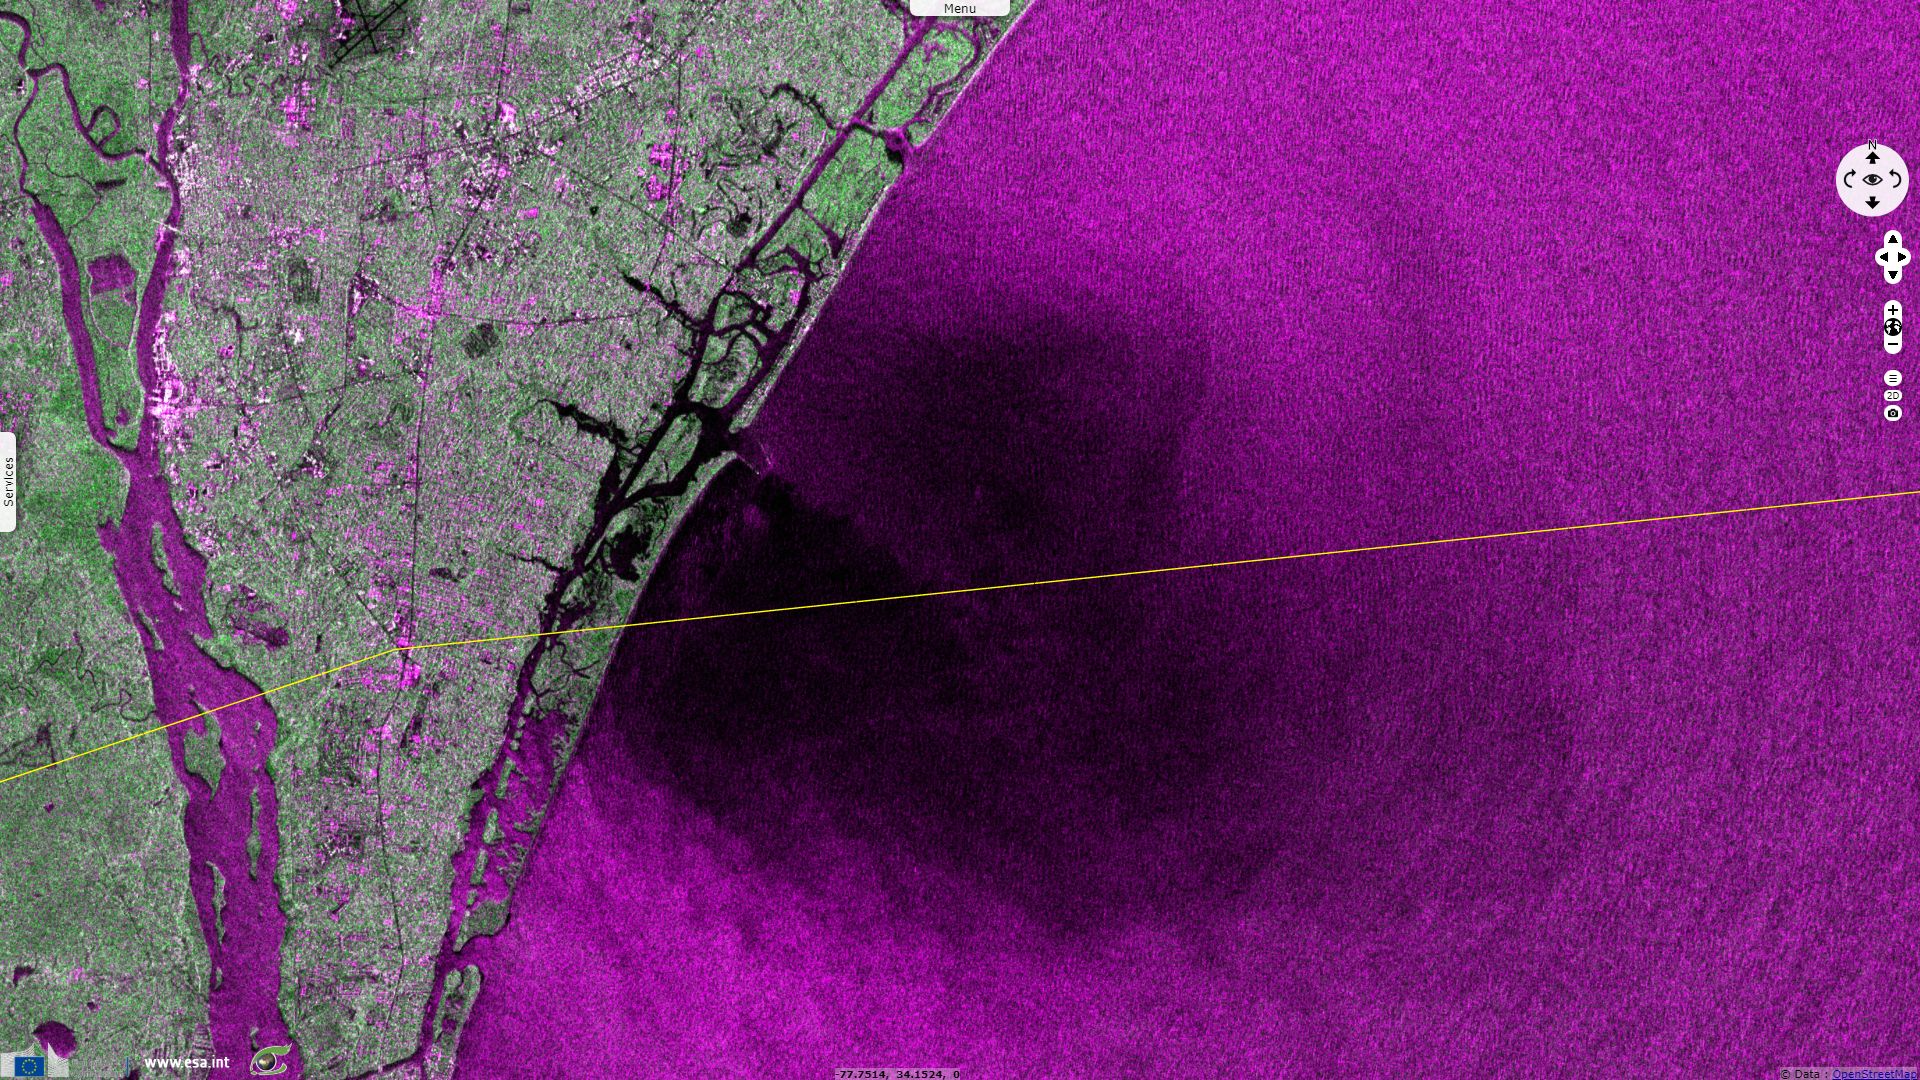
Sentinel-1 CSAR IW acquired on 14 September 2018 from 11:15:05 to 11:15:55 UTC
Sentinel-3 SLSTR RBT acquired on 06 September 2018 from 01:07:31 to 01:10:31 UTC & from 13:30:26 to 13:33:26 UTC
Sentinel-1 CSAR EW acquired on 07 September 2018 from 21:32:05 to 21:33:09 UTC
...
Sentinel-1 CSAR IW acquired on 14 September 2018 from 11:15:05 to 11:15:55 UTC
Keyword(s): Emergency, natural disaster, atmosphere, storm, climate change, wind, rain, cyclone, USA, United States
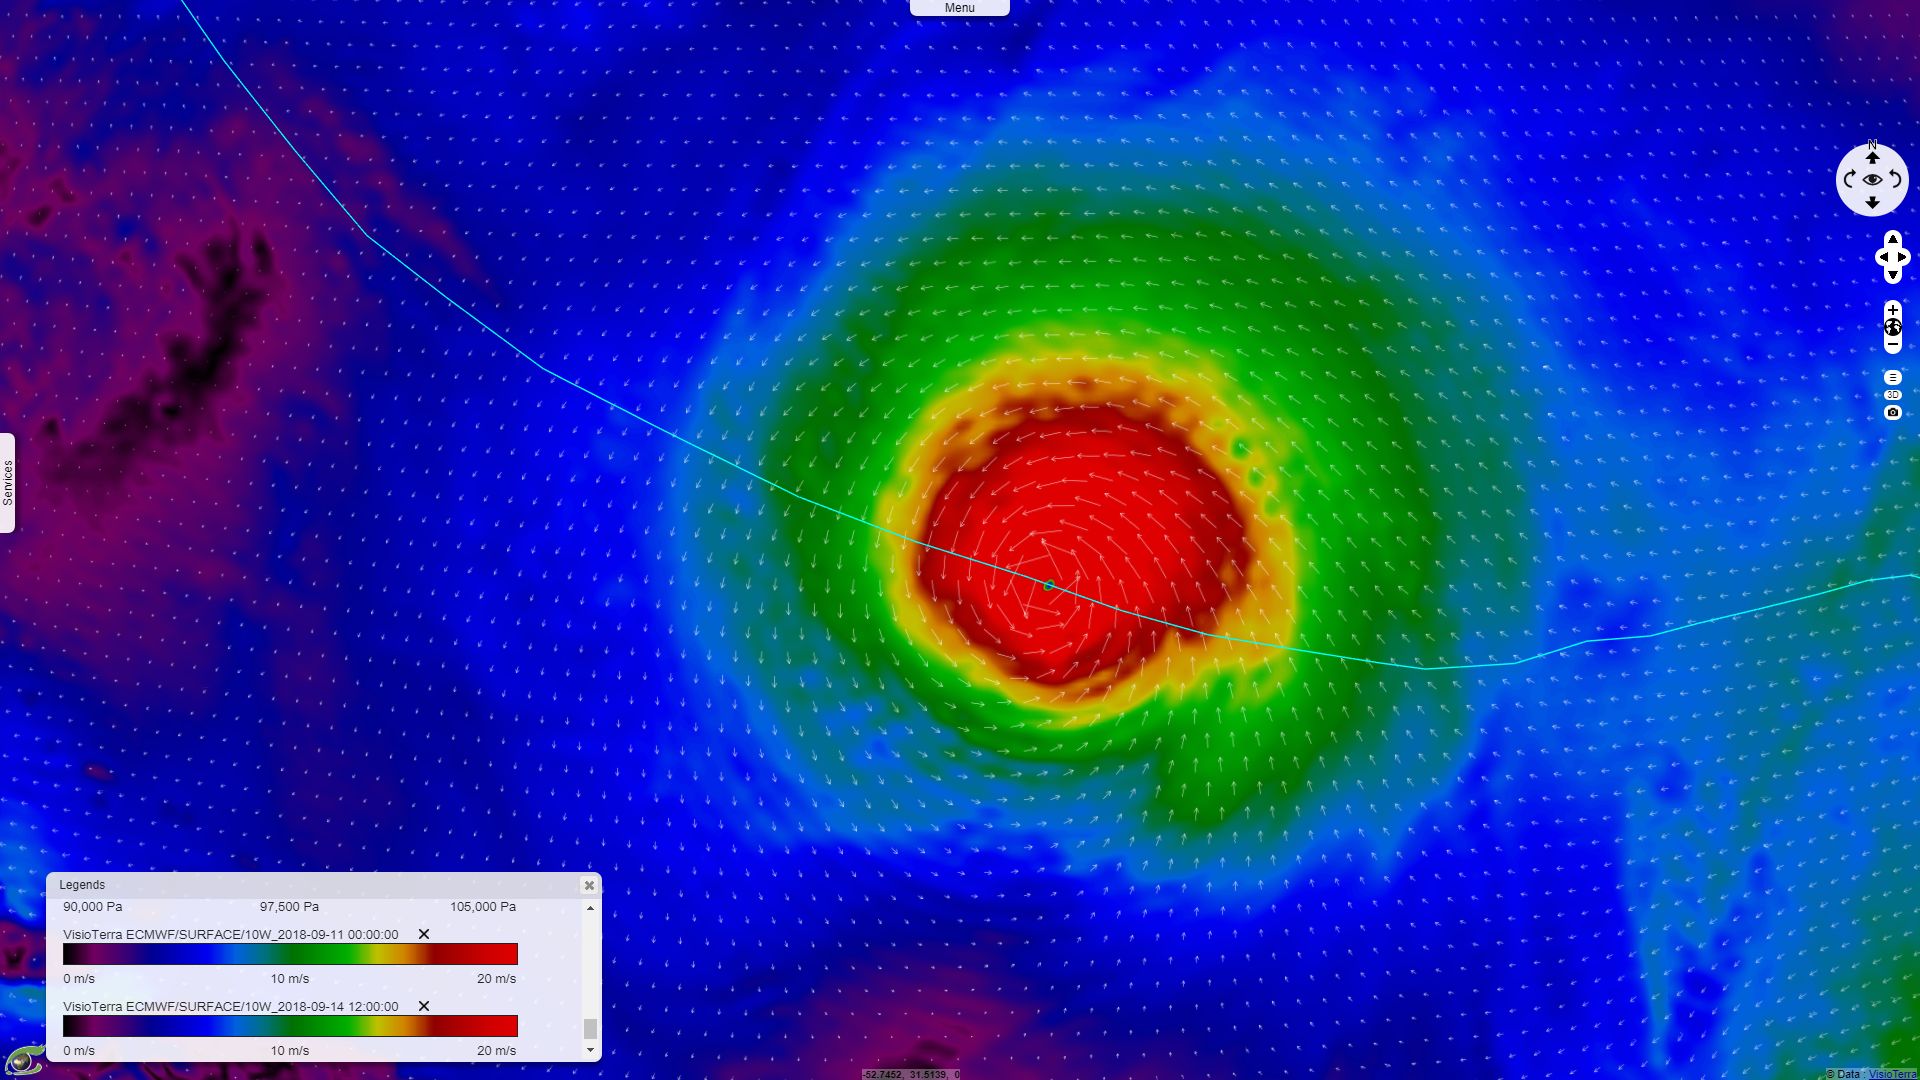
10-metre wind 11.09.2018 at 00:00 by ECMWF when Hurricane Florence was at its strongest 3D view in VtWeb
US National Oceanic and Atmospheric Administration (NOAA) Satellite and Information Service published: "At 2 p.m. September 12, Florence was located about 435 miles southeast of Wilmington, North Carolina and moving northwest at around 16 mph. Hurricane-force winds extend up to 70 miles from the center of the storm, and will begin reaching the coast of the Carolinas by Thursday morning. Hurricane warnings are in effect across the entire North Carolina coast and parts of northern South Carolina, while flash flood watches extend inland away from the coast in both states.
The National Hurricane Center warns that Florence may slow down considerably late Thursday into Friday as it makes landfall, elevating the risk of "life-threatening storm surge" along the coast and high potential for catastrophic flooding as the storm dumps "heavy and excessive rainfall" across the Carolinas."
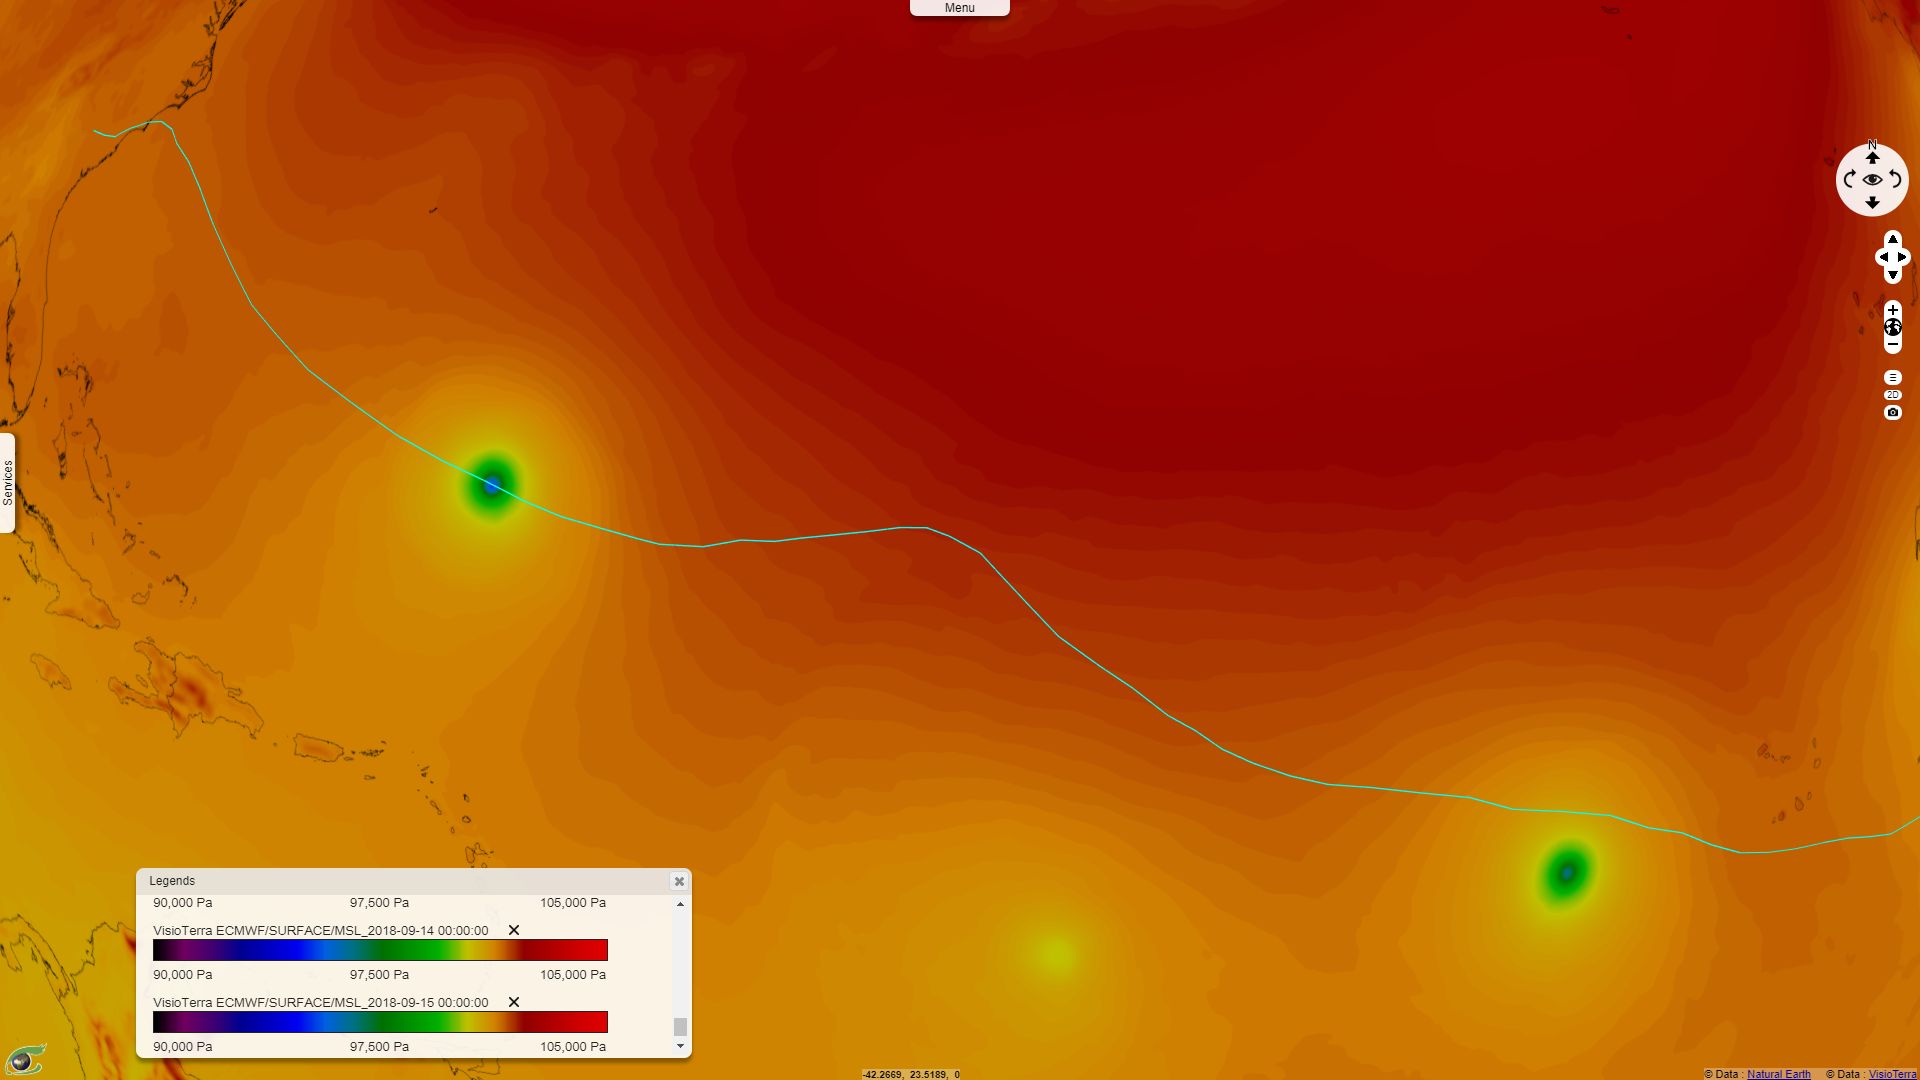
Mean sea level pressure 11.09.2018 at 00:00 by ECMWF when Hurricane Florence was at its strongest 3D animation in VtWeb 3D view in VtWeb
Before Florece reached the US coast, Disater Charter wrote: "Florence is the most powerful storm to threaten the Carolinas in almost thirty years with current sustained wind speeds of over 140mph. The region could be without power for several days. Storm surge is also predicted to flood large areas. A state of emergency has already been declared in Virginia, Maryland, Washington DC as well as North and South Carolina. Officials have already asked residents in low-lying coastal areas to leave their homes with a million people expected to evacuate."
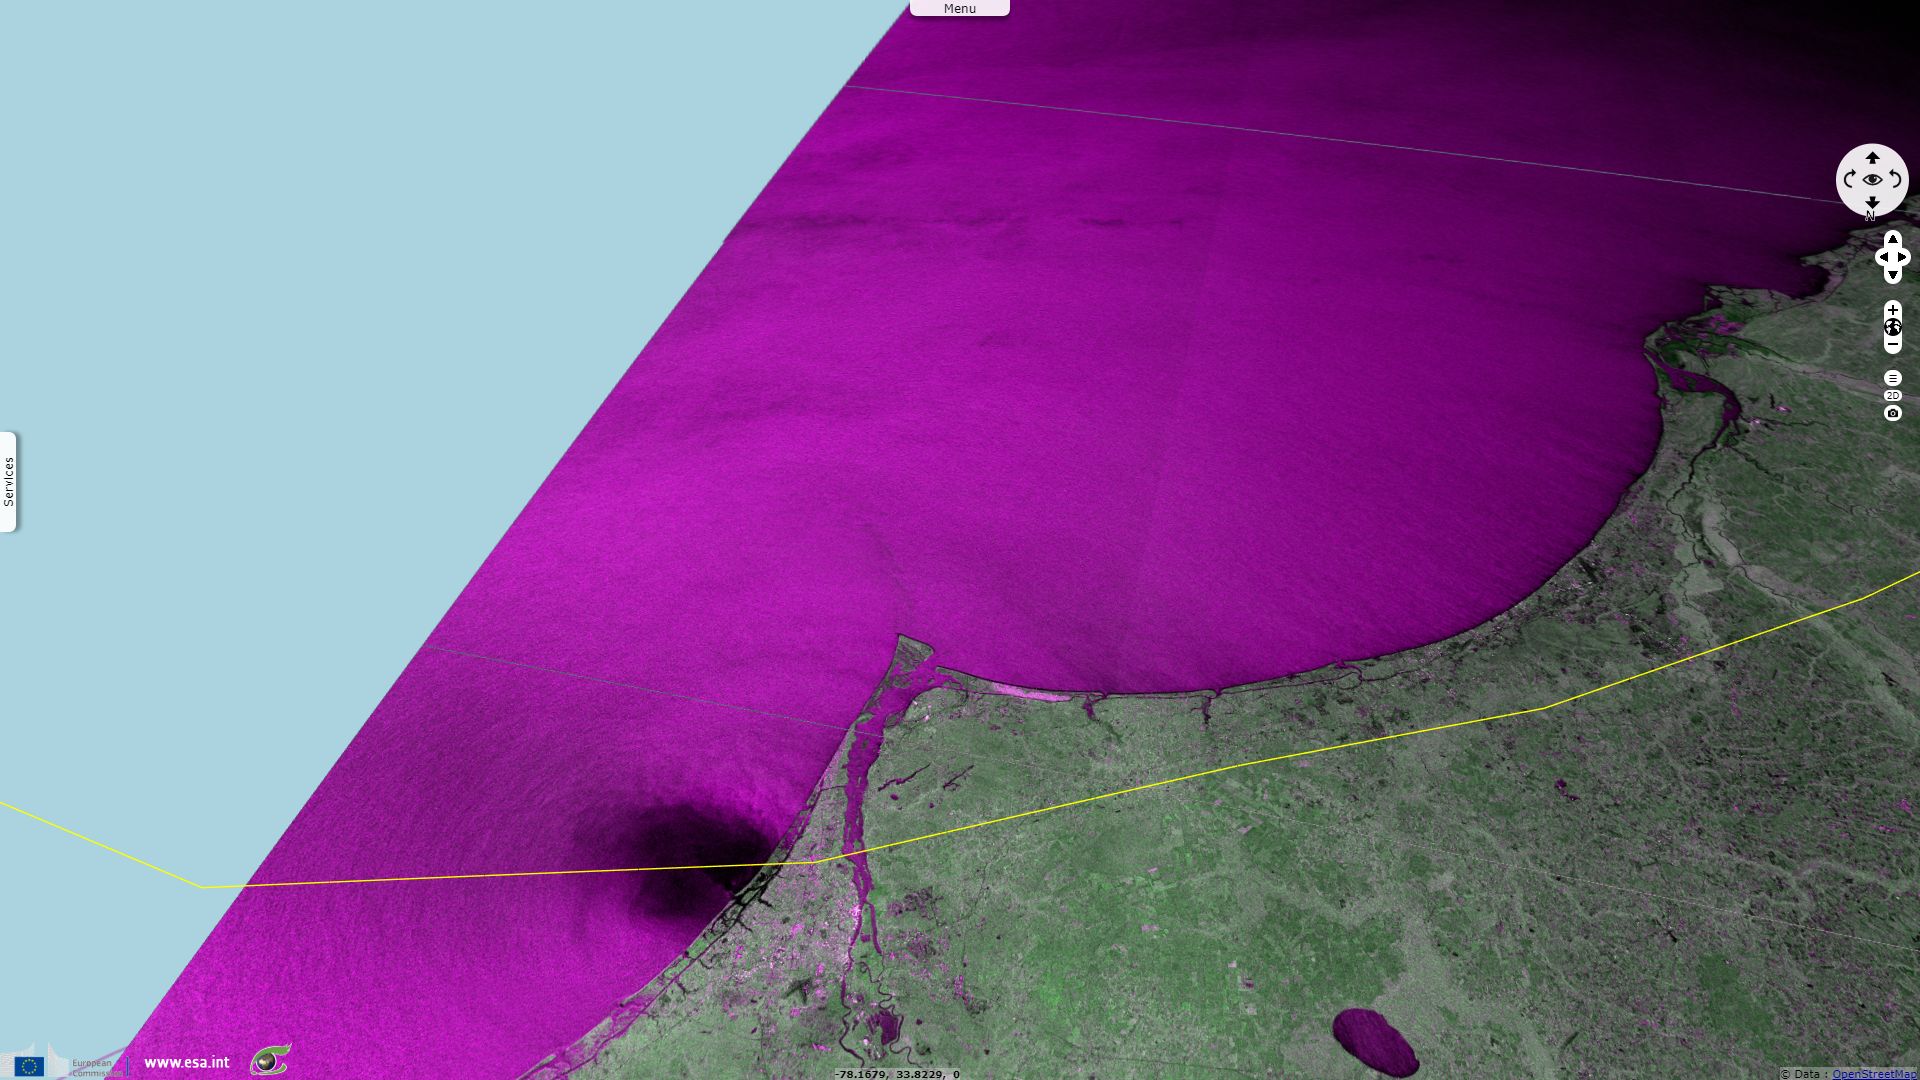
One can see how sea surface waves caused by Florence wind only weaken far away from the eye. Important storm surge was observed on the south-east coast of USA. At least 45 people were killed directly or indirectly by Florence, the economic toll should exceed one billion dollars of damage.
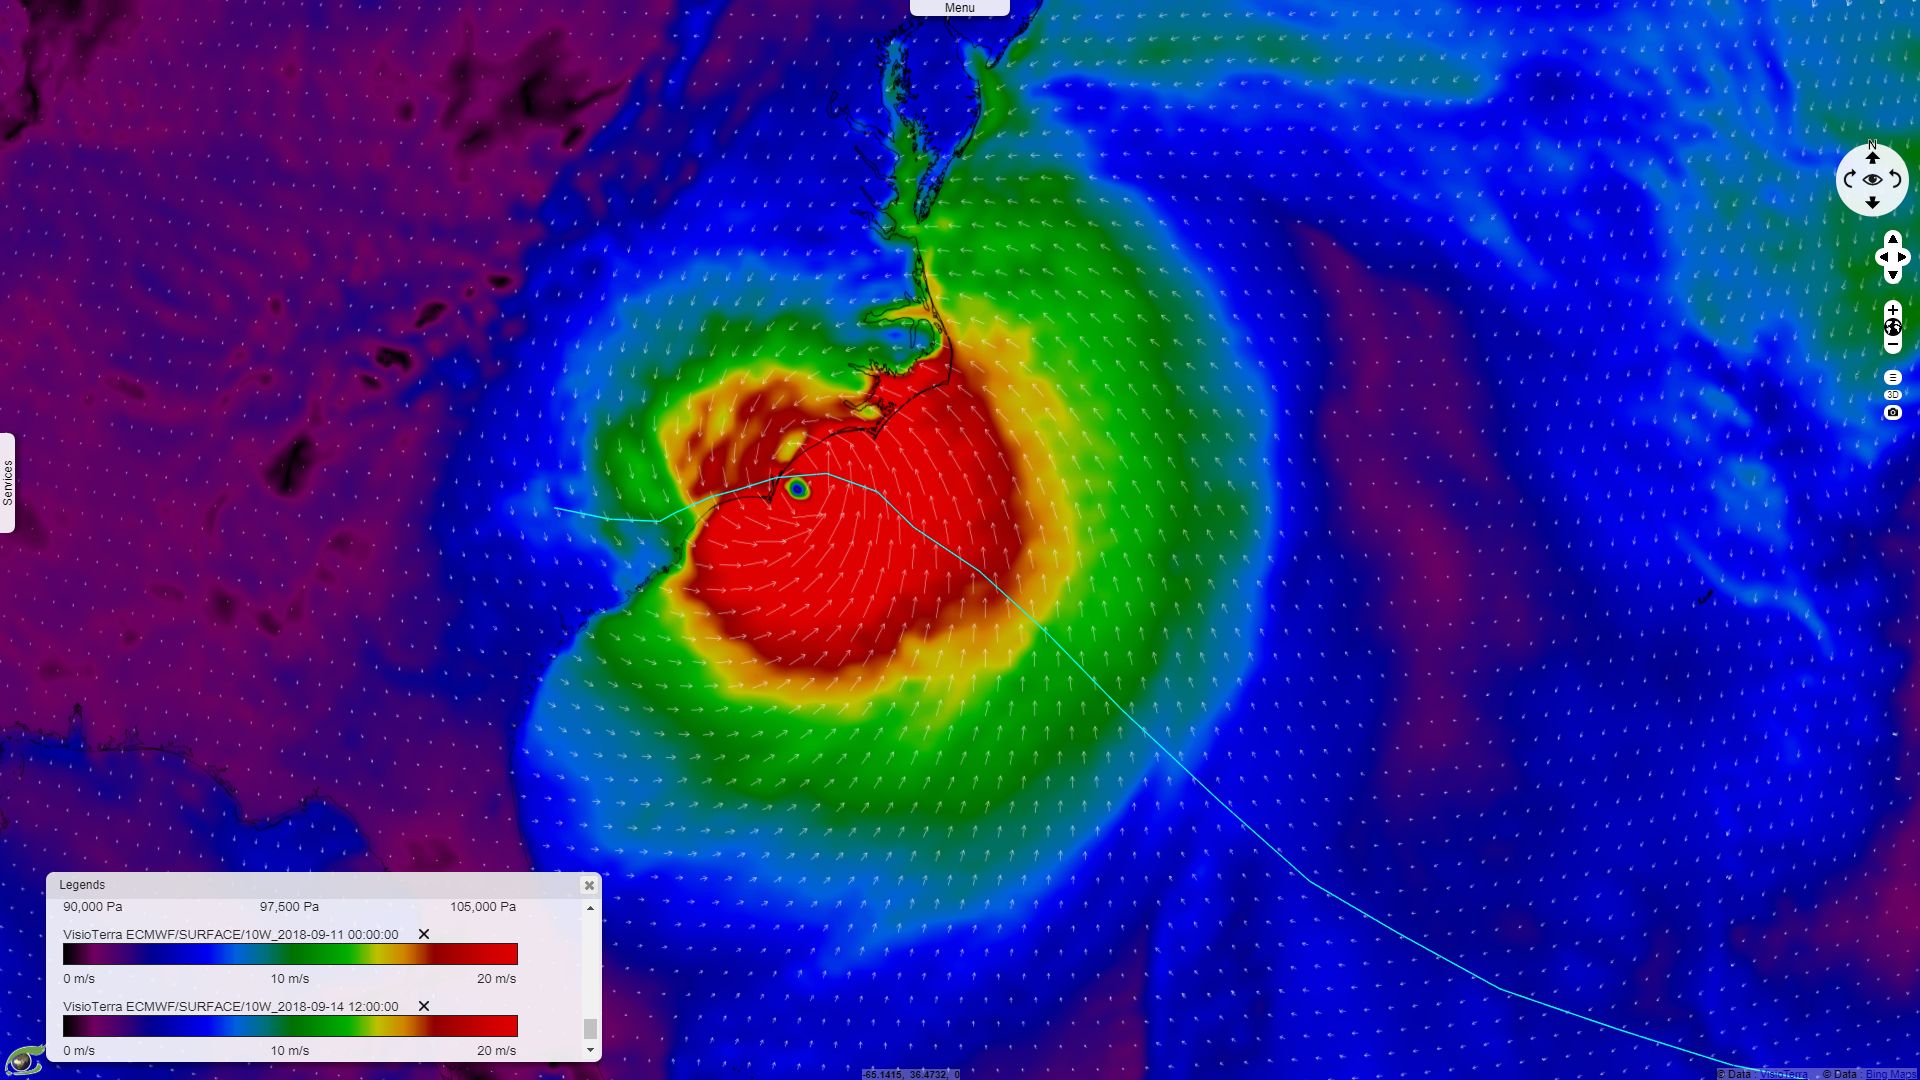
10-metre wind 14.09.2018 at 12:00 by ECMWF when Hurricane Florence was about to hit North Carolina, notice how even friction with even low lying land reduces wind speed 3D view in VtWeb
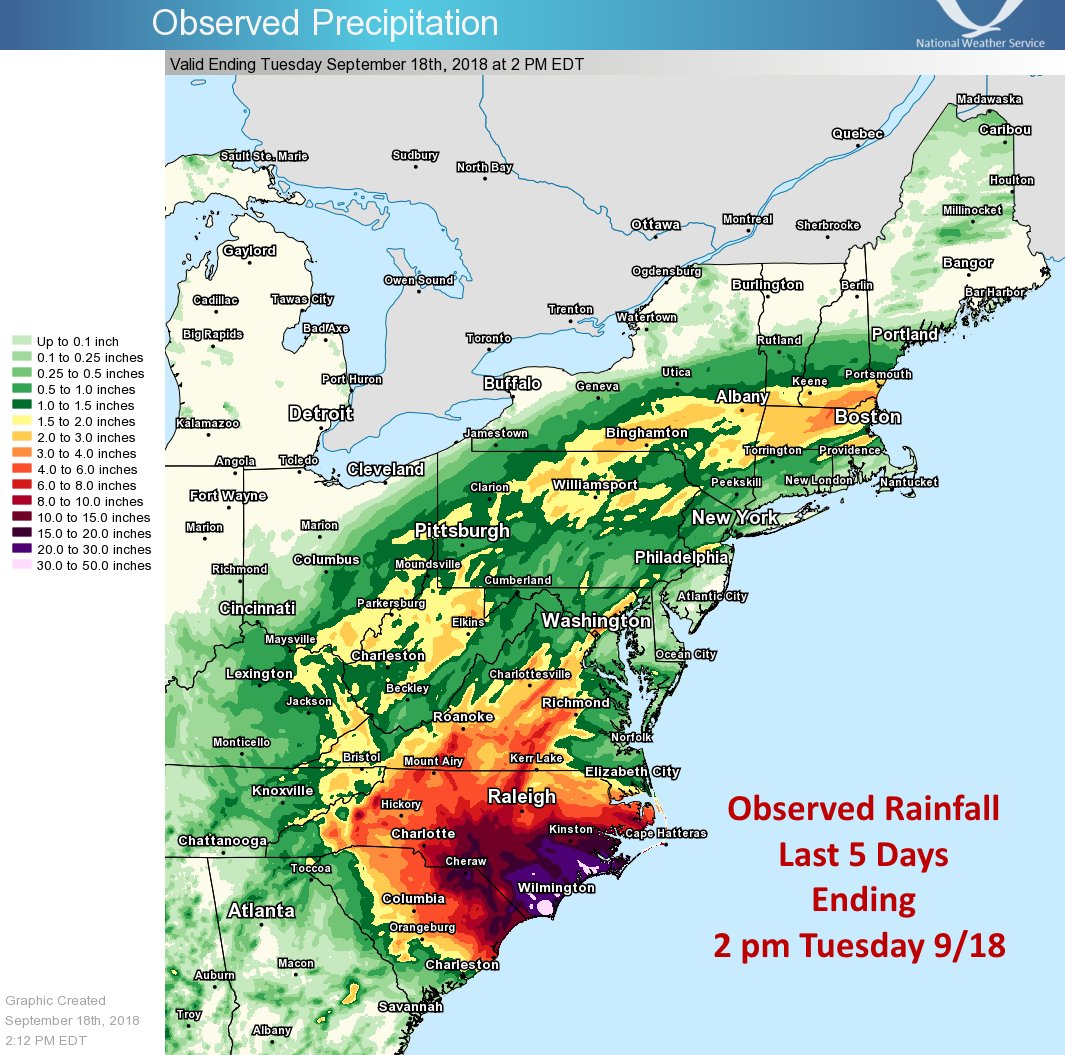
Left: Here is the latest observed rainfall map from Florence. Totals are from the last 5 days ending 2 pm this afternoon (Tuesday September 18th) - source: National Weather Service Eastern Region.
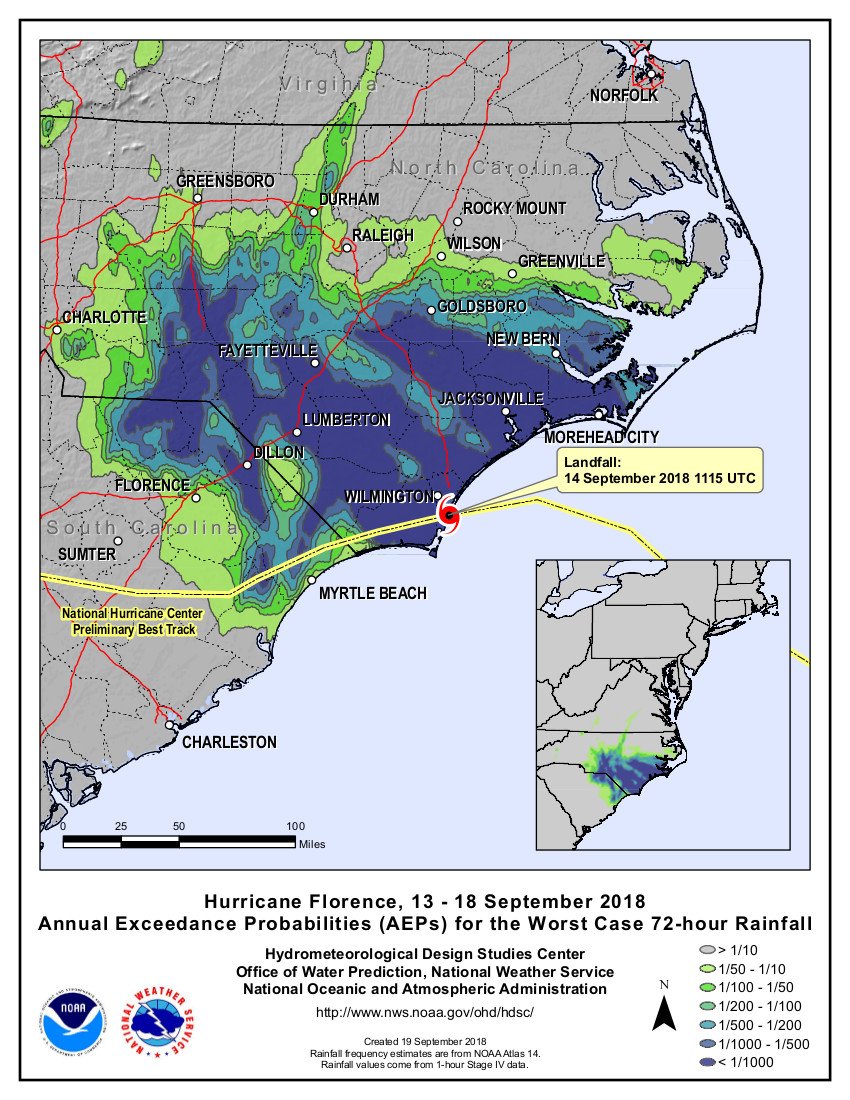
Right: The NOAA/NWS Hydrometeorological Design Studies Center analysis of the 3-day rainfall totals from Florence confirms that a large area exceeded the 0.1% probability event expected in given year, or “1000-year” event - source: National Weather Service Eastern Region.
The views expressed herein can in no way be taken to reflect the official opinion of the European Space Agency or the European Union.
Contains modified Copernicus Sentinel data 2026, processed by VisioTerra.
Contains modified Copernicus Sentinel data 2026, processed by VisioTerra.
| More on European Commission space: |  |
 |
 |
||||
| More on ESA: | |
|
|
S-1 website | S-2 website | S-3 website | |
| More on Copernicus program: | |
|
|
Scihub portal | Cophub portal | Inthub portal | Colhub portal |
| More on VisioTerra: | |
|
|
Sentinel Vision Portal | Envisat+ERS portal | Swarm+GOCE portal | CryoSat portal |