Cyclone Kenanga examined by Sentinel-5P
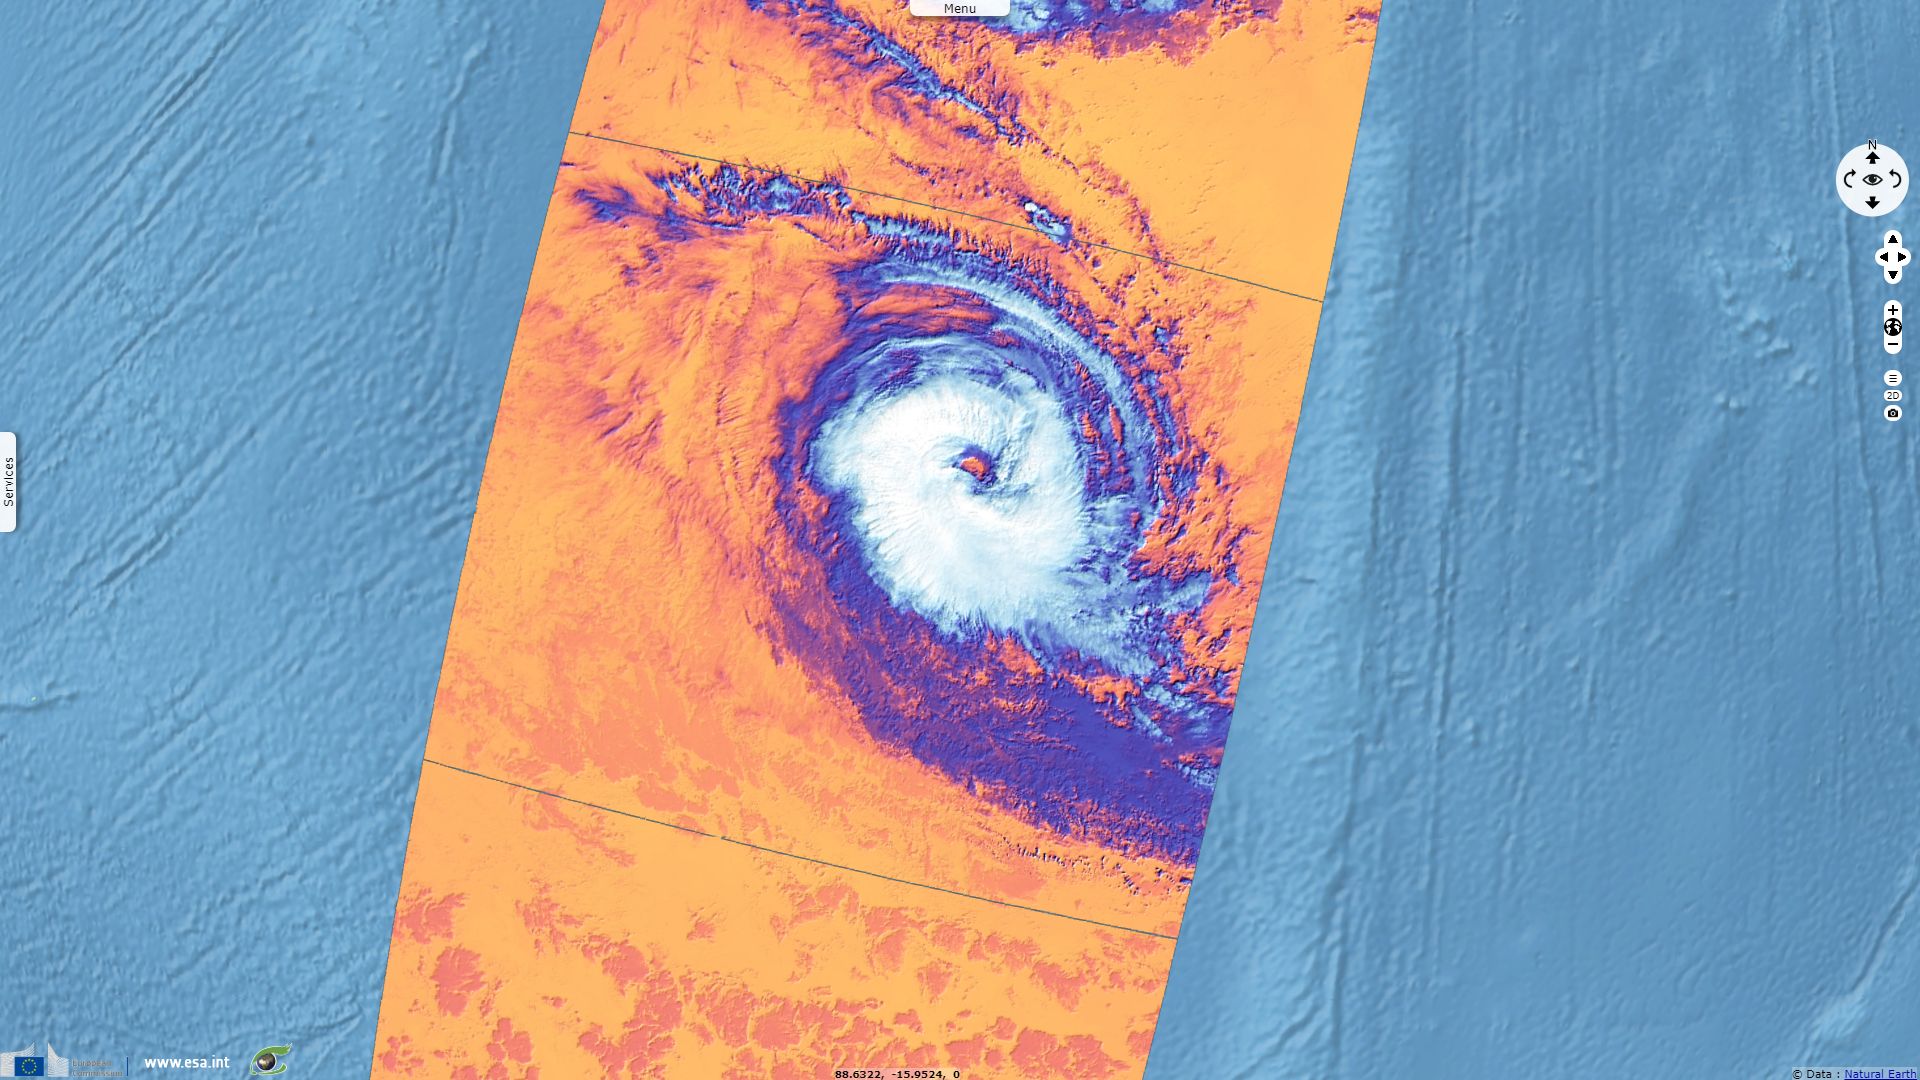
Sentinel-5P TROPOMI CLOUD acquired on 15 December 2018 from 06:08:24 to 07:53:25 UTC
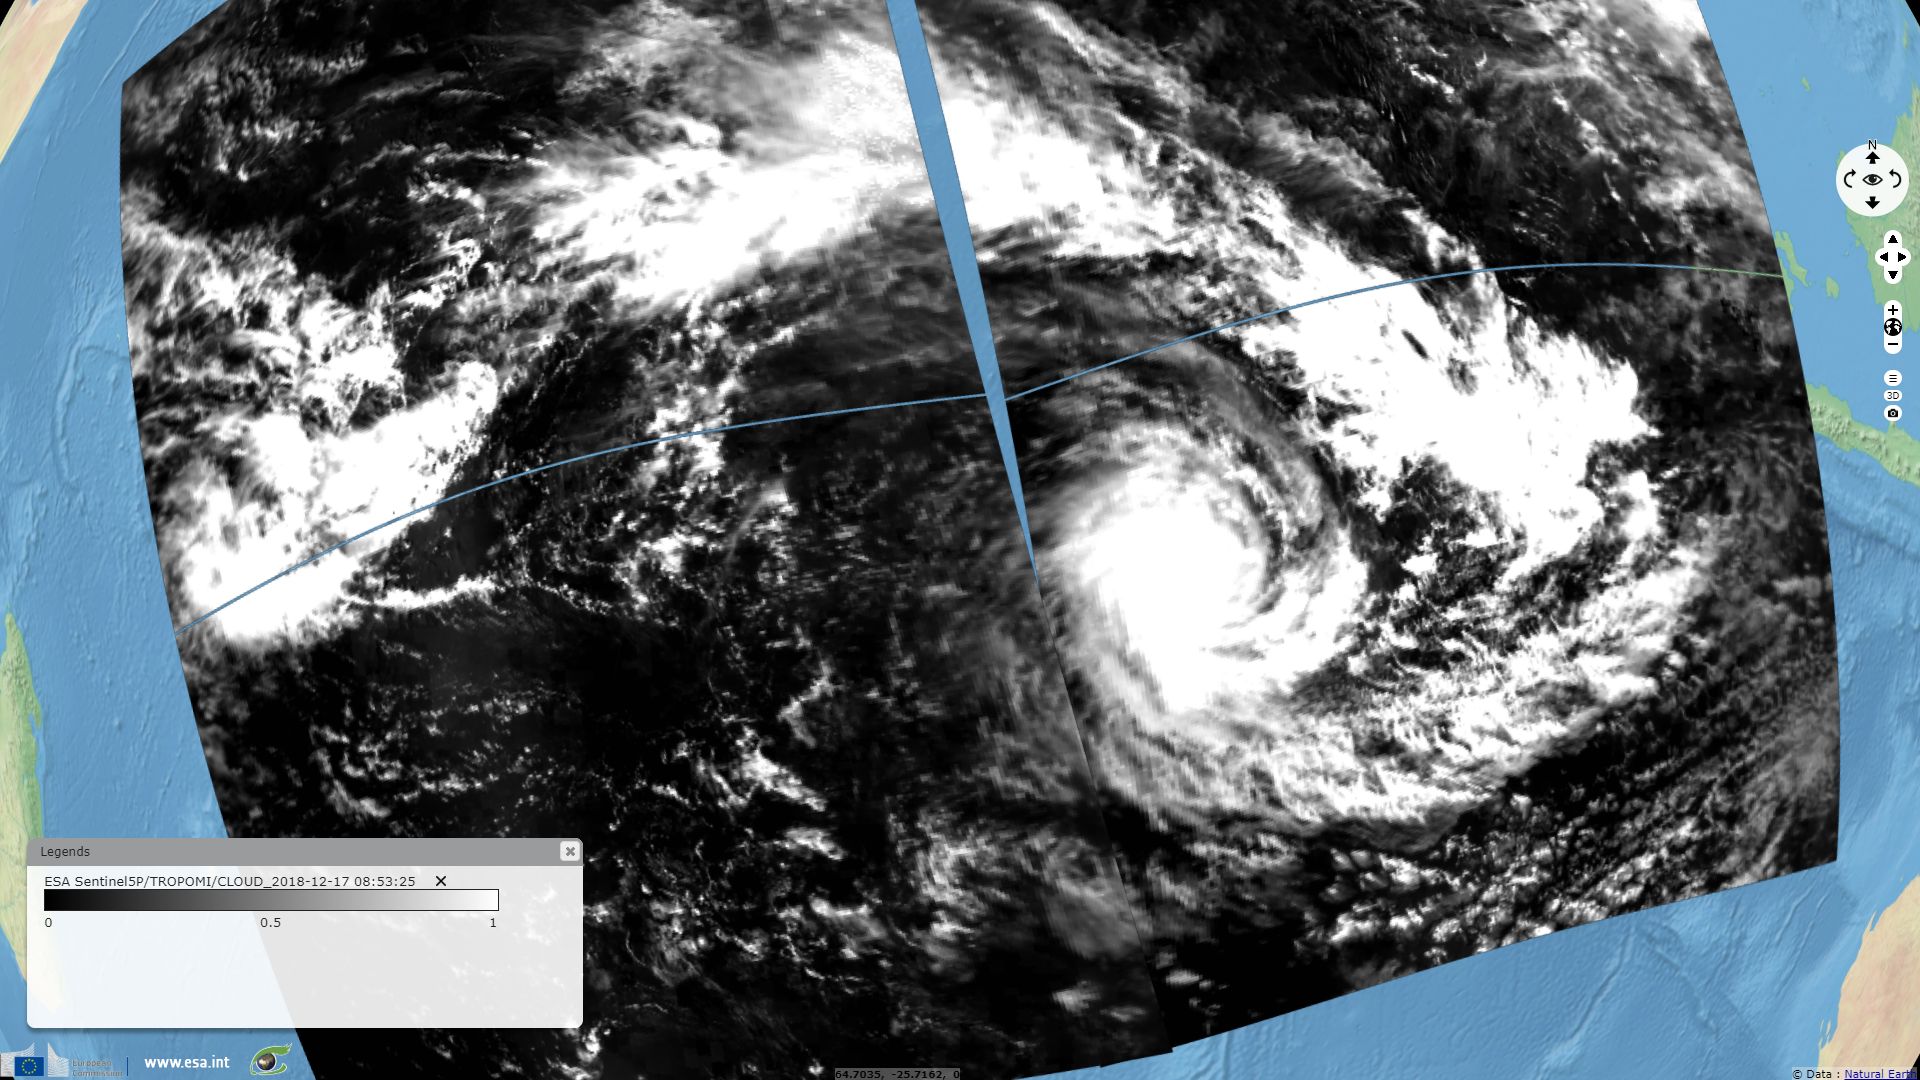
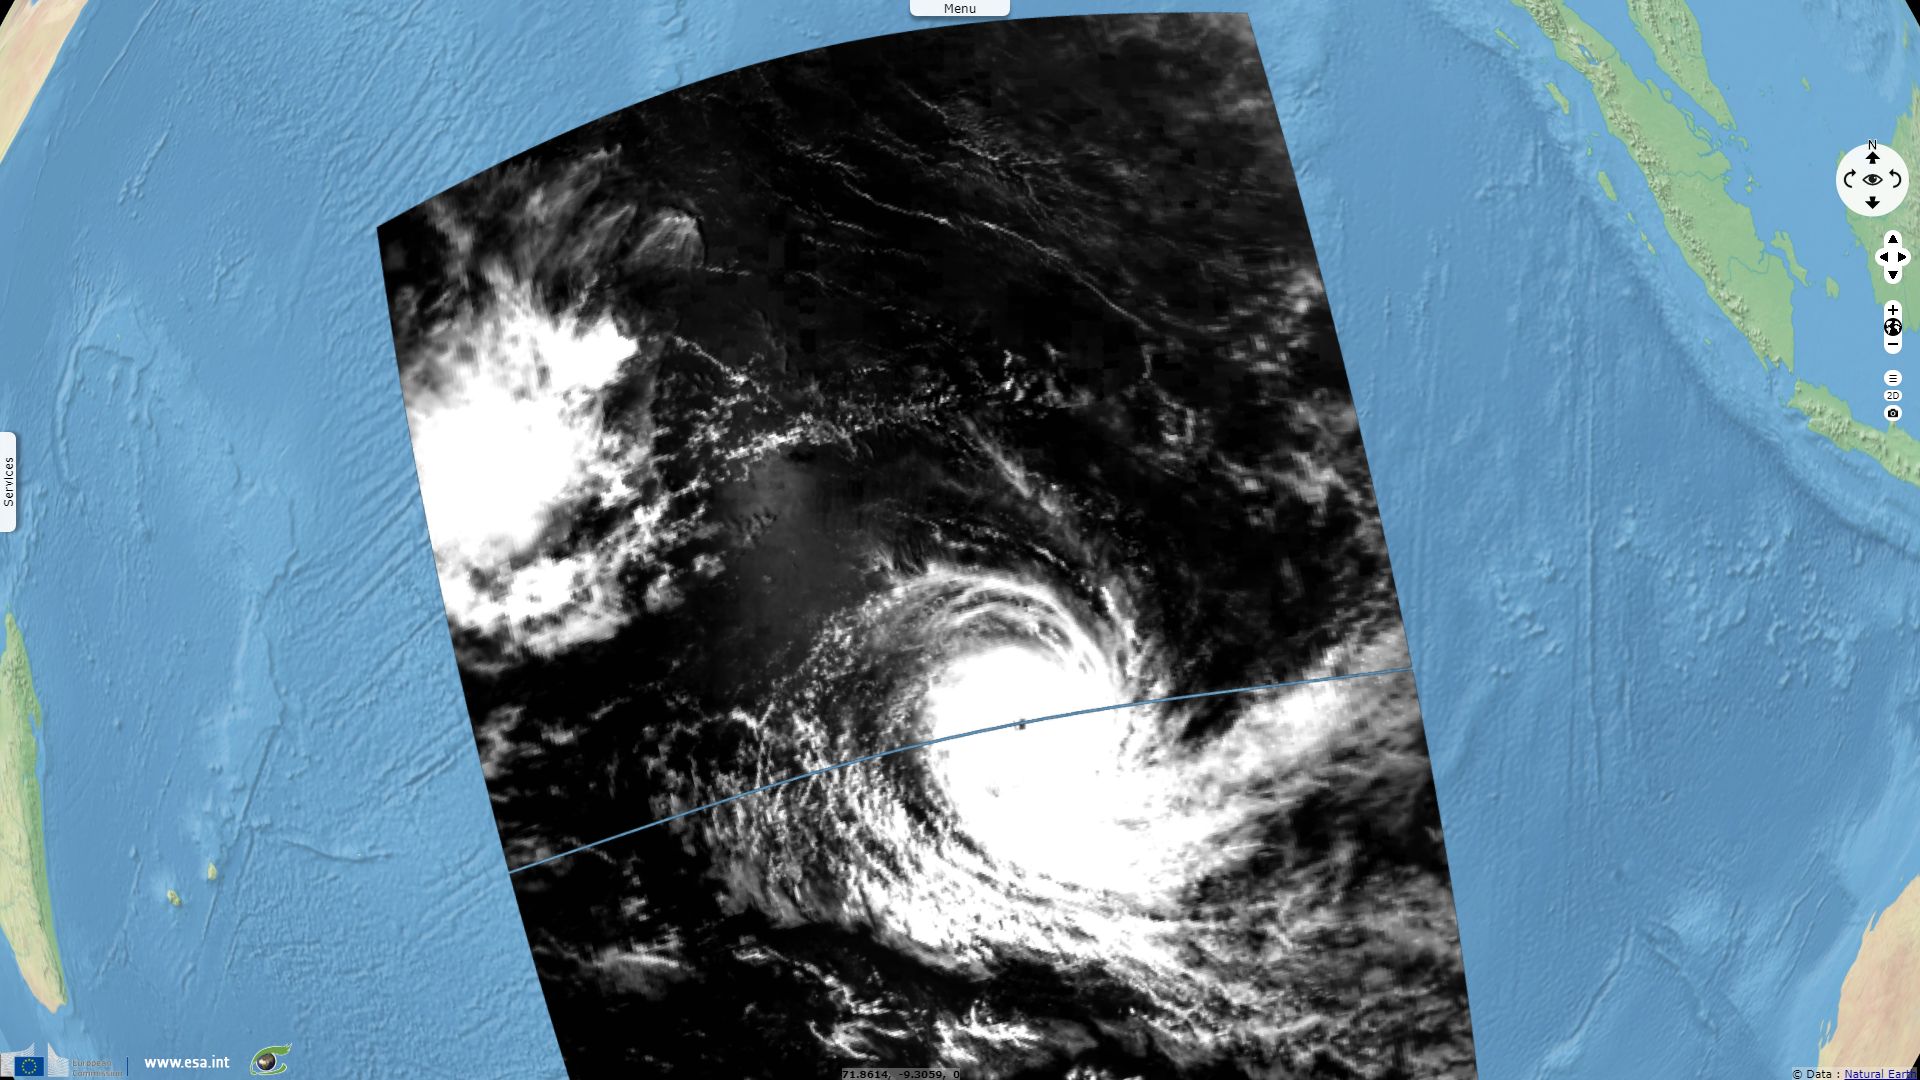
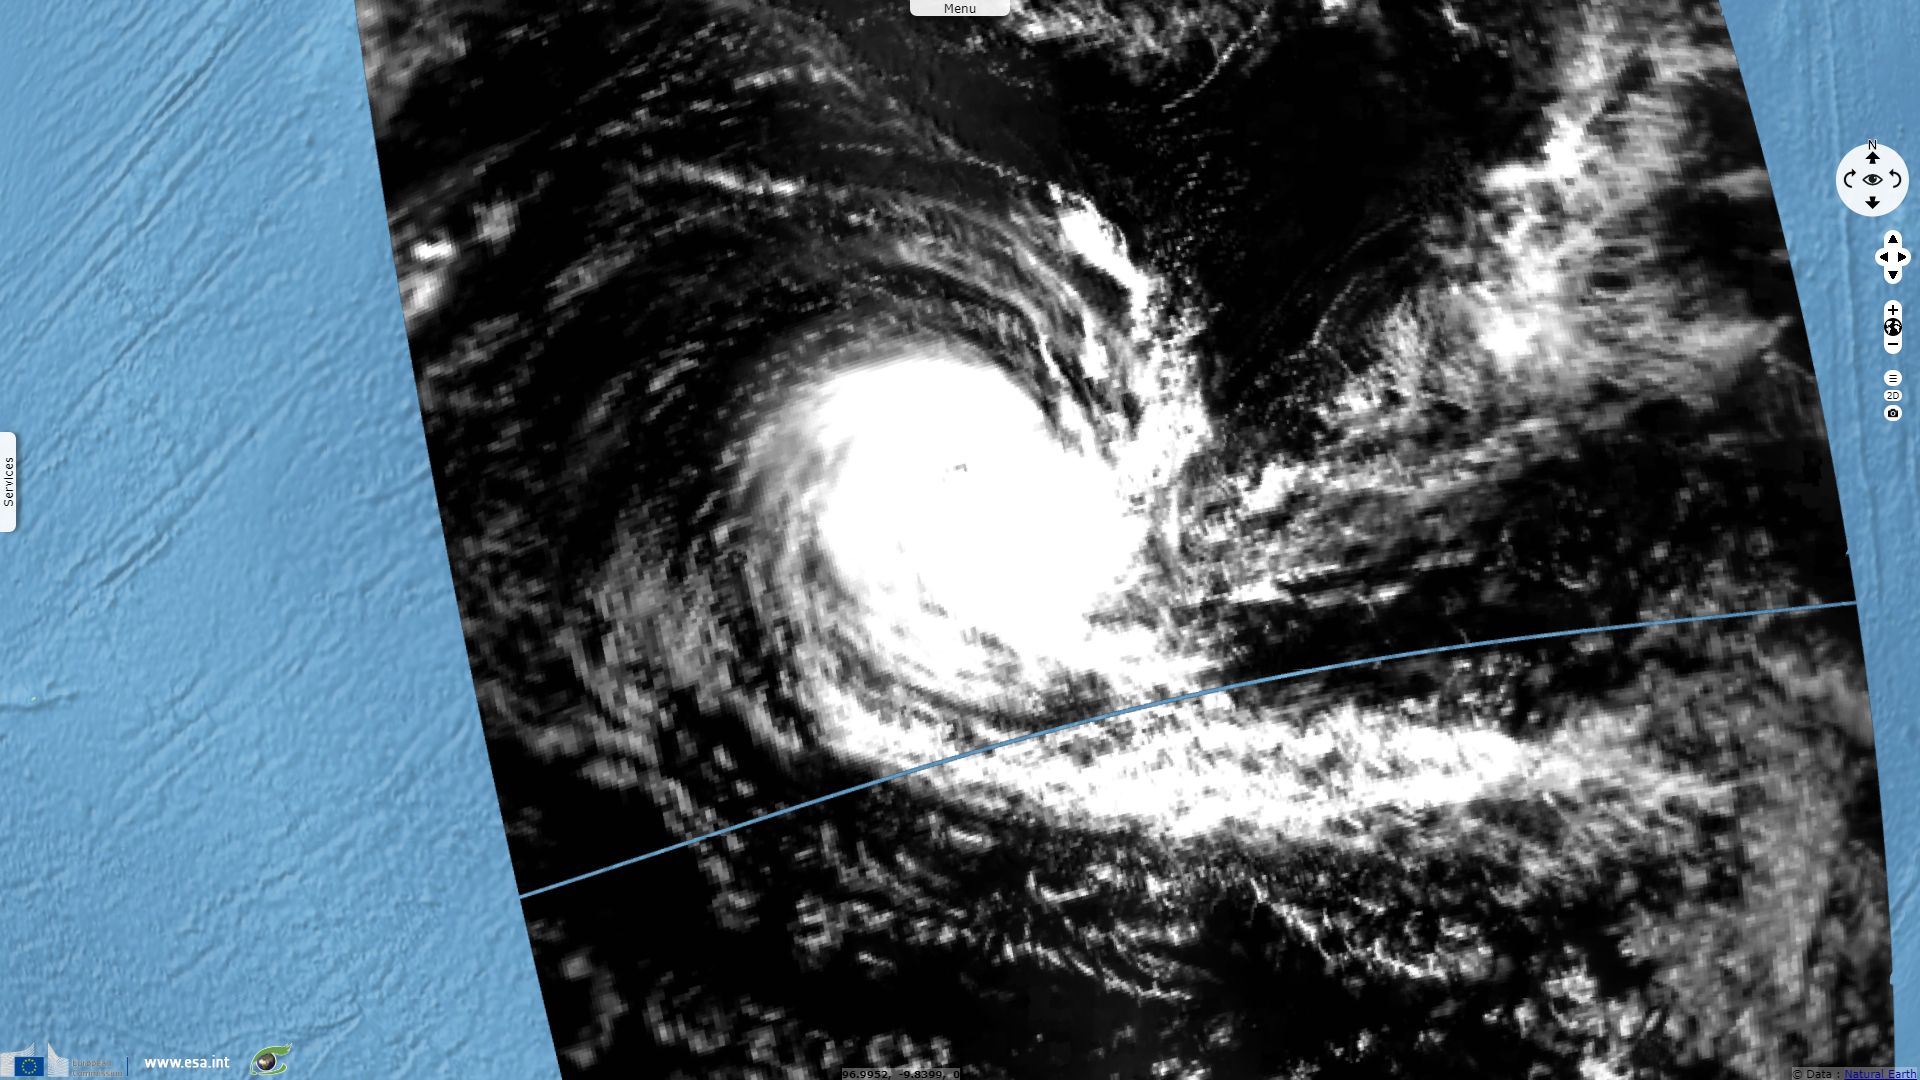
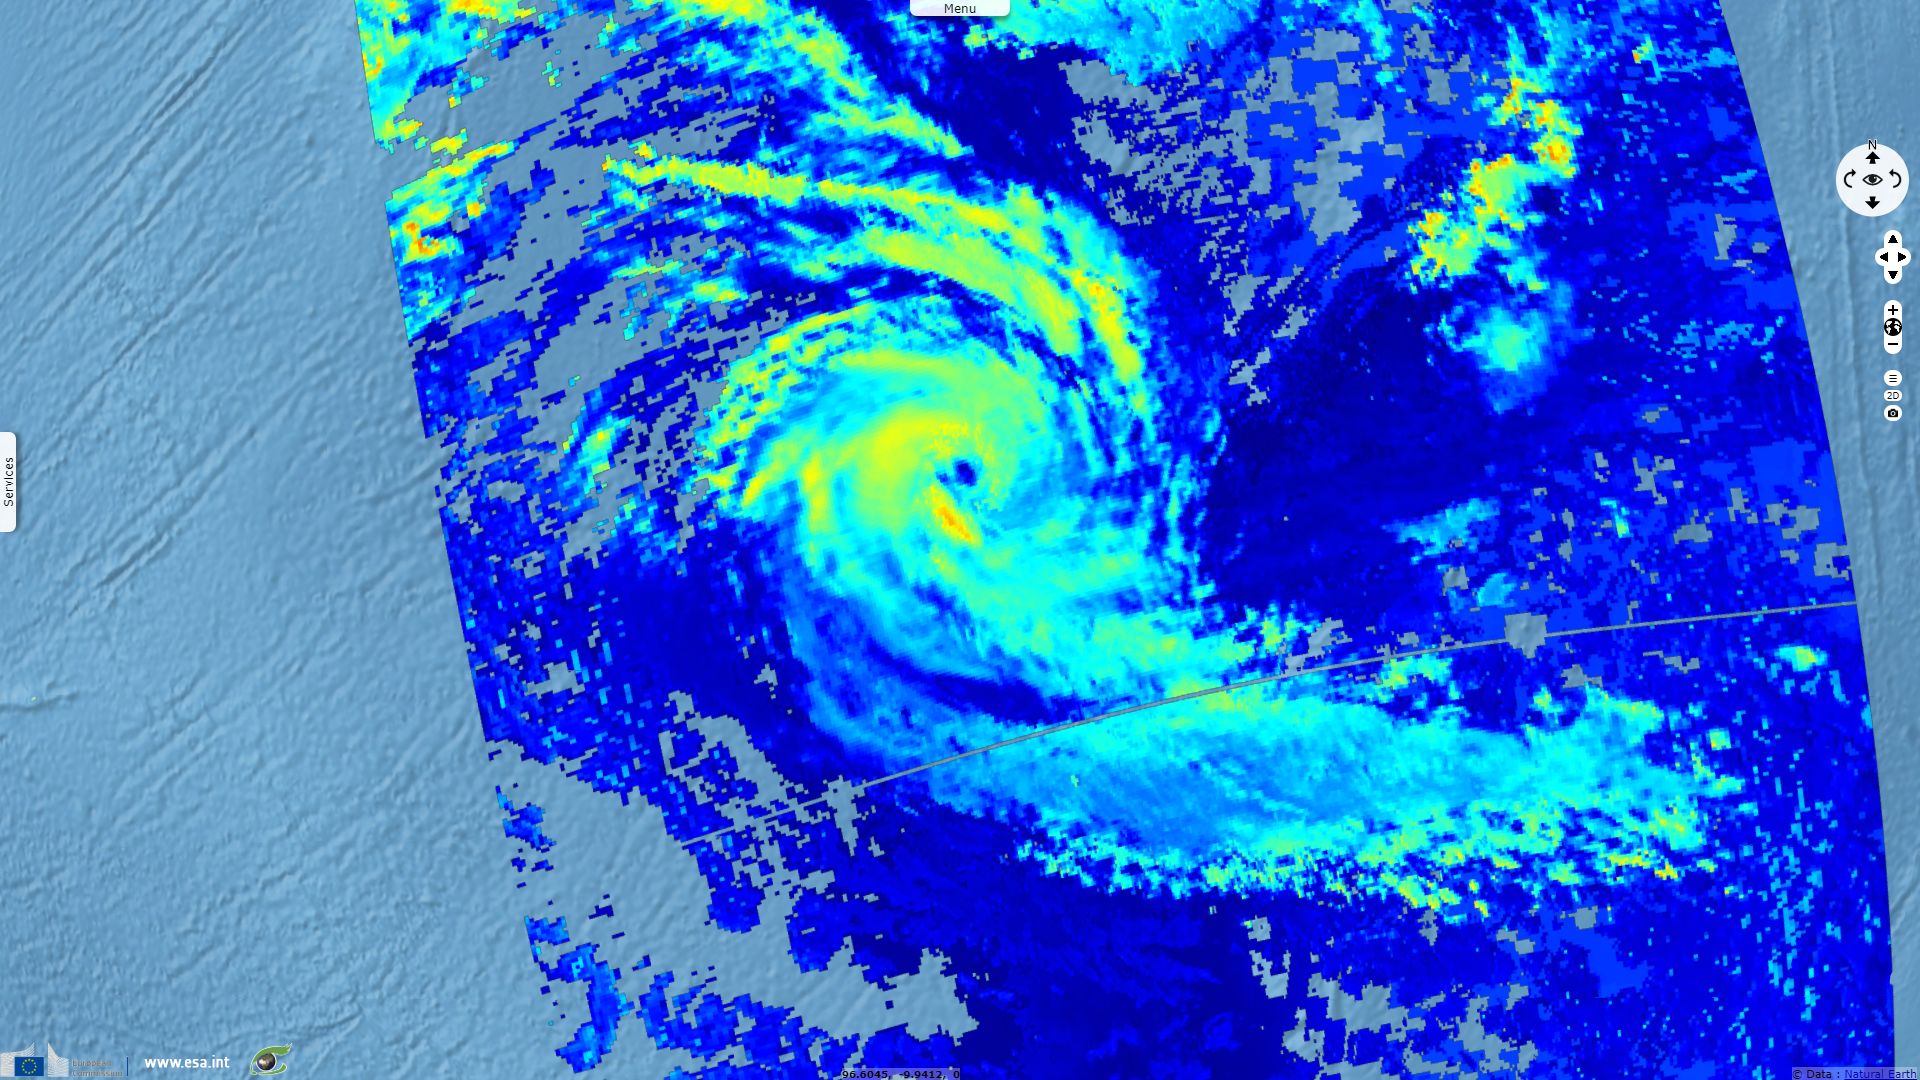
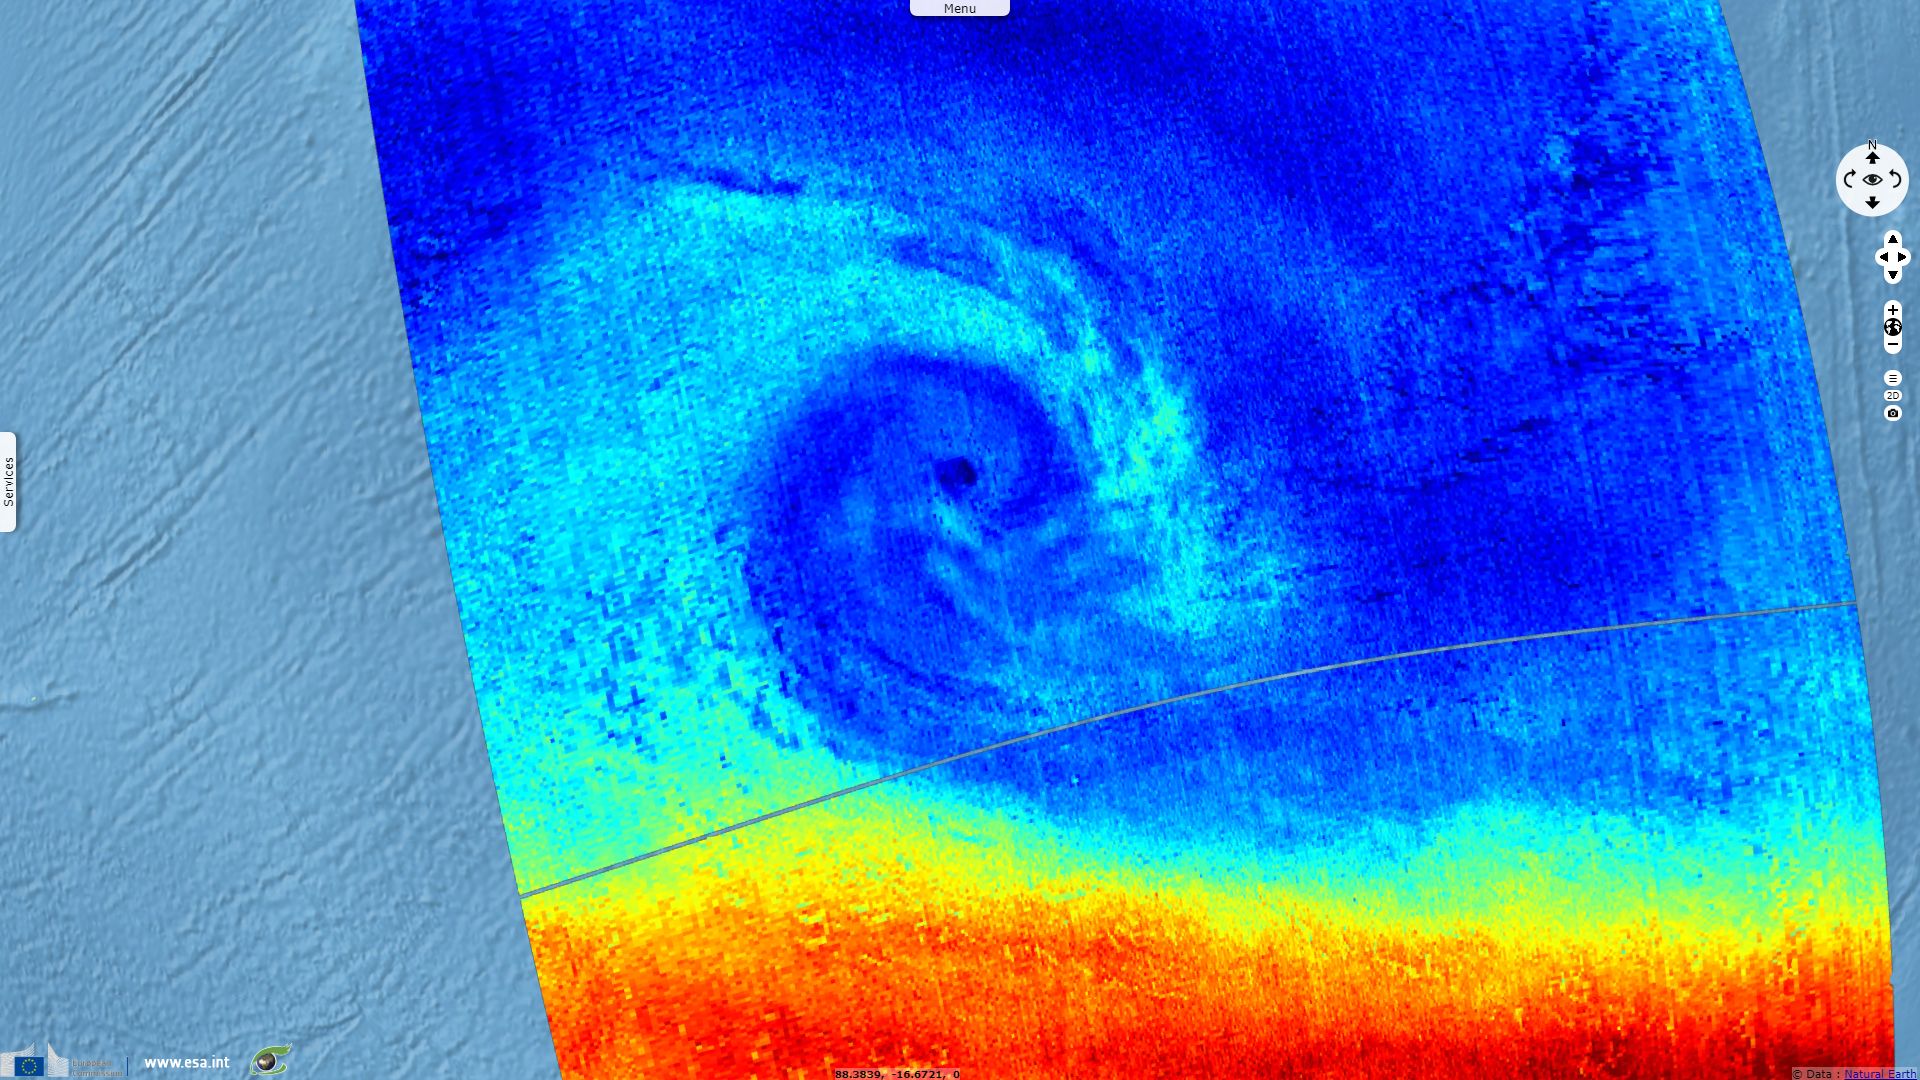
Sentinel-5P TROPOMI CLOUD acquired on 17 December 2018 from 07:13:25 to 08:58:25 UTC
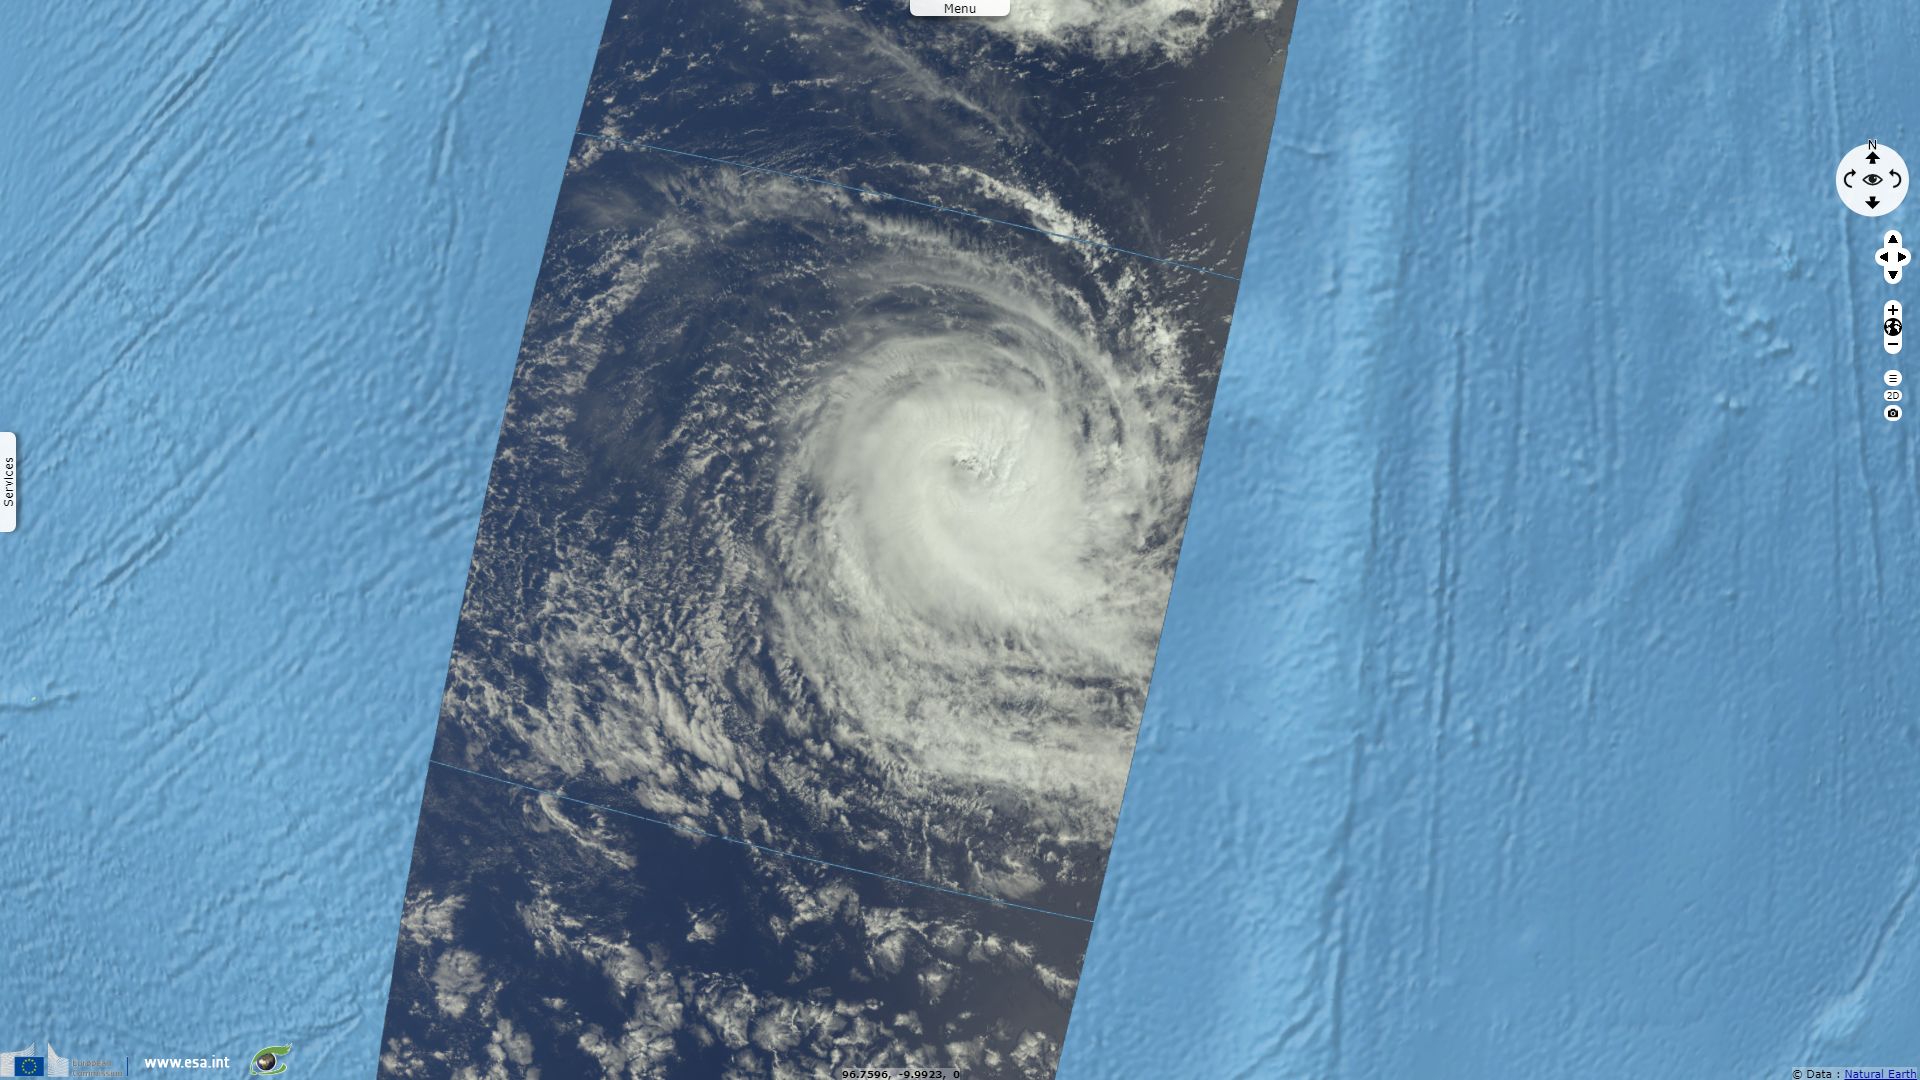
Sentinel-3 OLCI FR & SLSTR RBT acquired on 20 December 2018 from 04:15:33 to 04:21:33 UTC
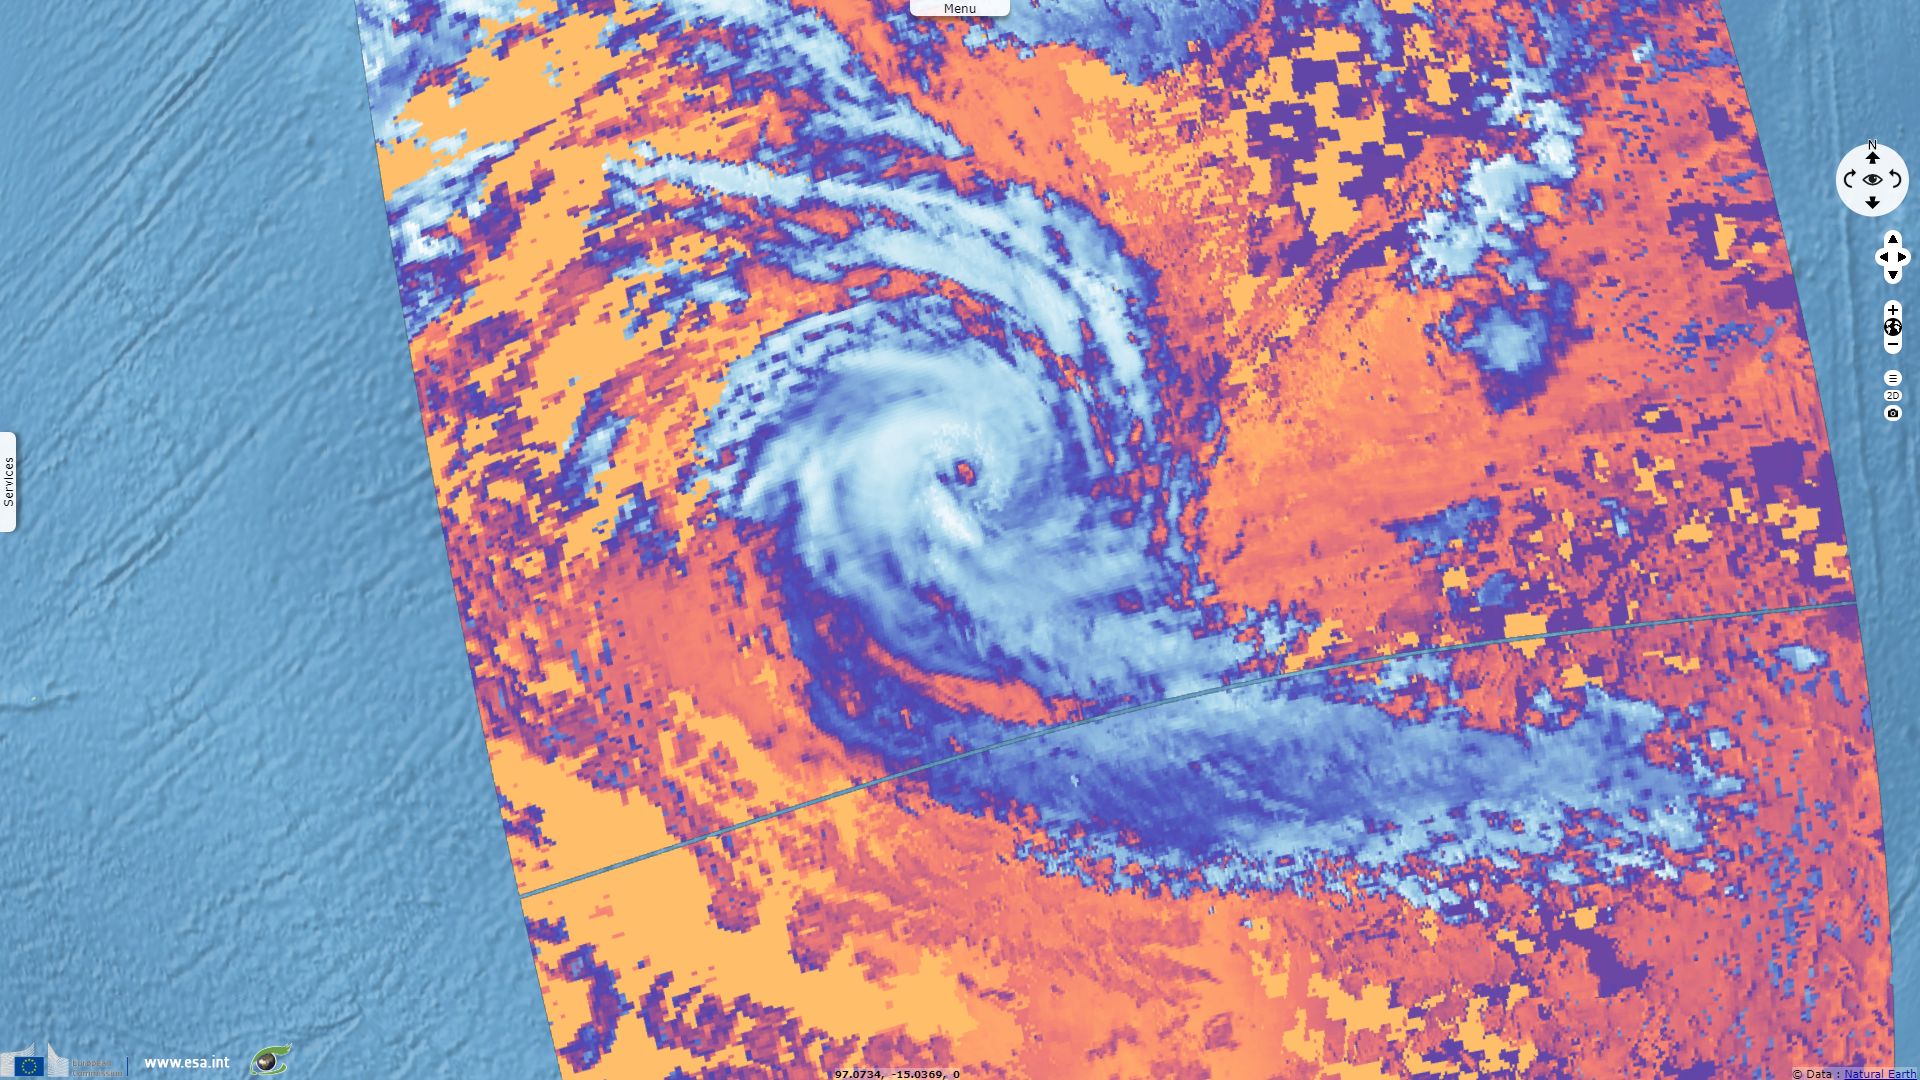
Sentinel-5P TROPOMI CLOUD, HCHO & O3 acquired on 20 December 2018 from 07:53:25 to 07:58:25 UTC
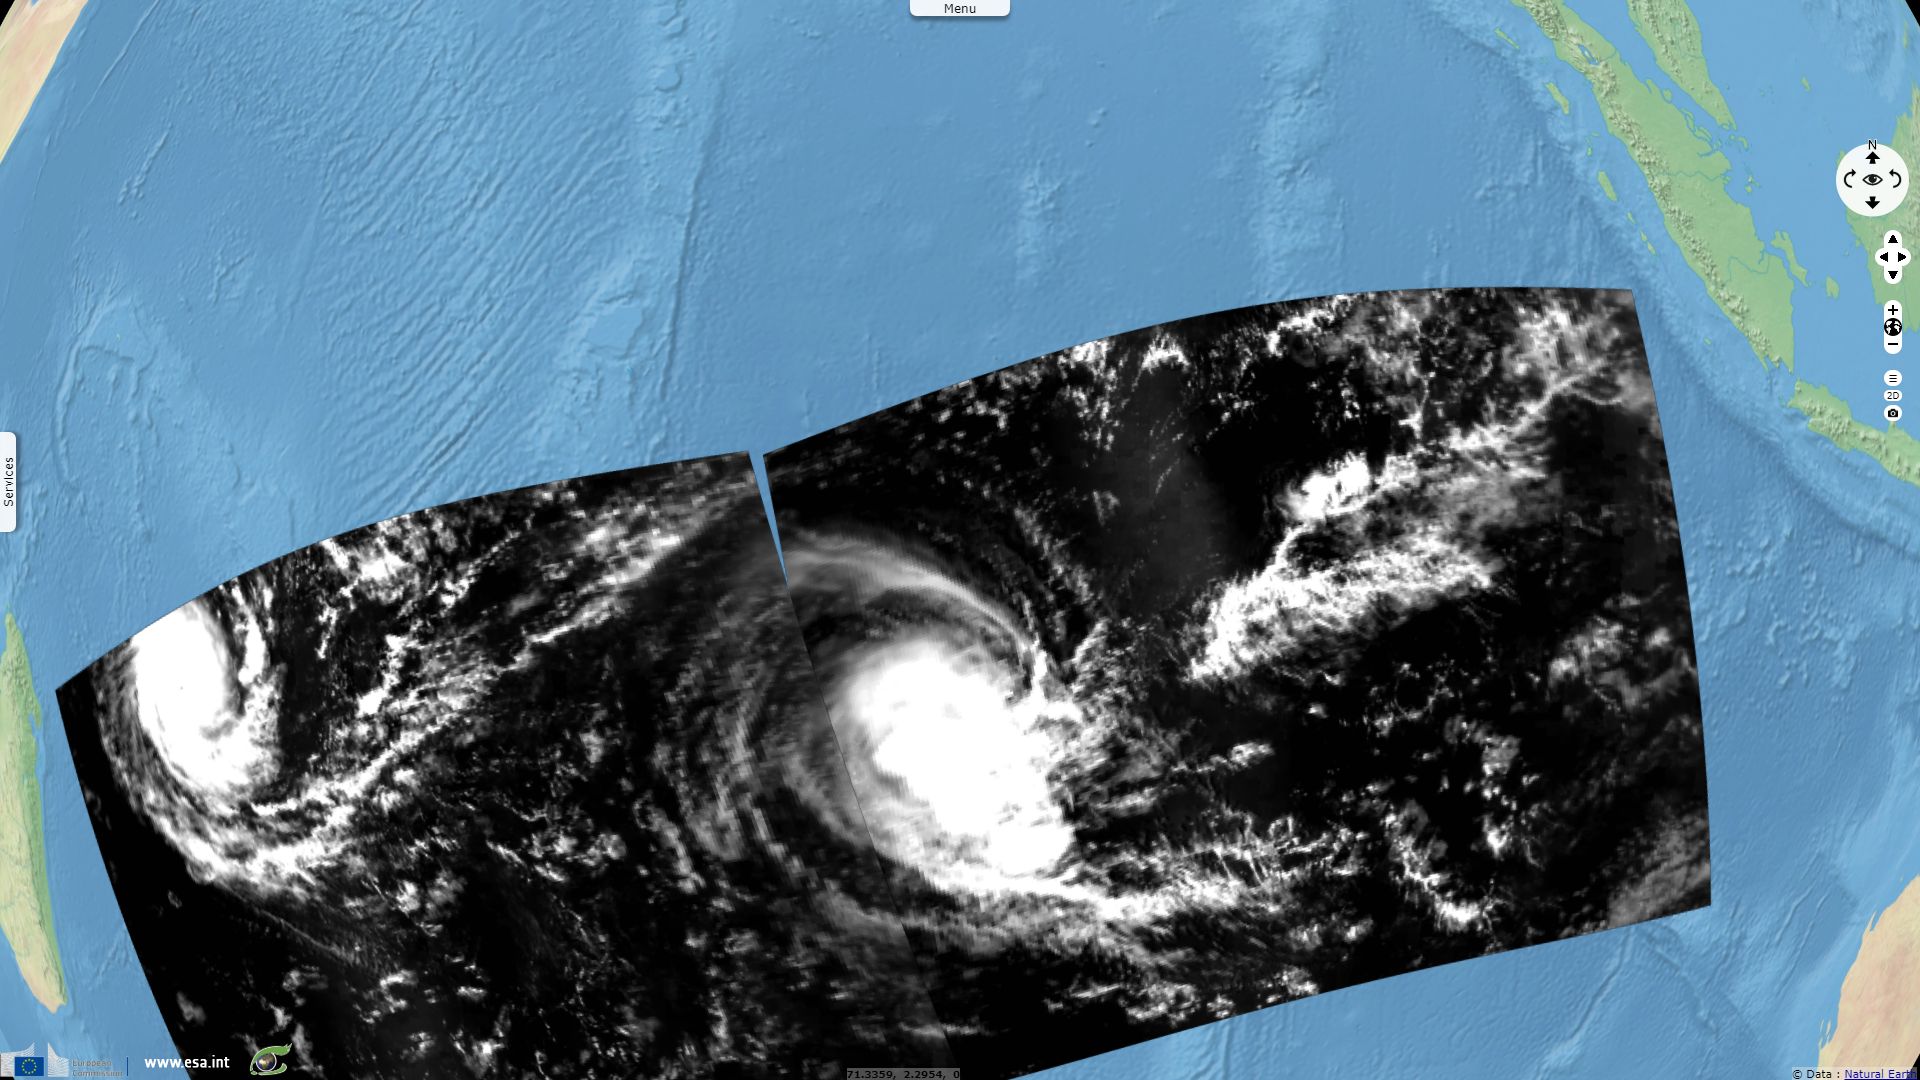
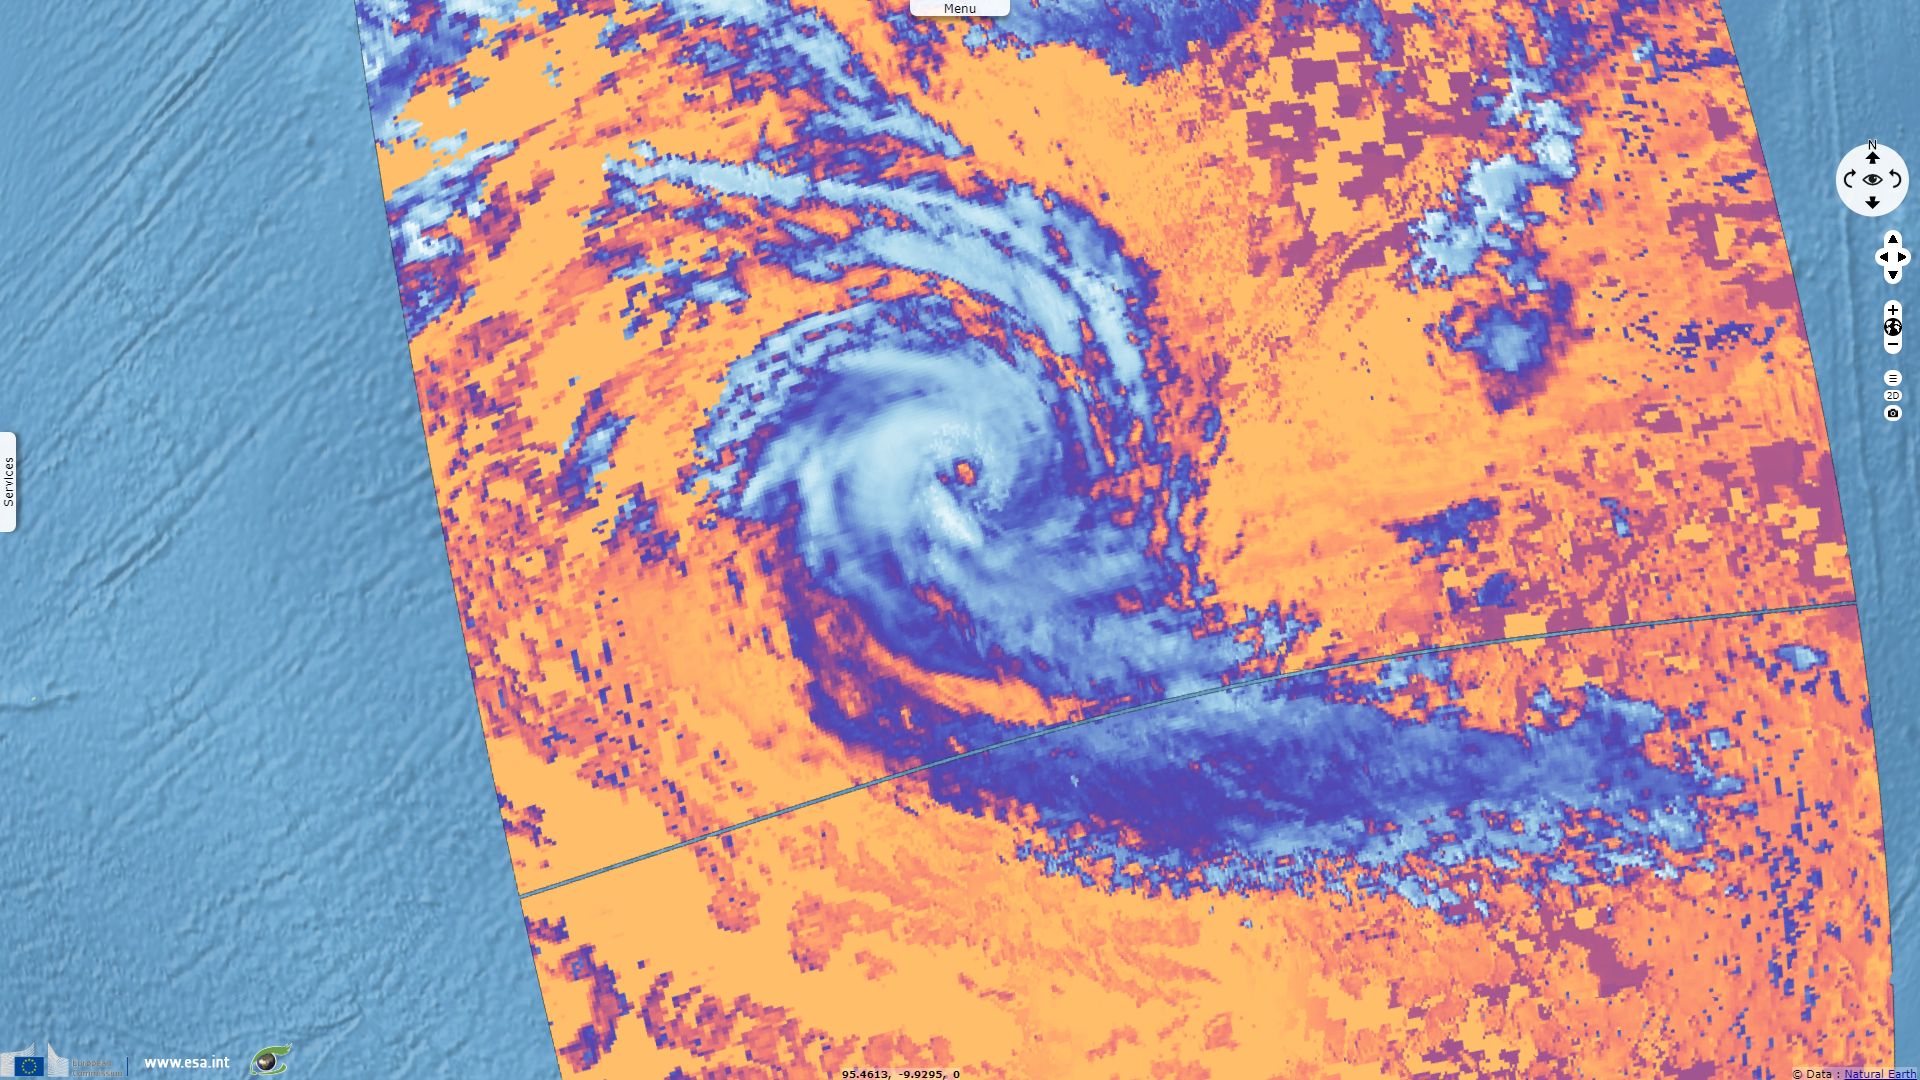
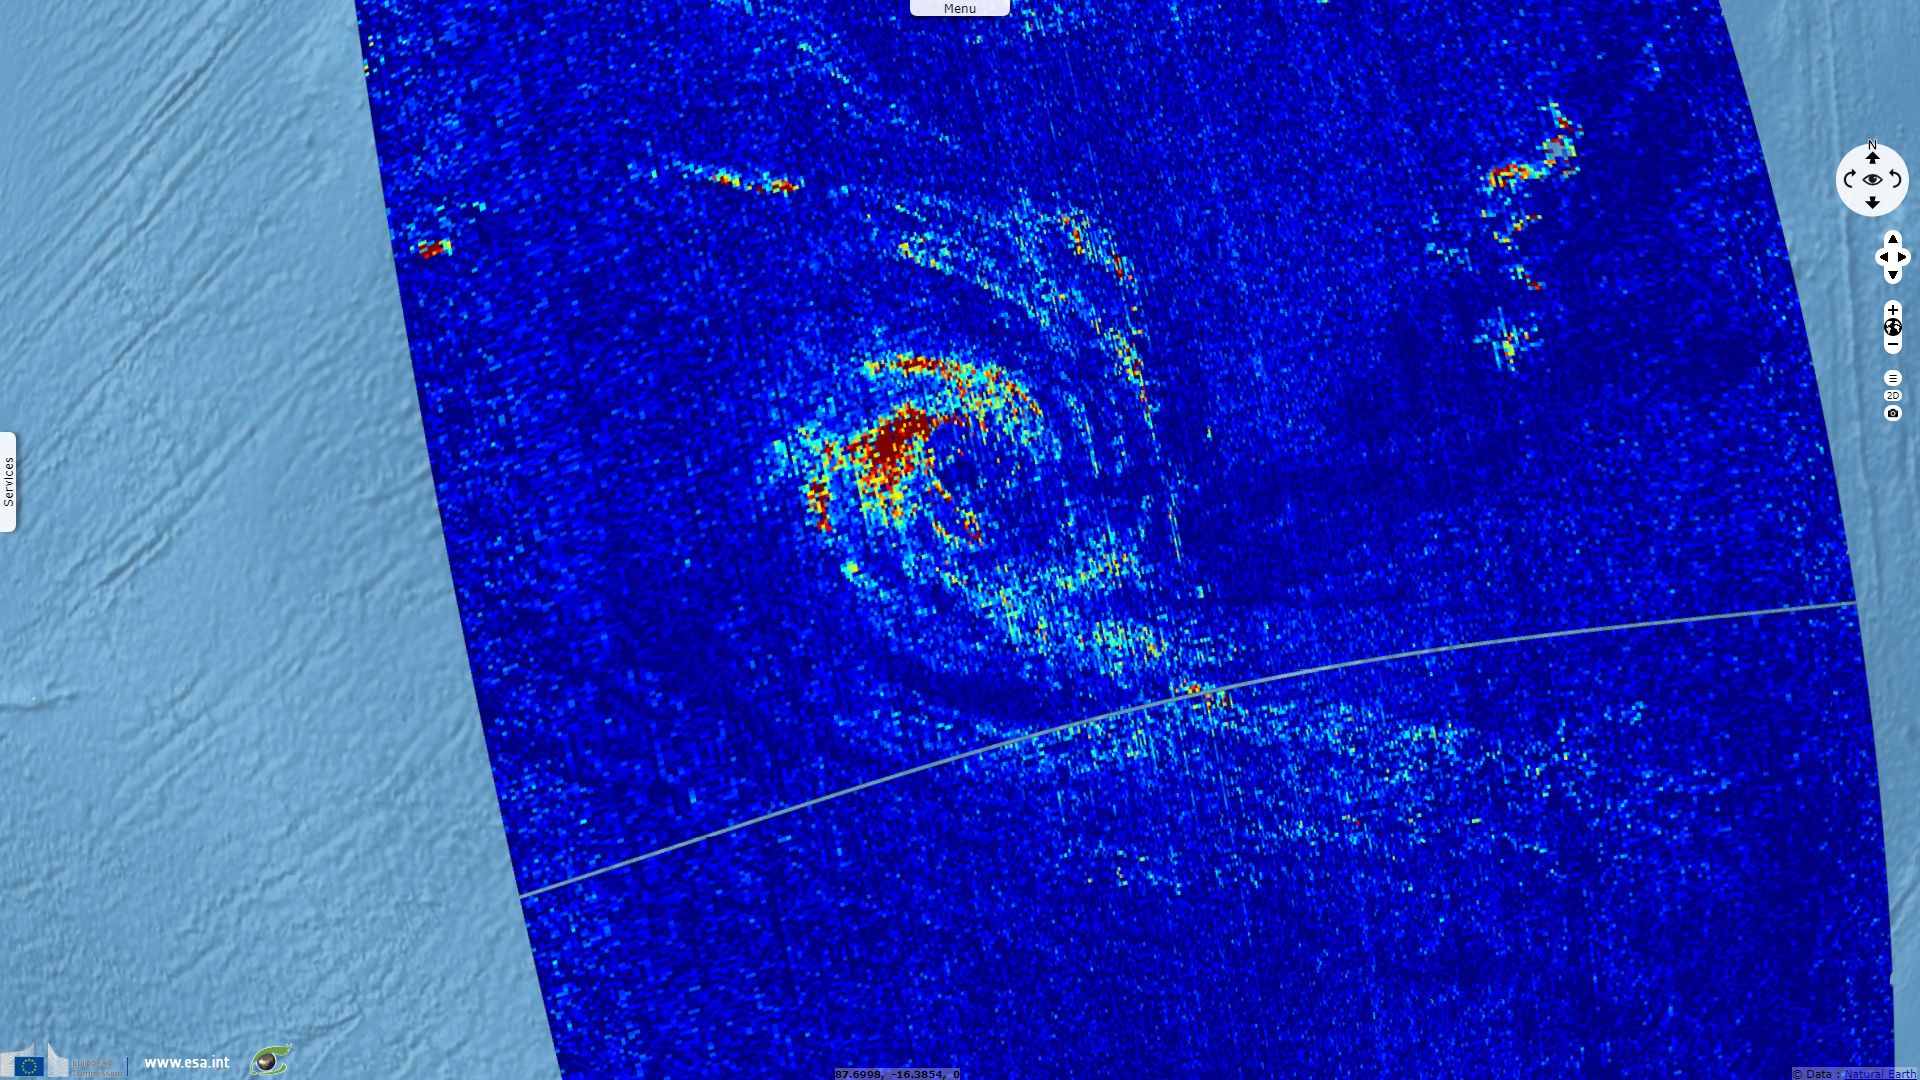
Sentinel-5P TROPOMI CLOUD acquired on 21 December 2018 from 07:38:25 to 09:18:24 UTC
Sentinel-5P TROPOMI CLOUD acquired on 17 December 2018 from 07:13:25 to 08:58:25 UTC
Sentinel-3 OLCI FR & SLSTR RBT acquired on 20 December 2018 from 04:15:33 to 04:21:33 UTC
Sentinel-5P TROPOMI CLOUD, HCHO & O3 acquired on 20 December 2018 from 07:53:25 to 07:58:25 UTC
Sentinel-5P TROPOMI CLOUD acquired on 21 December 2018 from 07:38:25 to 09:18:24 UTC
Keyword(s): Atmosphere, cloud, cyclone, hurricane, Indian Ocean
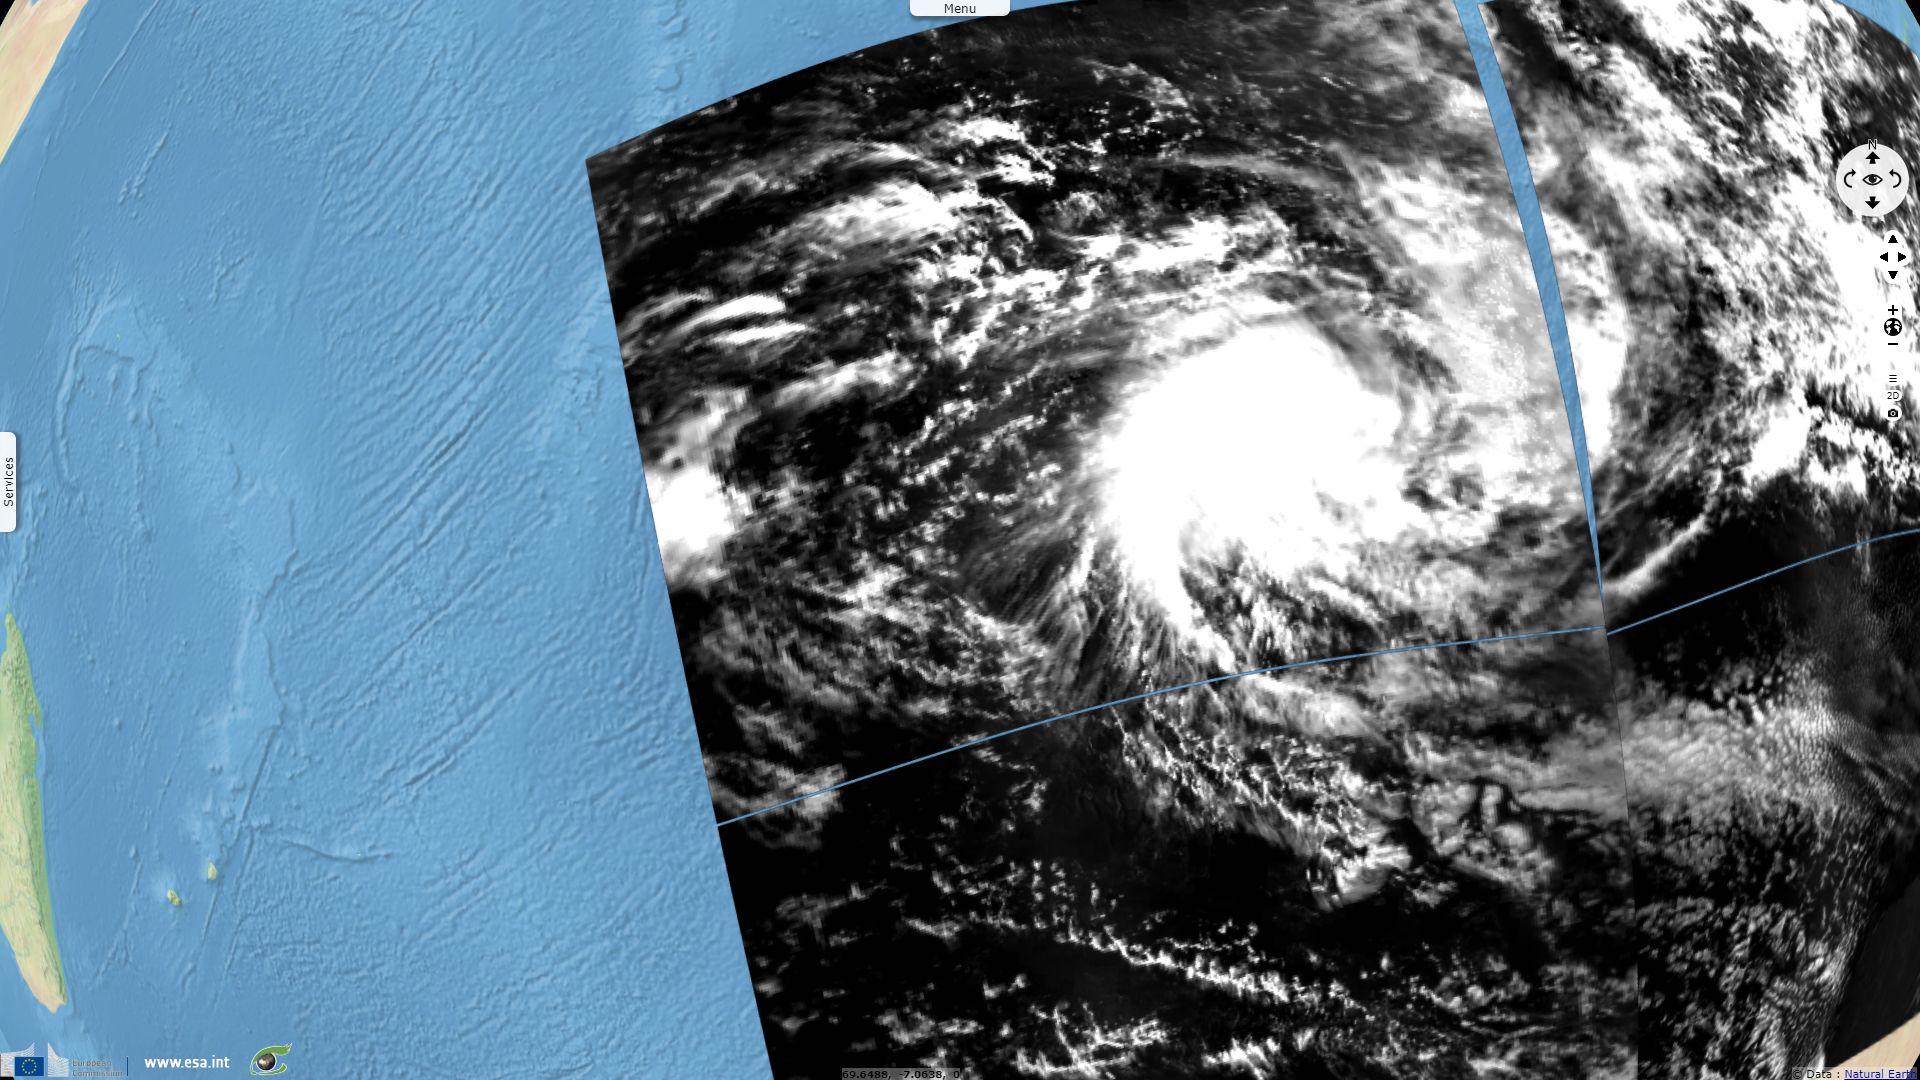
At the same time cyclone Cilida was approaching Mascareignes, another cyclone named Kenanga was roaming the eastern part of the Indian Ocean. The Copernicus constellation can count on the large swath of both Sentinel-3 platforms but also on Sentinel-5P near-daily global cover to follow such phenomena.
On 19.12.2018, Hal Pierce and Lynn Jenner published in the hurricane section of the NASA blog: "NASA found very cold cloud top temperatures within the Southern Indian Ocean’s Tropical Cyclone Kenanga that indicate powerful thunderstorms reaching high into the troposphere. Those storms were generating very heavy rainfall as confirmed by the Global Precipitation Measurement mission or GPM core satellite."
Two days later, they added: "On December 20, 2018, NASA’s Global Precipitation Measurement mission or GPM core observatory satellite passed over the Tropical Cyclone Kenanga and captured the storm beginning to weaken as predicted. The GPM satellite had an excellent view of the Kenanga when the tropical cyclone’s maximum sustained winds were at [167 kph]. GPM’s pass showed the eye of the storm, visible the day before, had since filled in.
GPM’s instruments including the Microwave Imager (GMI) and the Dual-Frequency Precipitation Radar (DPR) revealed that the powerful storms south of Kenanga’s center are still producing very heavy rainfall at the rate of 214 mm per hour in that area. The rainfall in the northern half of the storm had decreased significantly."
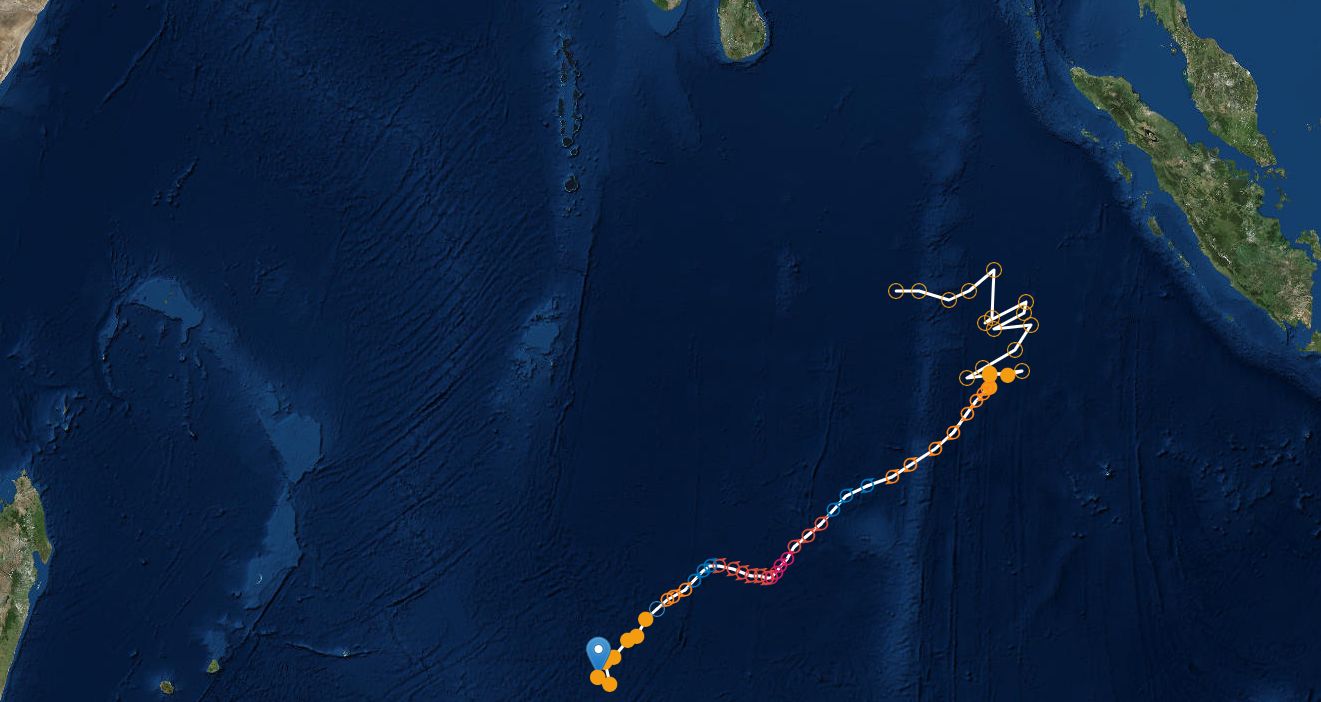
Track of cyclonic system Kenanga - Source: meteo-reunion.fr/
This "view of Kenanga showed extremely powerful storms south of Kenanga’s deteriorating eye were returning very strong reflectivity values which help to map the severity of the storm and the rainfall totals. The storm tops of the eyewall which had remained intact on the western side of the cyclone were reaching heights of 12.7 km.
The Joint Typhoon Warning Center predicts that Kenanga will continue to weaken rapidly as the dry air within the storm gets colder and heavier causing downdrafts. It is the dry air higher aloft that contributes to stronger convective wind gusts and therefore stronger storms. Kenanga is forecast to dissipate in the next 72 hours as it tracks within the northeast periphery of Tropical Cyclone Cilida."
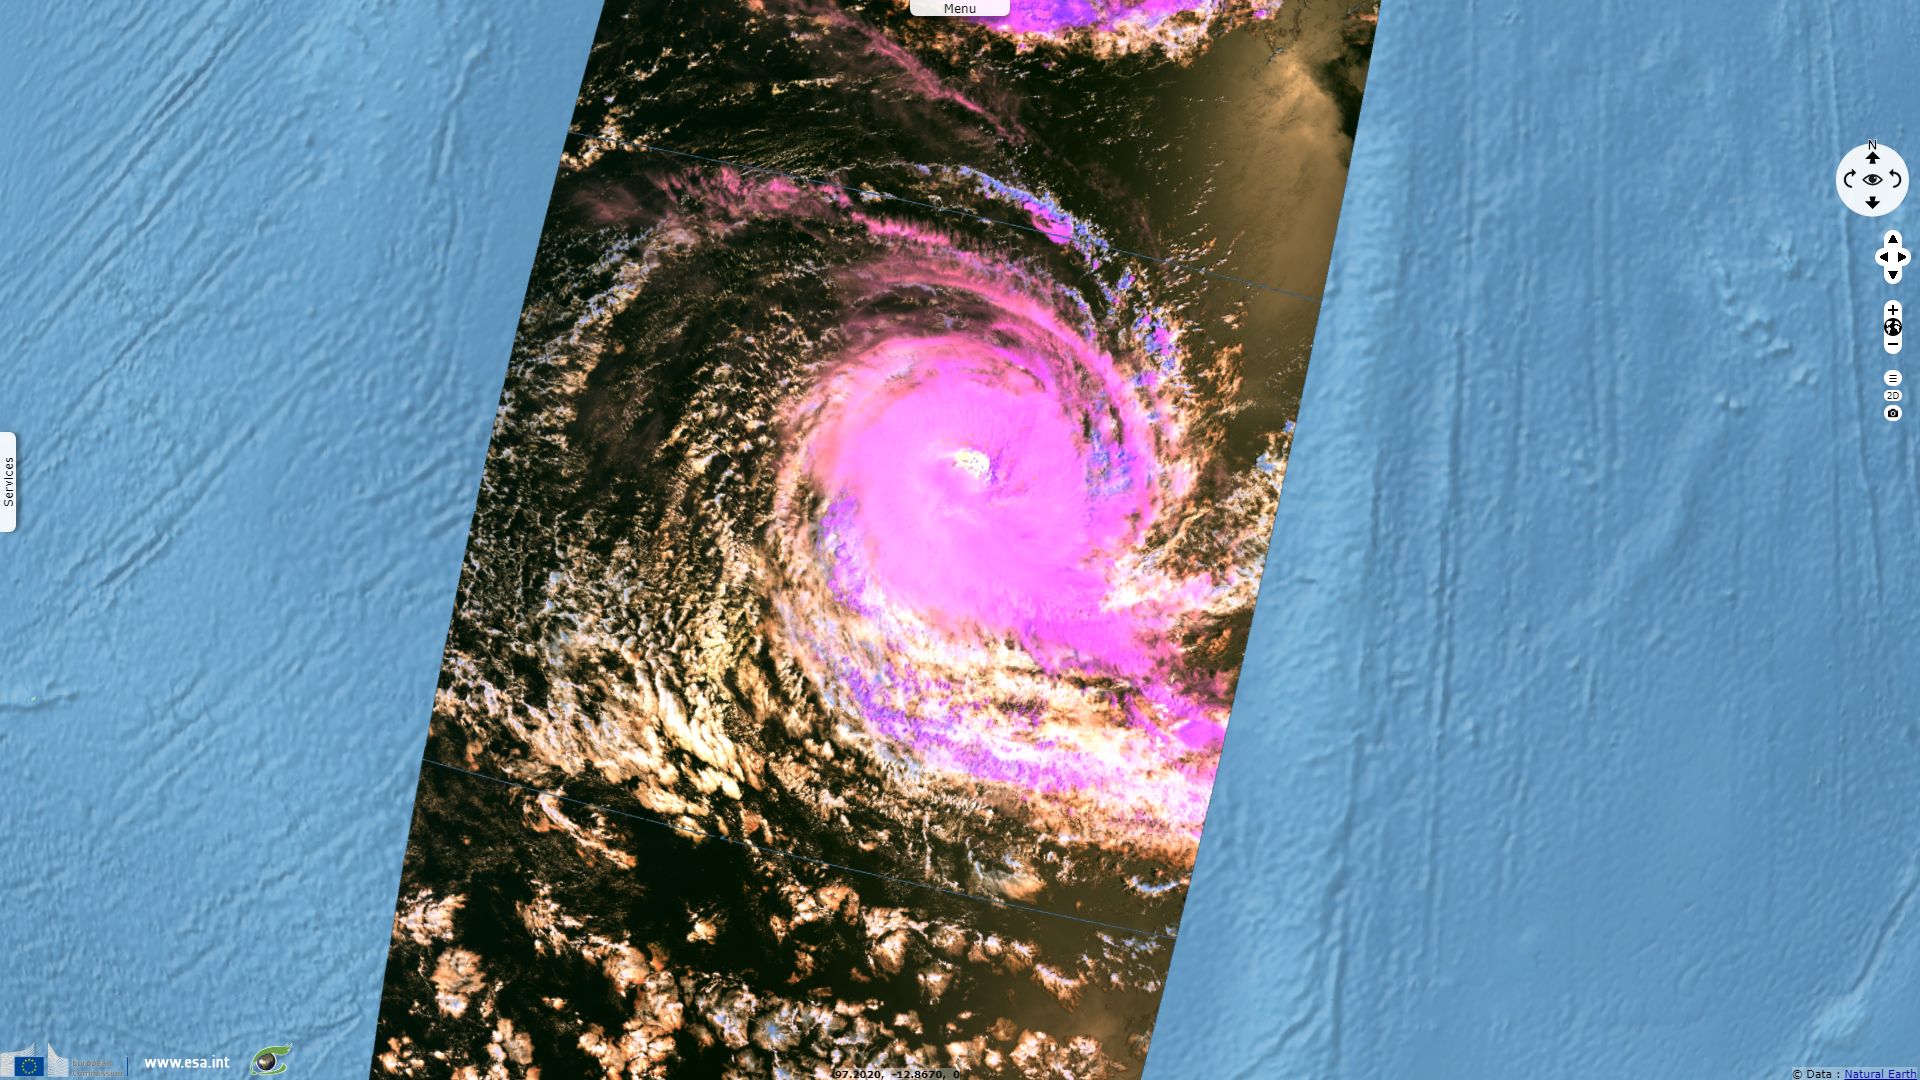
While all cloud layers reflect the 659nm band (blue channel), they reflect differently in the 2 SWIR bands in 1610nm (green) & 2250nm (red) bands.

Barometric formula - Source: Klaus-Dieter Keller

Air pressure p as a function of the altitude h - Source: Klaus-Dieter Keller
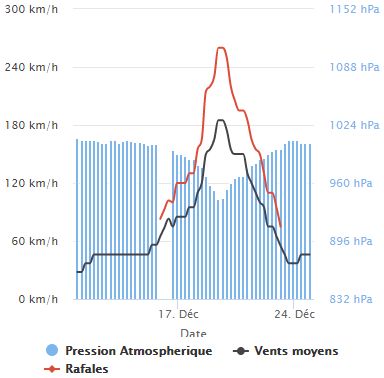
Evolution of cyclonic system Kenanga (sustained wind speed in black, gusts wind speed in red, central pressure in blue - Source: meteo-reunion.fr/
The views expressed herein can in no way be taken to reflect the official opinion of the European Space Agency or the European Union.
Contains modified Copernicus Sentinel data 2026, processed by VisioTerra.
Contains modified Copernicus Sentinel data 2026, processed by VisioTerra.
| More on European Commission space: |  |
 |
 |
||||
| More on ESA: | |
|
|
S-1 website | S-2 website | S-3 website | |
| More on Copernicus program: | |
|
|
Scihub portal | Cophub portal | Inthub portal | Colhub portal |
| More on VisioTerra: | |
|
|
Sentinel Vision Portal | Envisat+ERS portal | Swarm+GOCE portal | CryoSat portal |