Multitemporal Sentinel-1 images show the aftermath of the Kilauea's Lower Puna eruption in Hawaii
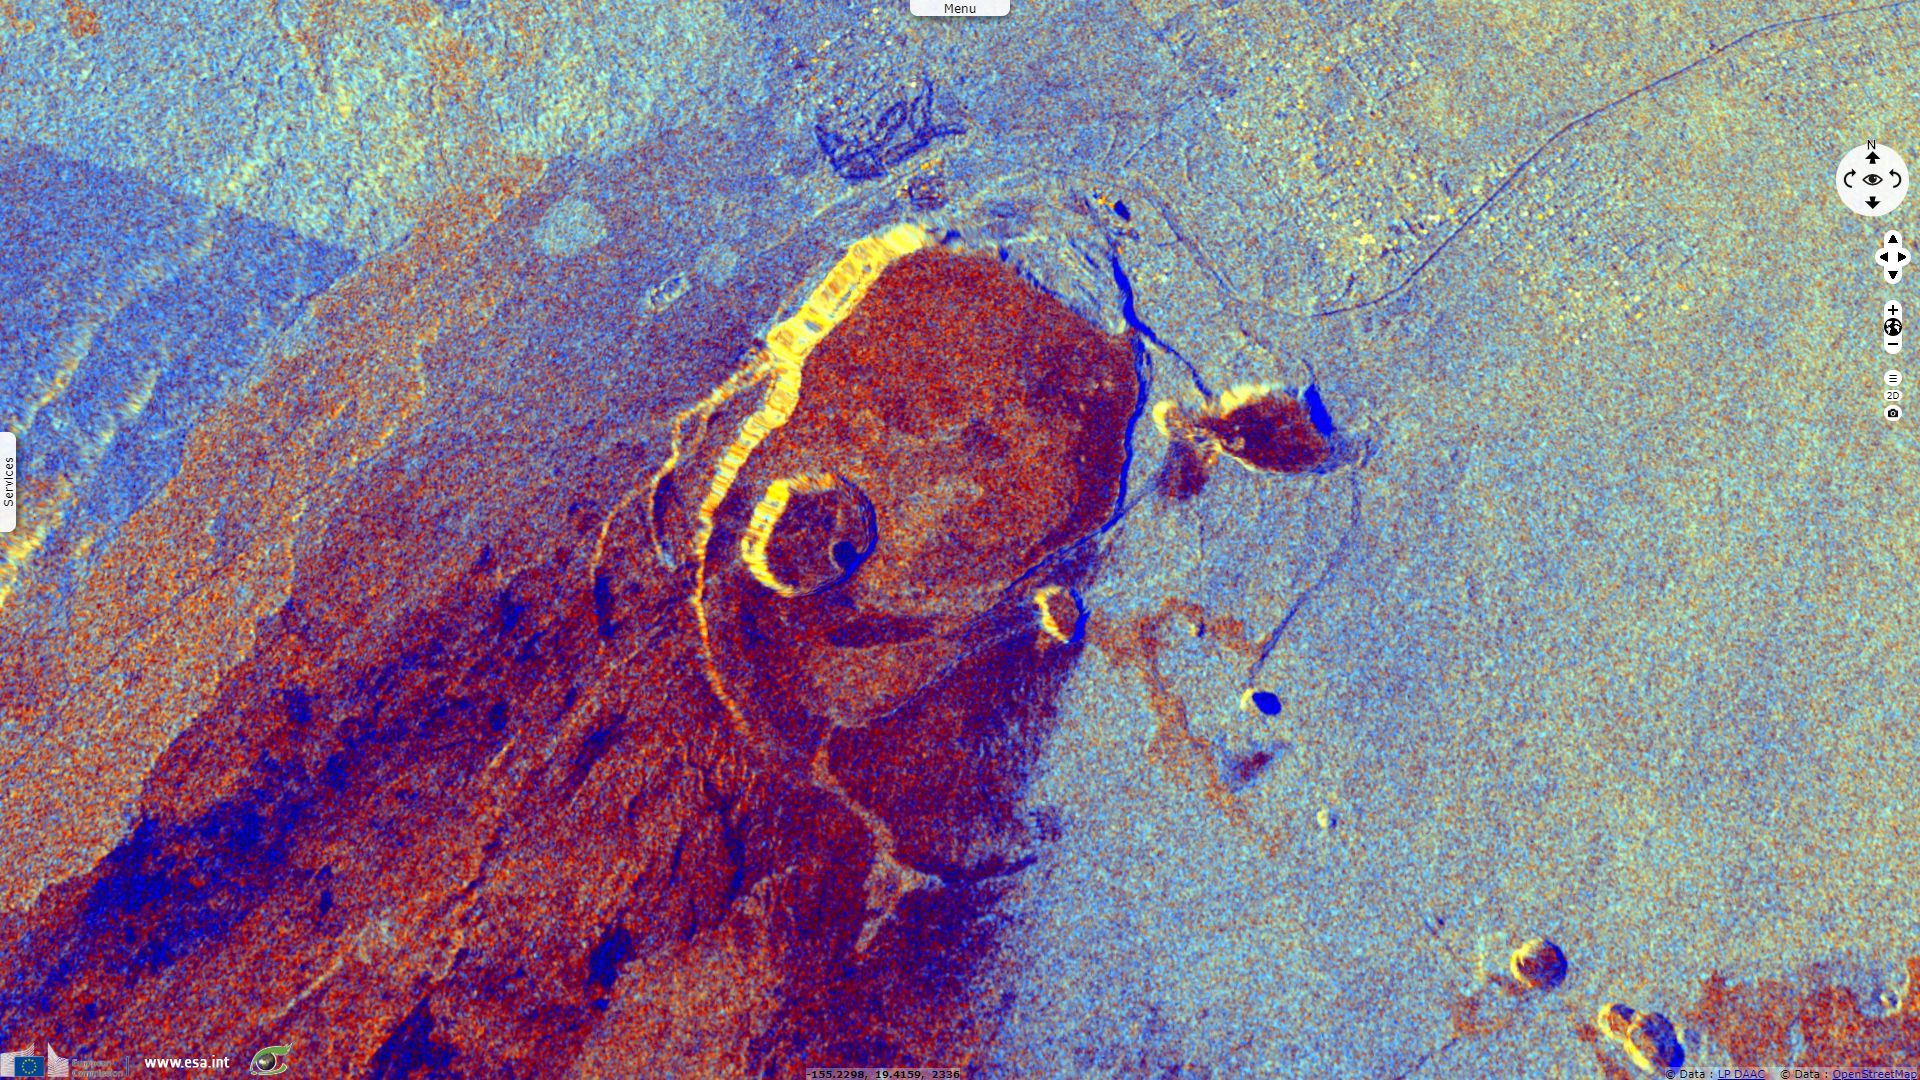
Sentinel-1 CSAR IW acquired on 16 November 2014 at 16:15:40 UTC
...
Sentinel-1 CSAR IW acquired on 23 April 2018 at 16:15:25 UTC
Sentinel-1 MSI L2A acquired on 28 January 2019 at 20:59:39 UTC
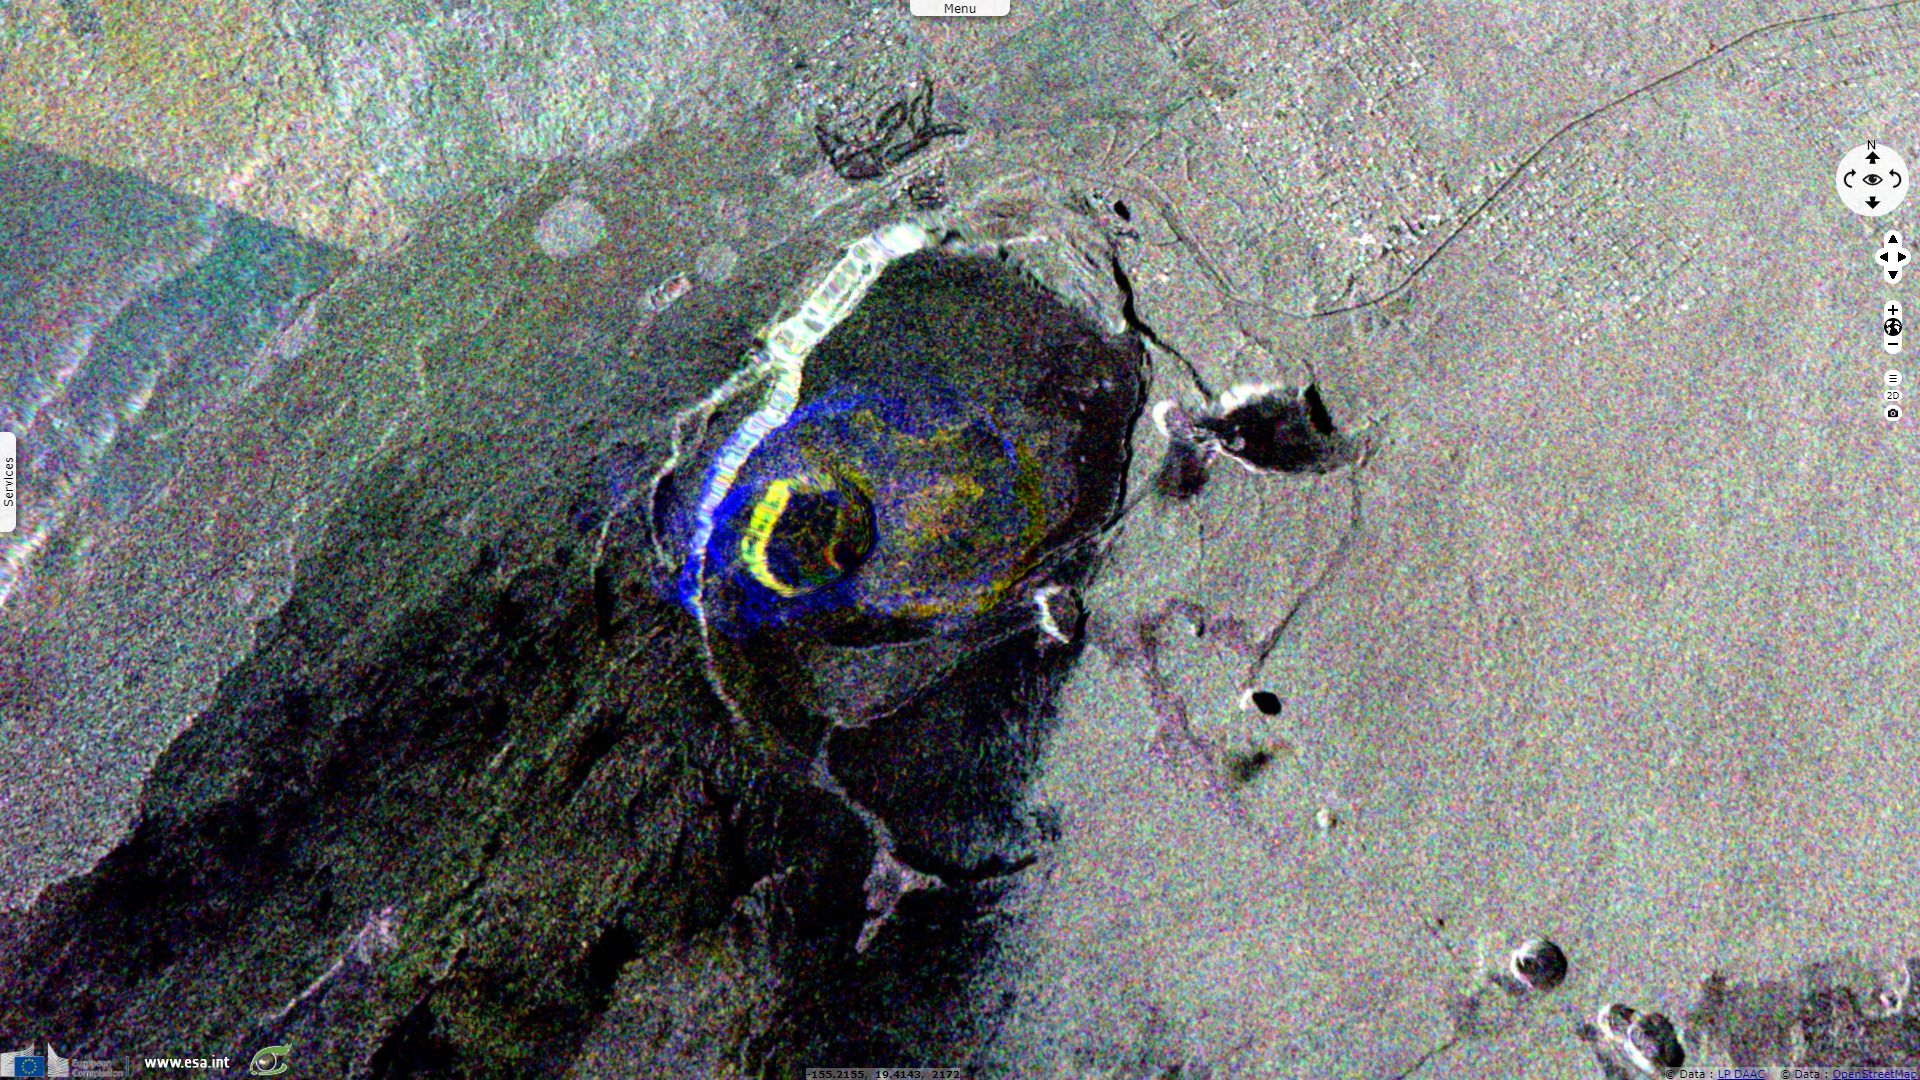
Sentinel-1 CSAR IW acquired on 18 May 2019 at 16:16:11 UTC
...
Sentinel-1 CSAR IW acquired on 23 April 2018 at 16:15:25 UTC
Sentinel-1 MSI L2A acquired on 28 January 2019 at 20:59:39 UTC
Sentinel-1 CSAR IW acquired on 18 May 2019 at 16:16:11 UTC
Keyword(s): Natural disaster monitoring, geohazard, geology, coastal, hot spot, lava field, lava flow, volcano, USA, United States
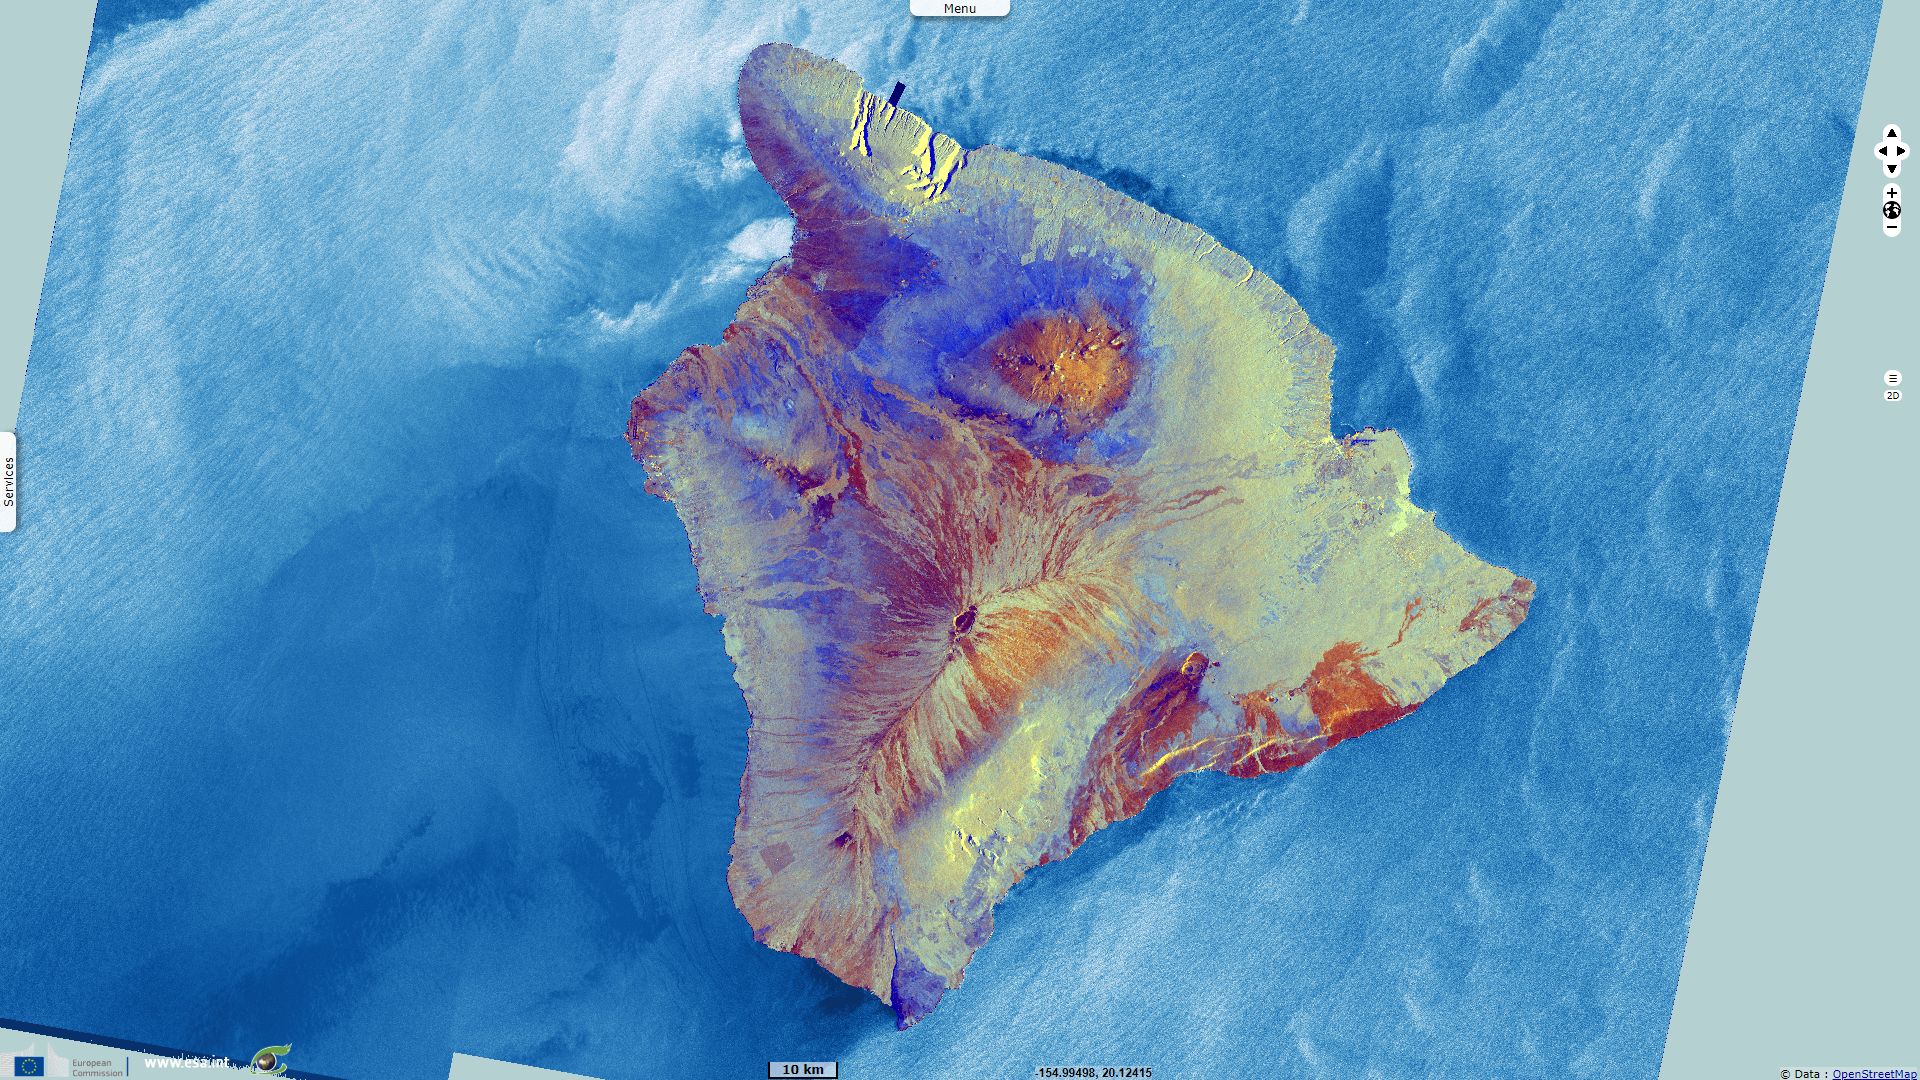
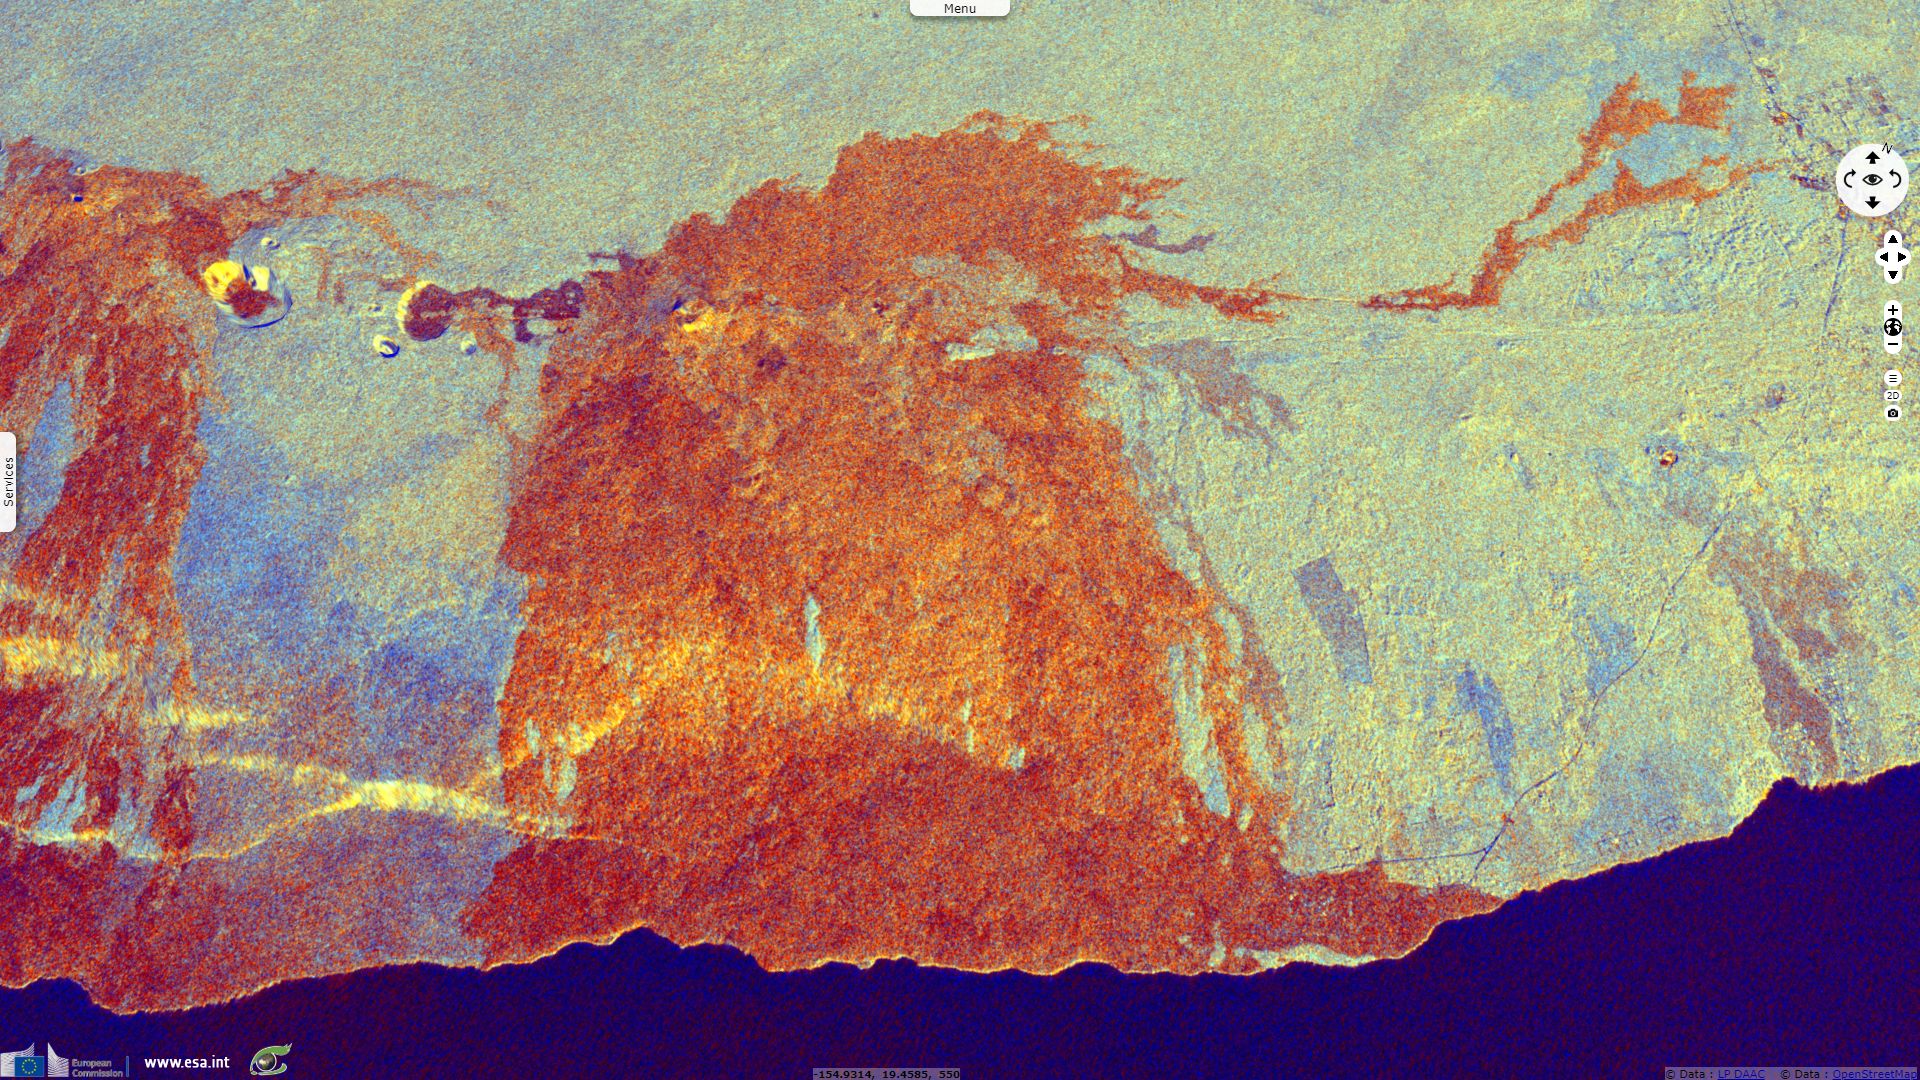
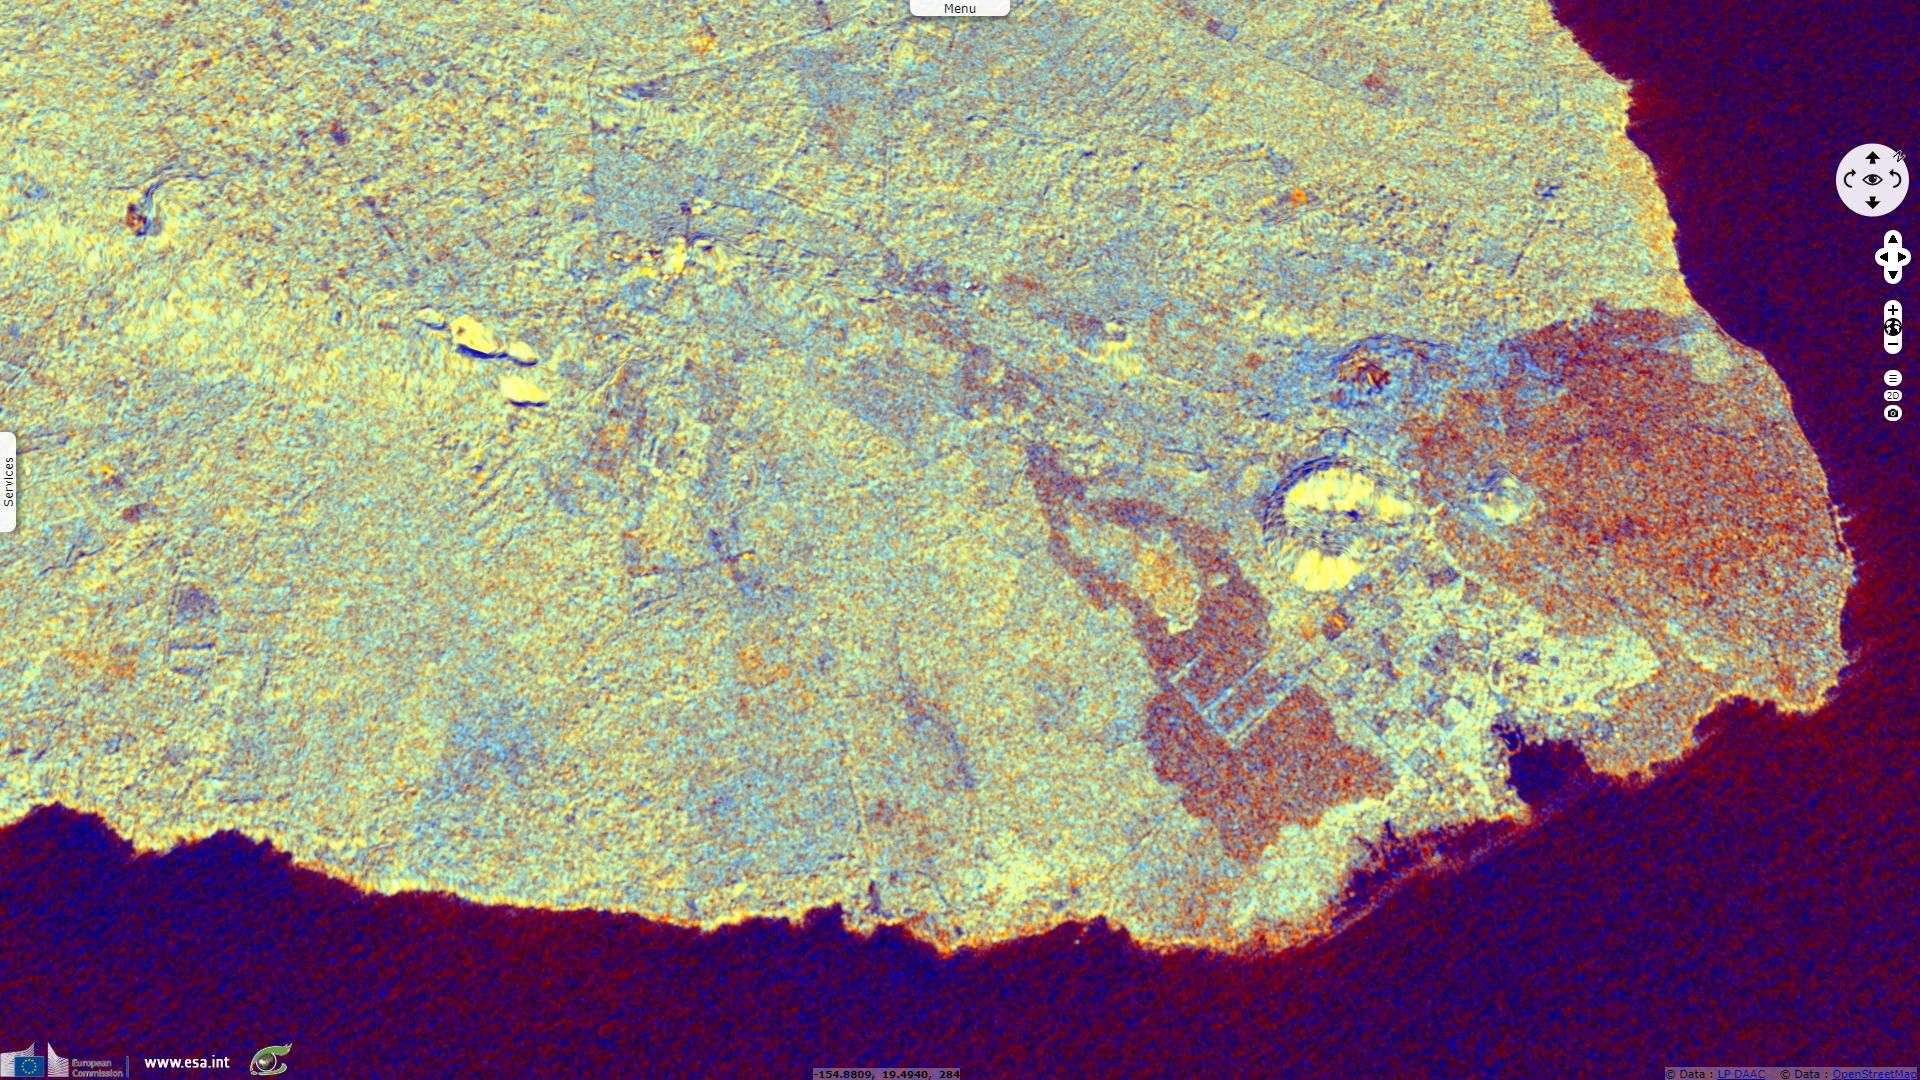
This view of Hawaii island uses a land sea mask to apply a different process on each part. On land, this mean of 3 successive homologous acquisitions reduces speckle at the cost of slight temporal decoherence. On sea, the column stretching process produces the same contrast in the short range and far range part of the image.
In the Bulletin of the Global Volcanism Network, vol. 44, no. 1 released in January 2019, managing editor Edward Venzke and report research and preparation assistant Liz Crafford wrote: "A marked increase in seismicity and ground deformation at Pu'u 'O'o Cone on the upper East Rift Zone on 30 April 2018, and the subsequent collapse of its crater floor, marked the beginning of the largest lower East Rift Zone eruptive episode in at least 200 years; the ending of this episode in early September 2018 marked the end of 36 years of continuous activity."
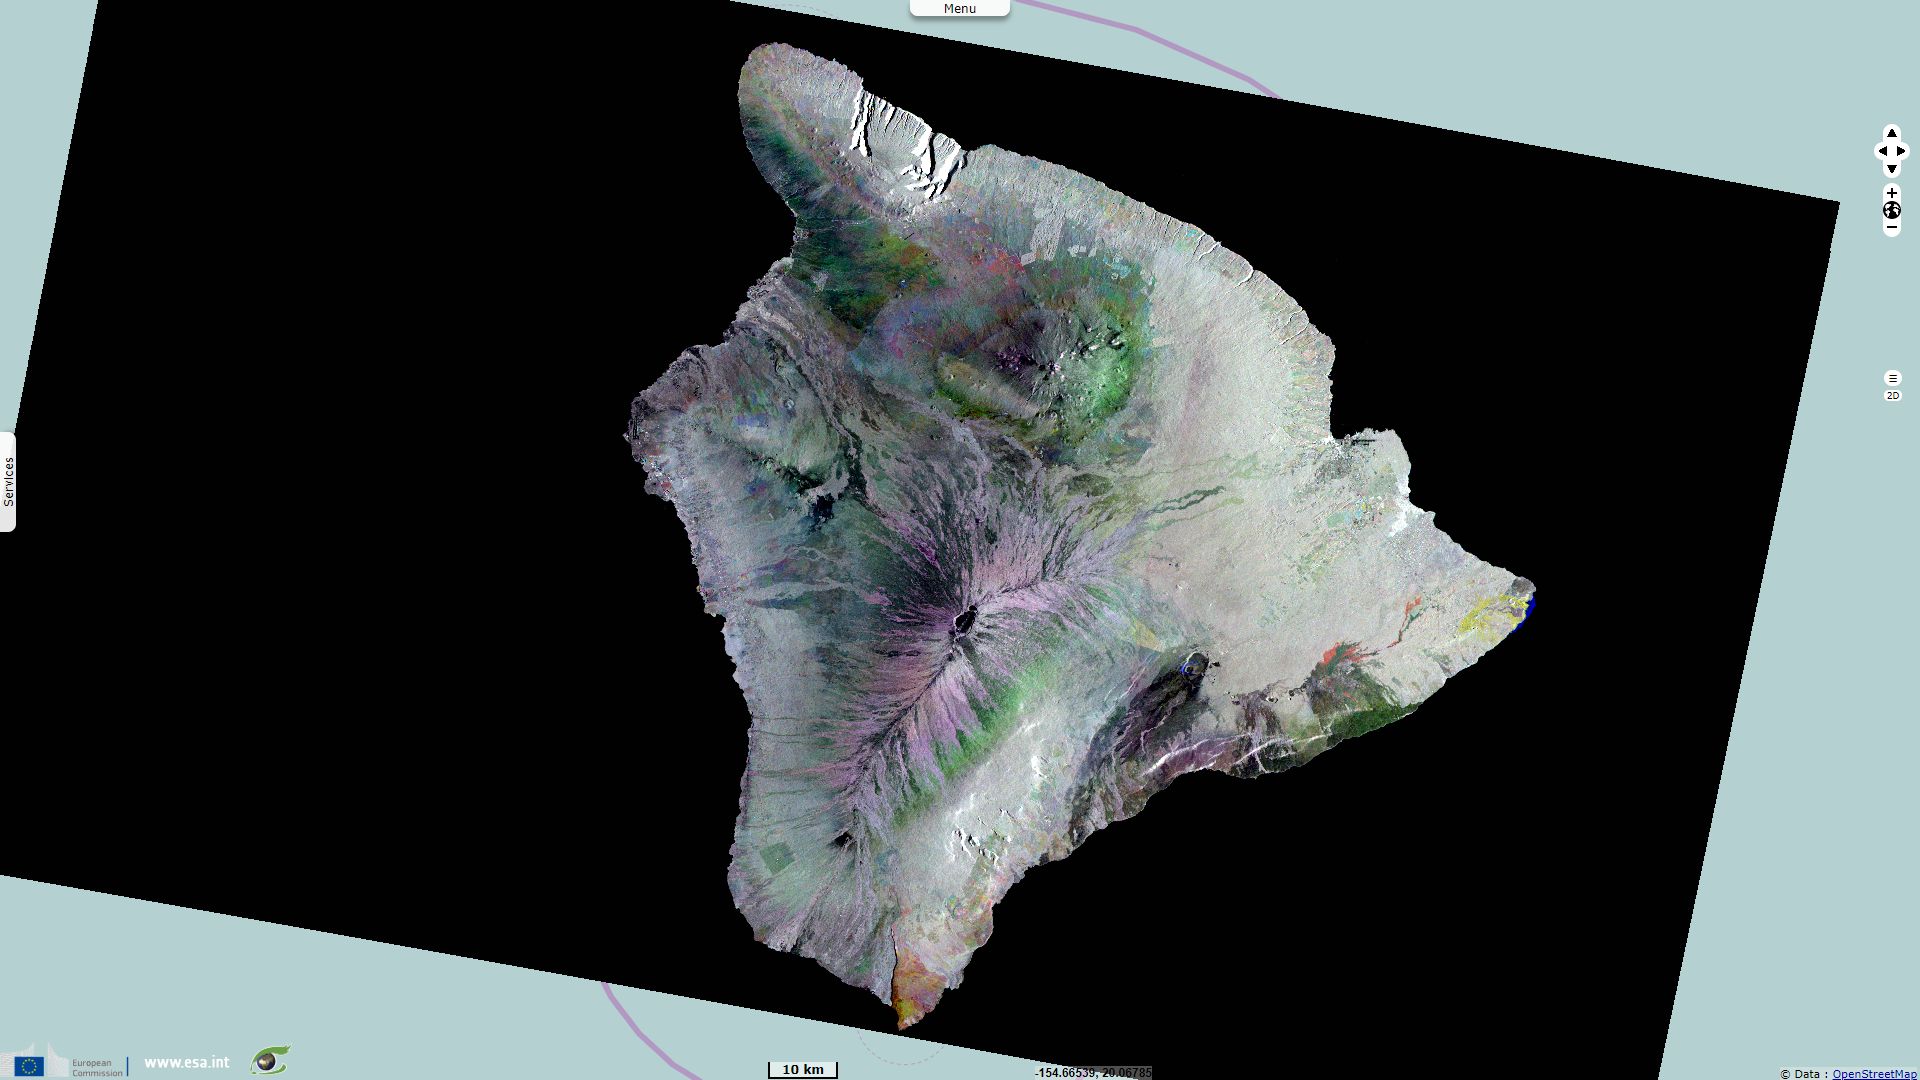
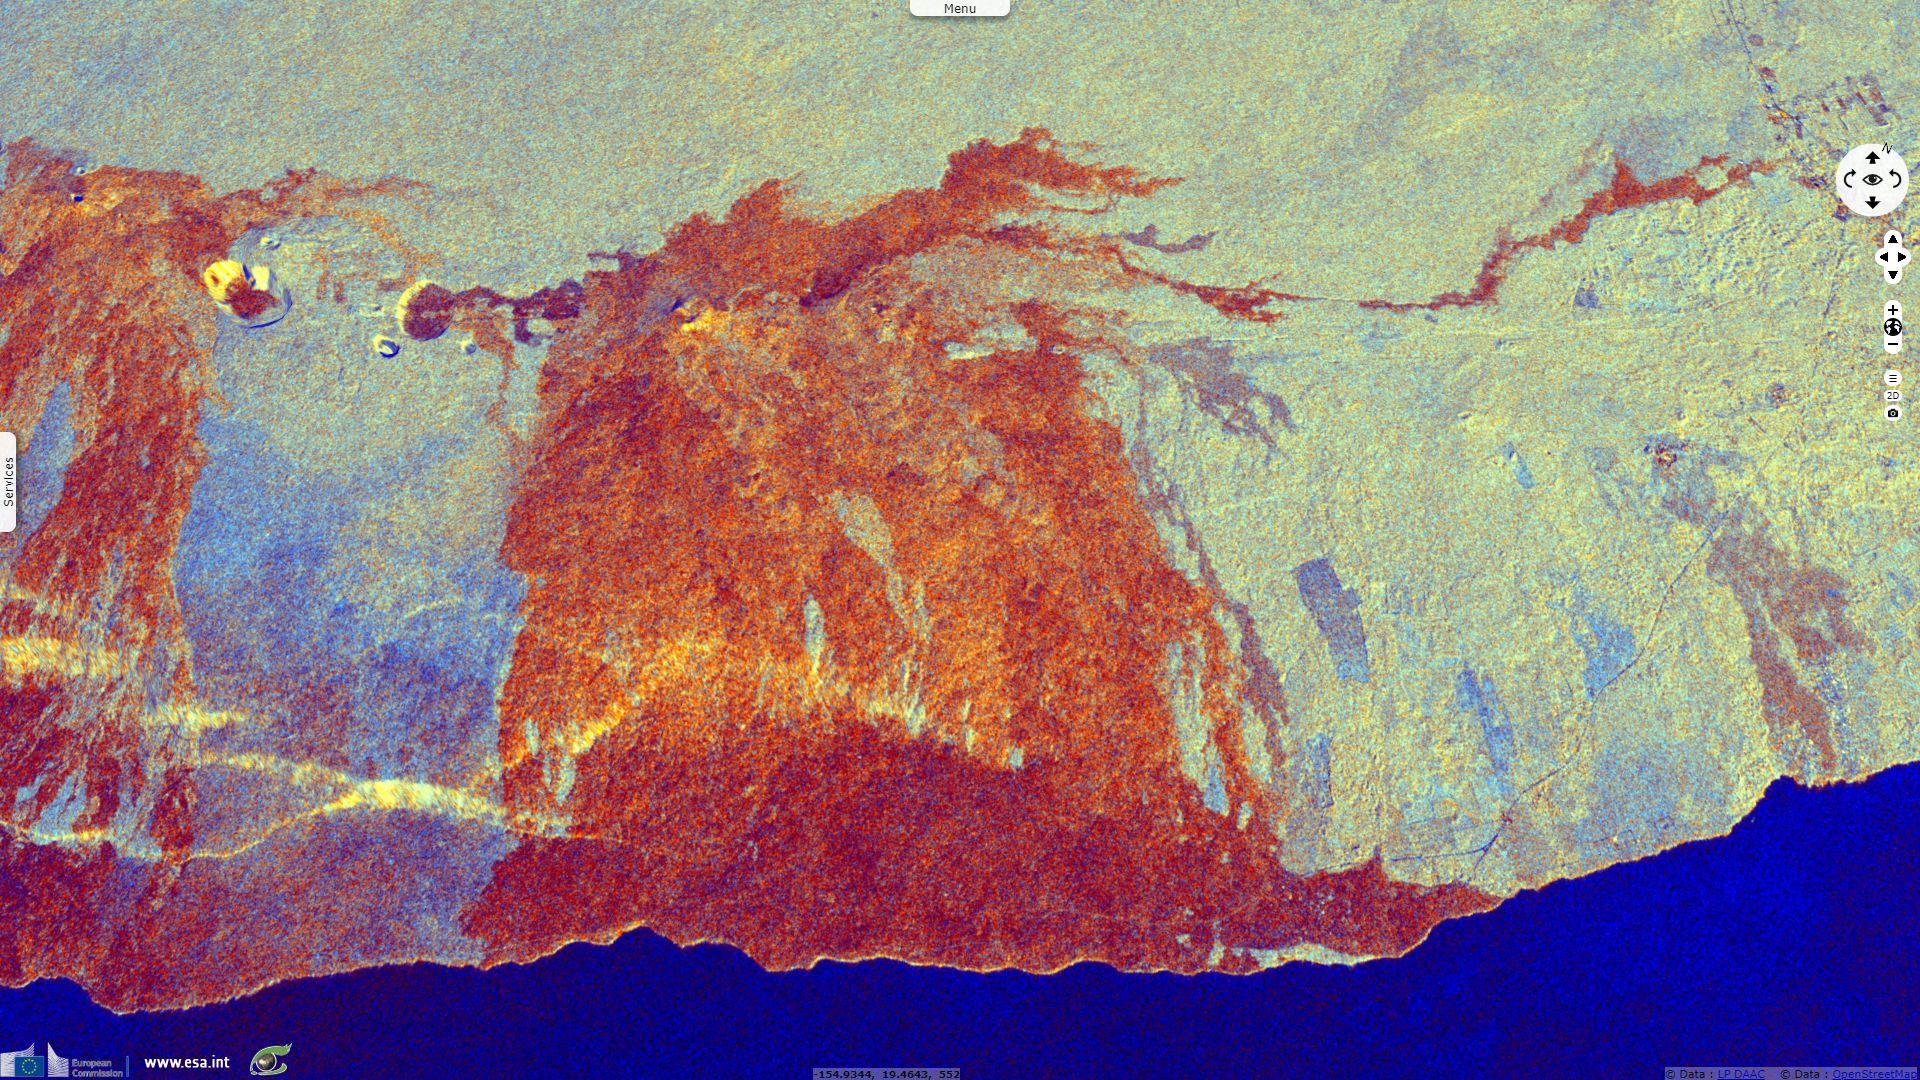
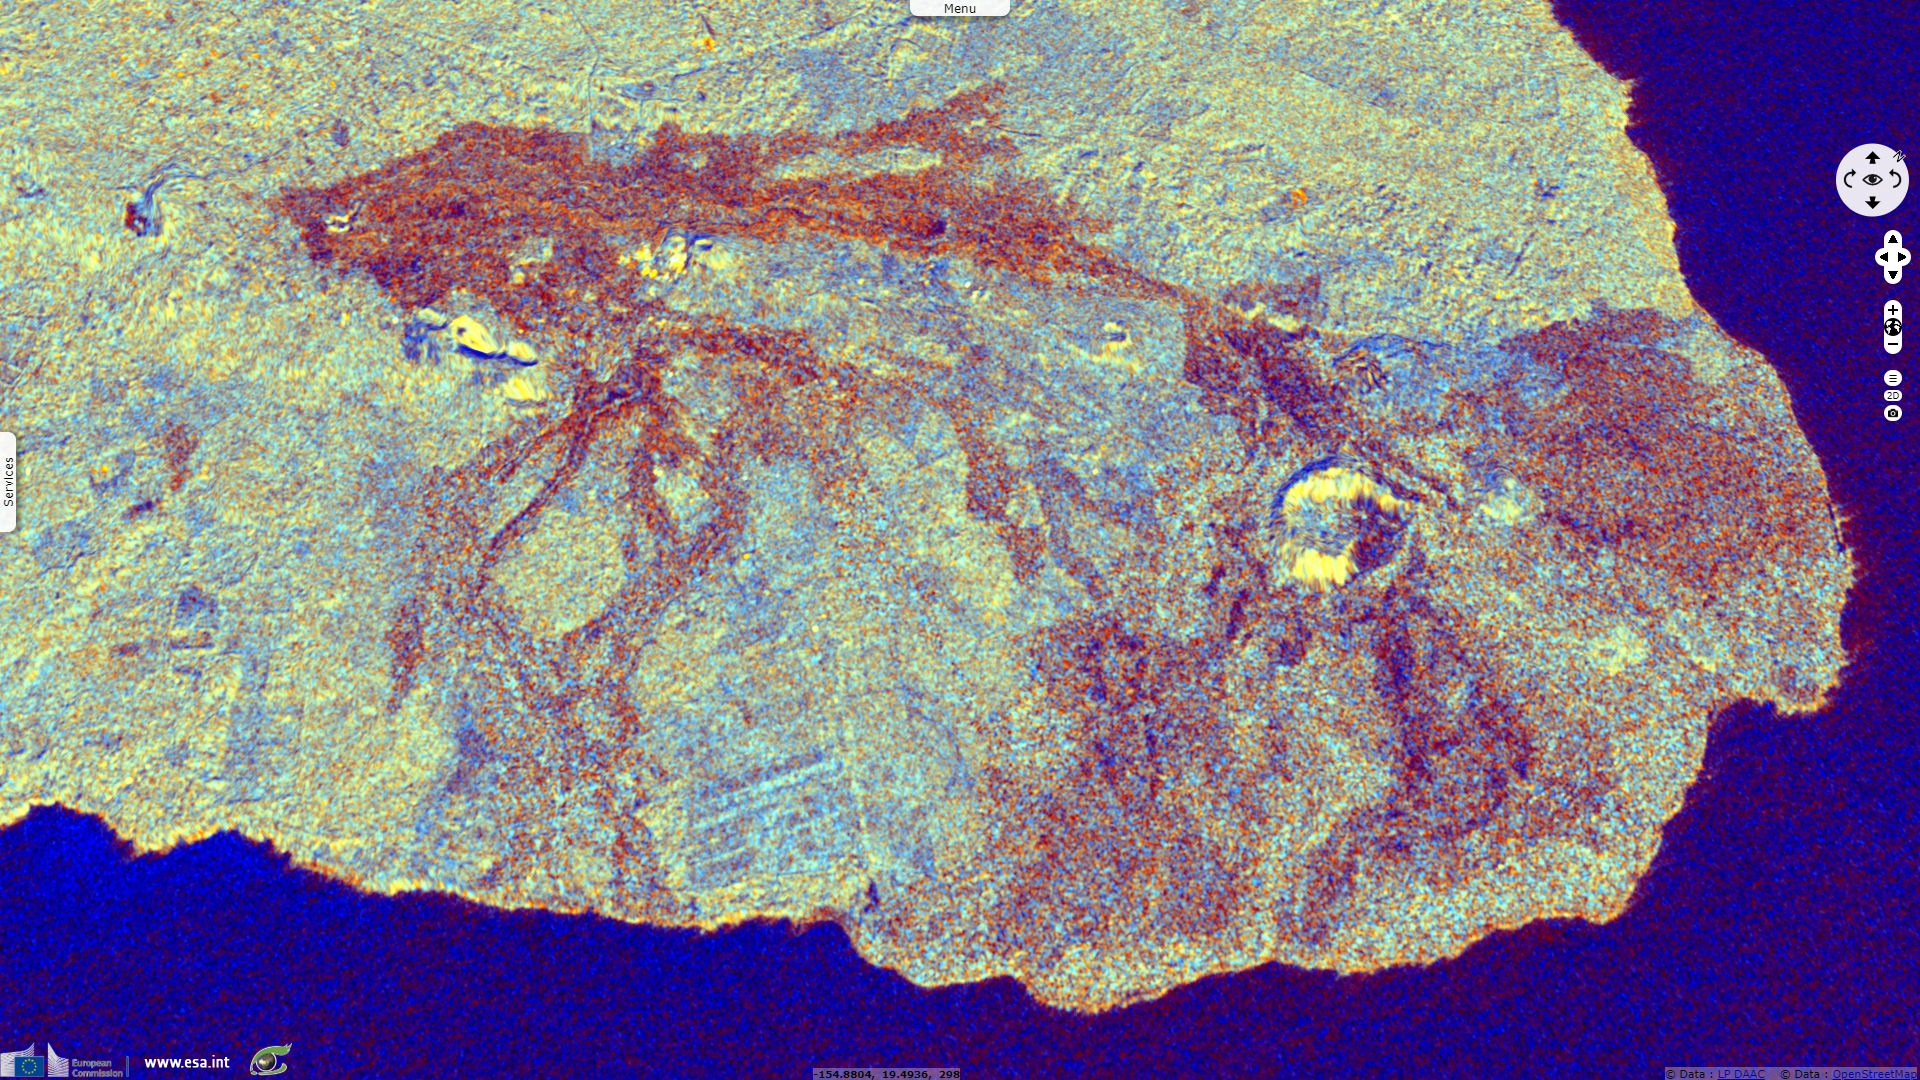
Similarly to fig.1, 3 successive acquisitions in homologous geometry were averaged to generate each of the 3 channels. Their σ0 value was retrieved and the bands were orthorectified. Only the VH polarisation was selected in the multidate composite shown in fig.2.
- The red channel is made of images acquired at the start of the S1A mission, in 2014, during the long lasting lower East Rift Zone eruption.
- The green channel is made of images acquired in Spring 2018, just before the apex of the eruption.
- The blue channel is made of images acquired in Spring 2019, several months after this intense eruptive episode finally ended.
- Red and cyan colour show something happened between 2014 and spring 2018.
- Yellow and blue tones show something happened between spring 2018 and Spring 2019.
- Greyish pixels indicate the location remained similar on the 3 time periods.
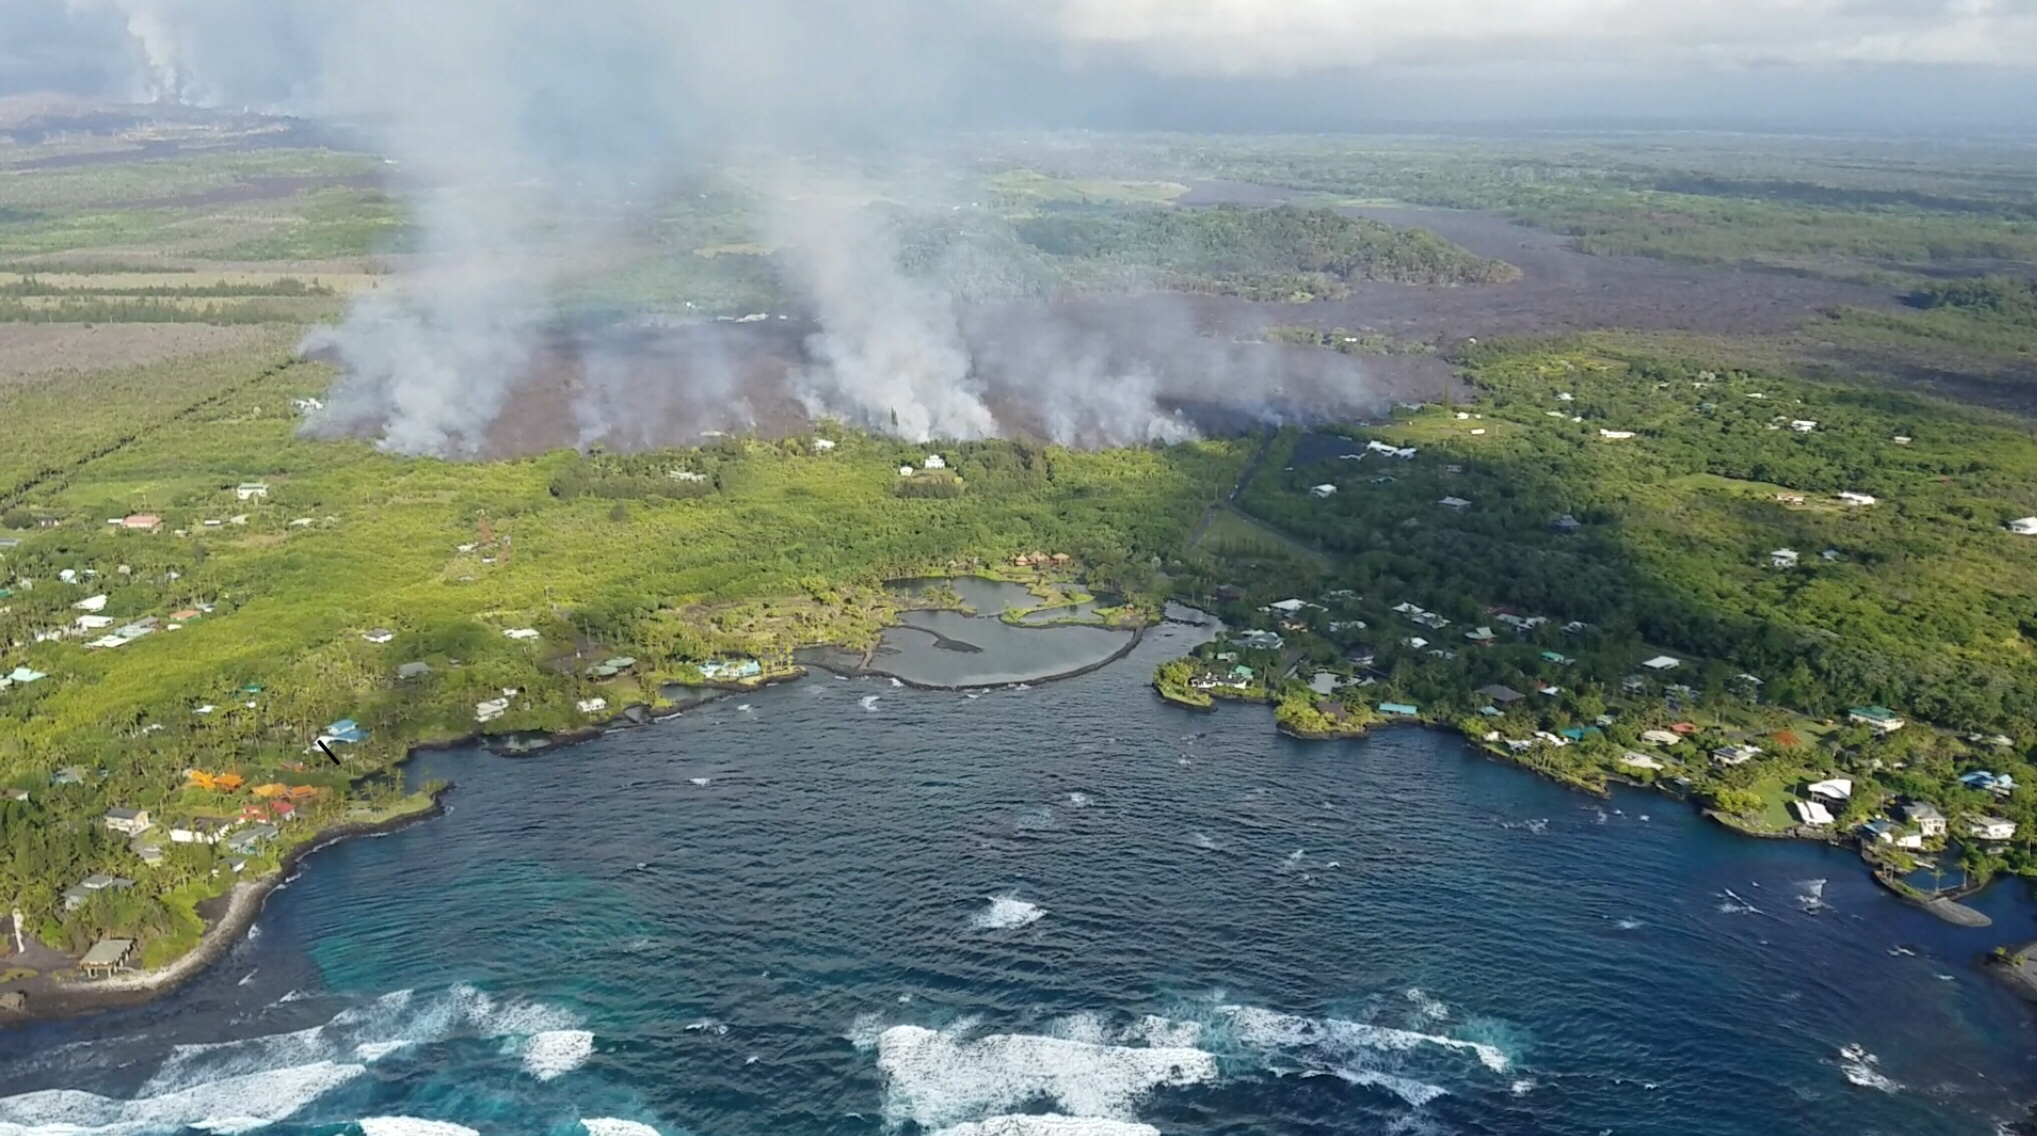
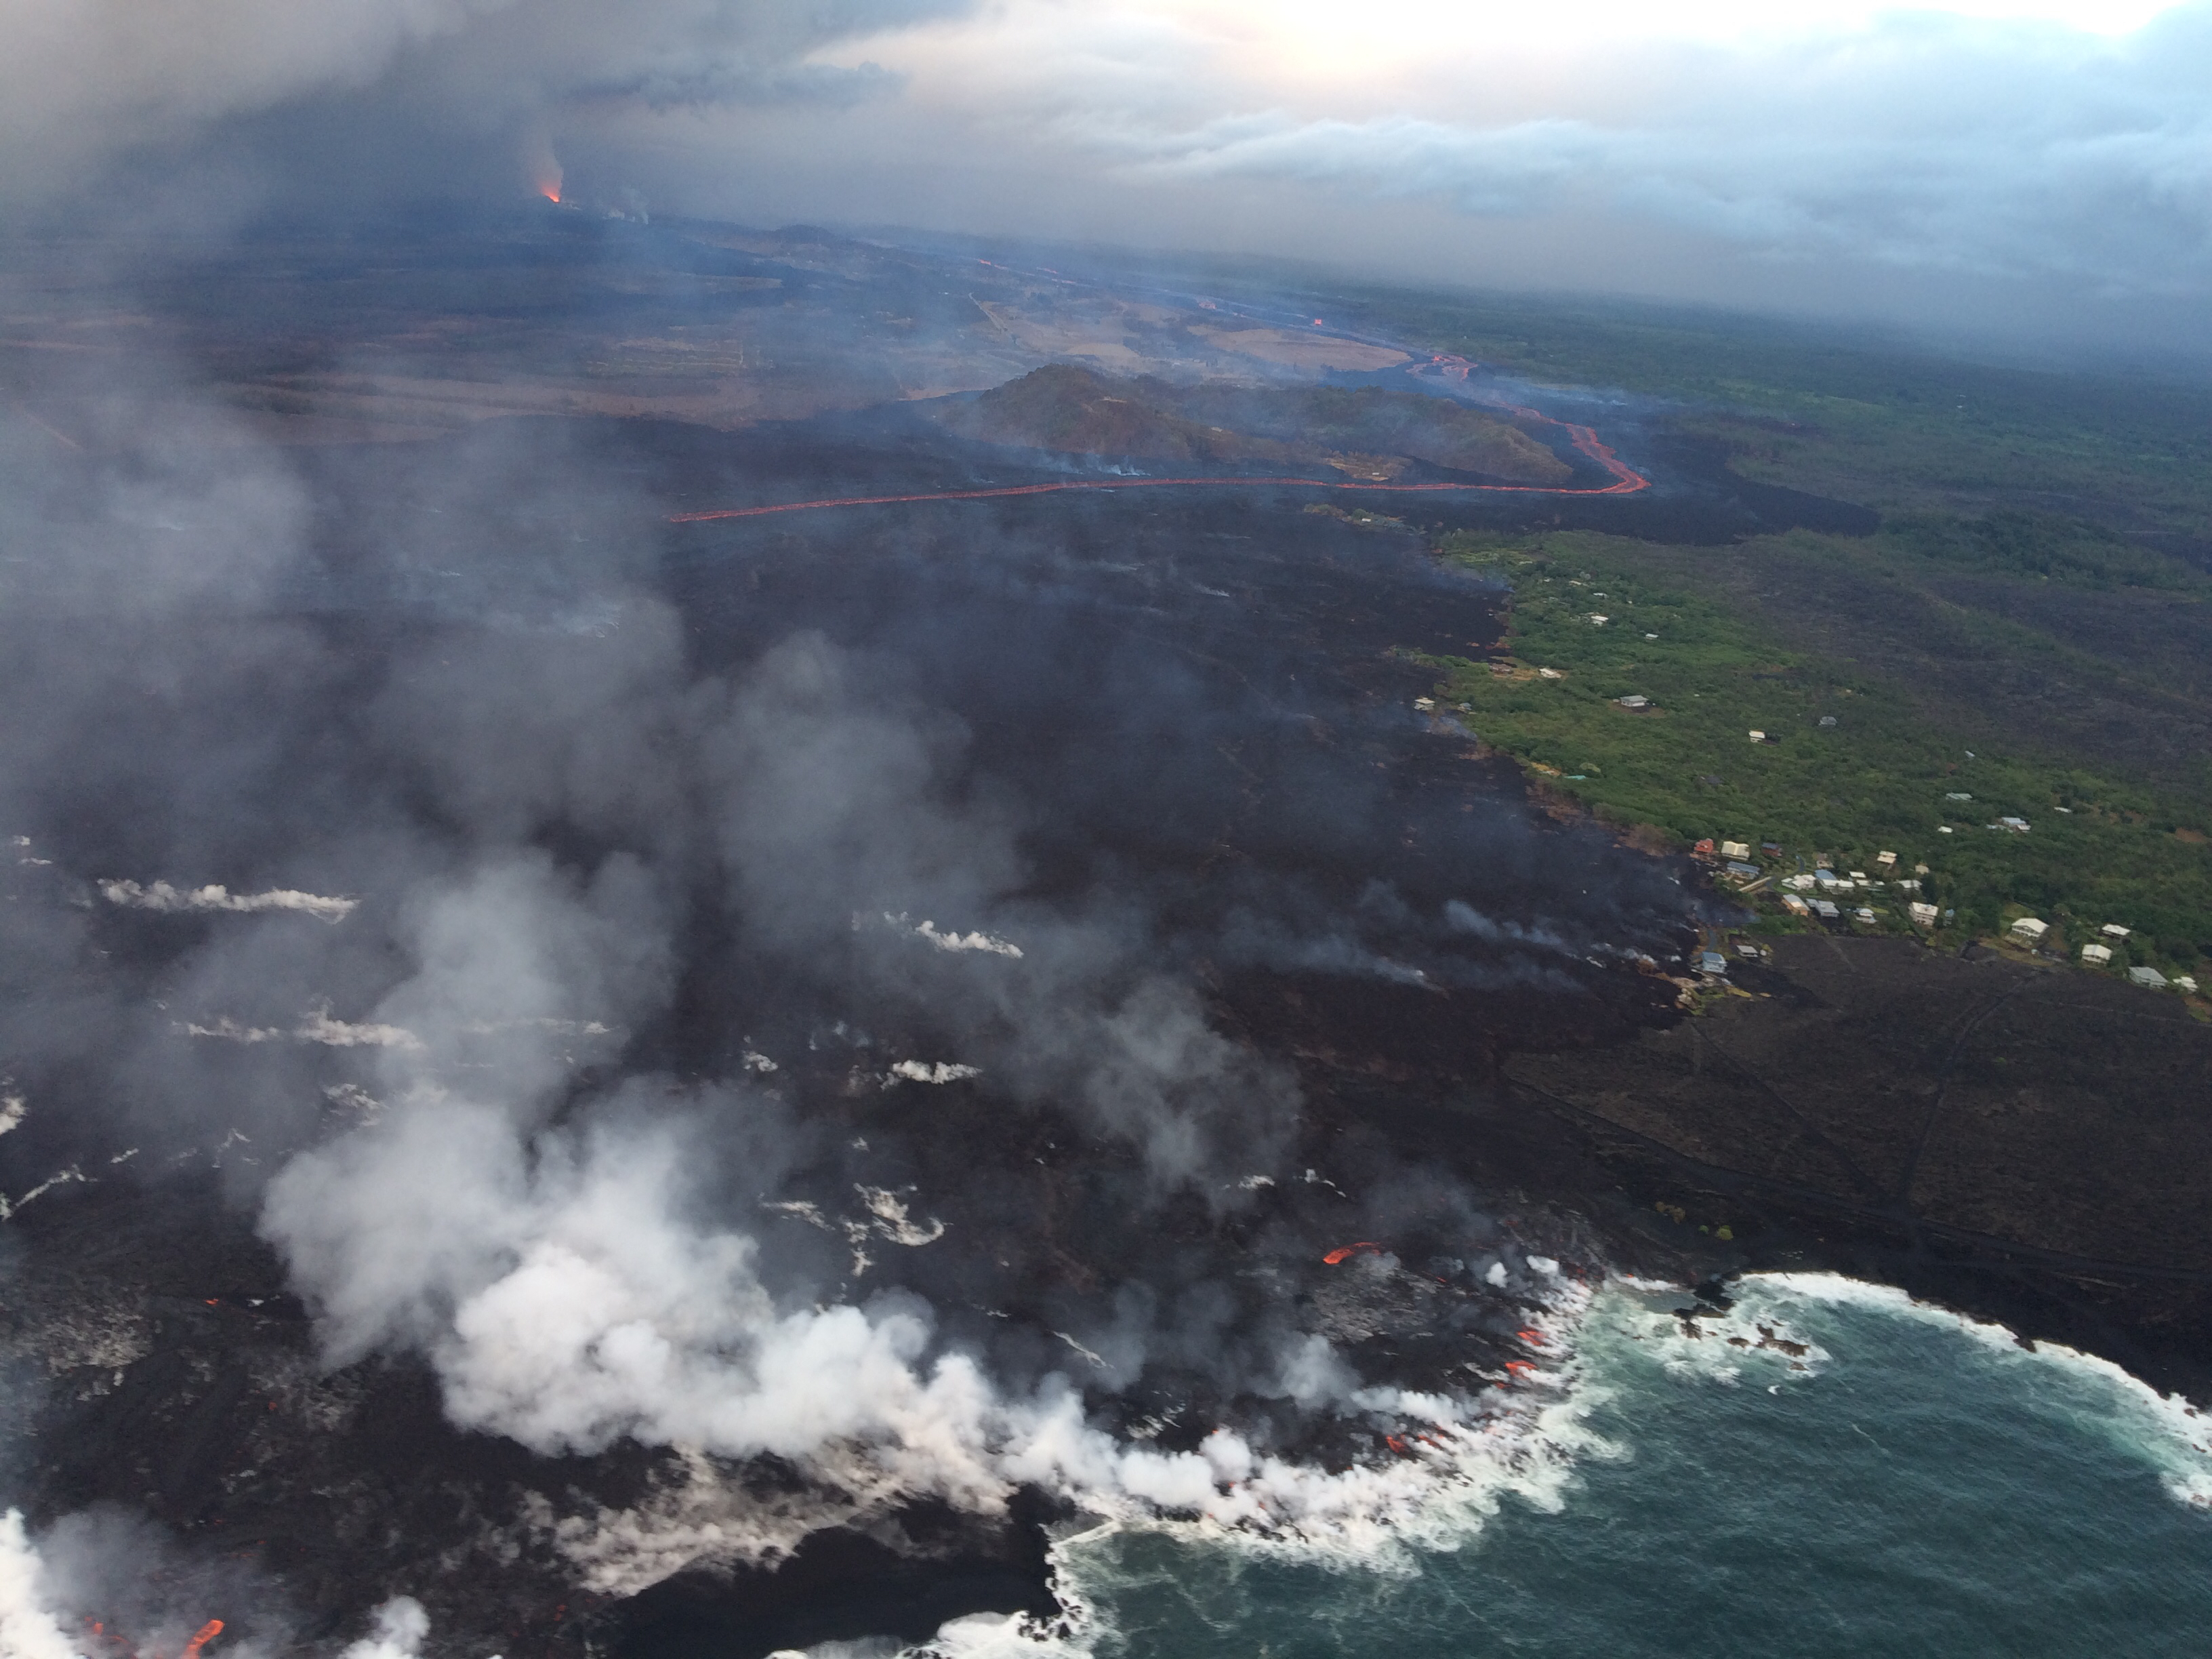
"June 3, 2018 - Kīlauea: Photo from 7AM helicopter overflight, hovering offshore and looking up the flowfront. Nearly all of the front was active and advancing; advance rates were estimated at an average of 250 feet/hour (76 m/hr), and as of 7AM the flow was 500 yards (457 m) from the ocean. - Source: USGS"
The summary of activity, dated from July-September 2018, reports: "The lava flow emerging from the fissure 8 cone on the Lower East Rift Zone continued unabated throughout July 2018. Overflows from the open channel were common, and often occurred a few hours after summit collapse events. There were multiple active ocean entry areas along the north, central, and southern portions of the coastal flow front of the fissure 8 flow at various times throughout the month. As the flow approached the delta area, lava spread out over the flow field and was no longer flowing on the surface but continued on the interior of the delta; numerous ocean entry points spanned the growing delta. In mid-July, an overflow diverted the channel W of Kapoho Crater, causing a new channel to the S of the delta that destroyed a park and a school, and increased the width of the delta to 6 km. The near-daily collapse events at Halema'uma'u crater continued until 2 August, transforming the geomorphology of the summit caldera."
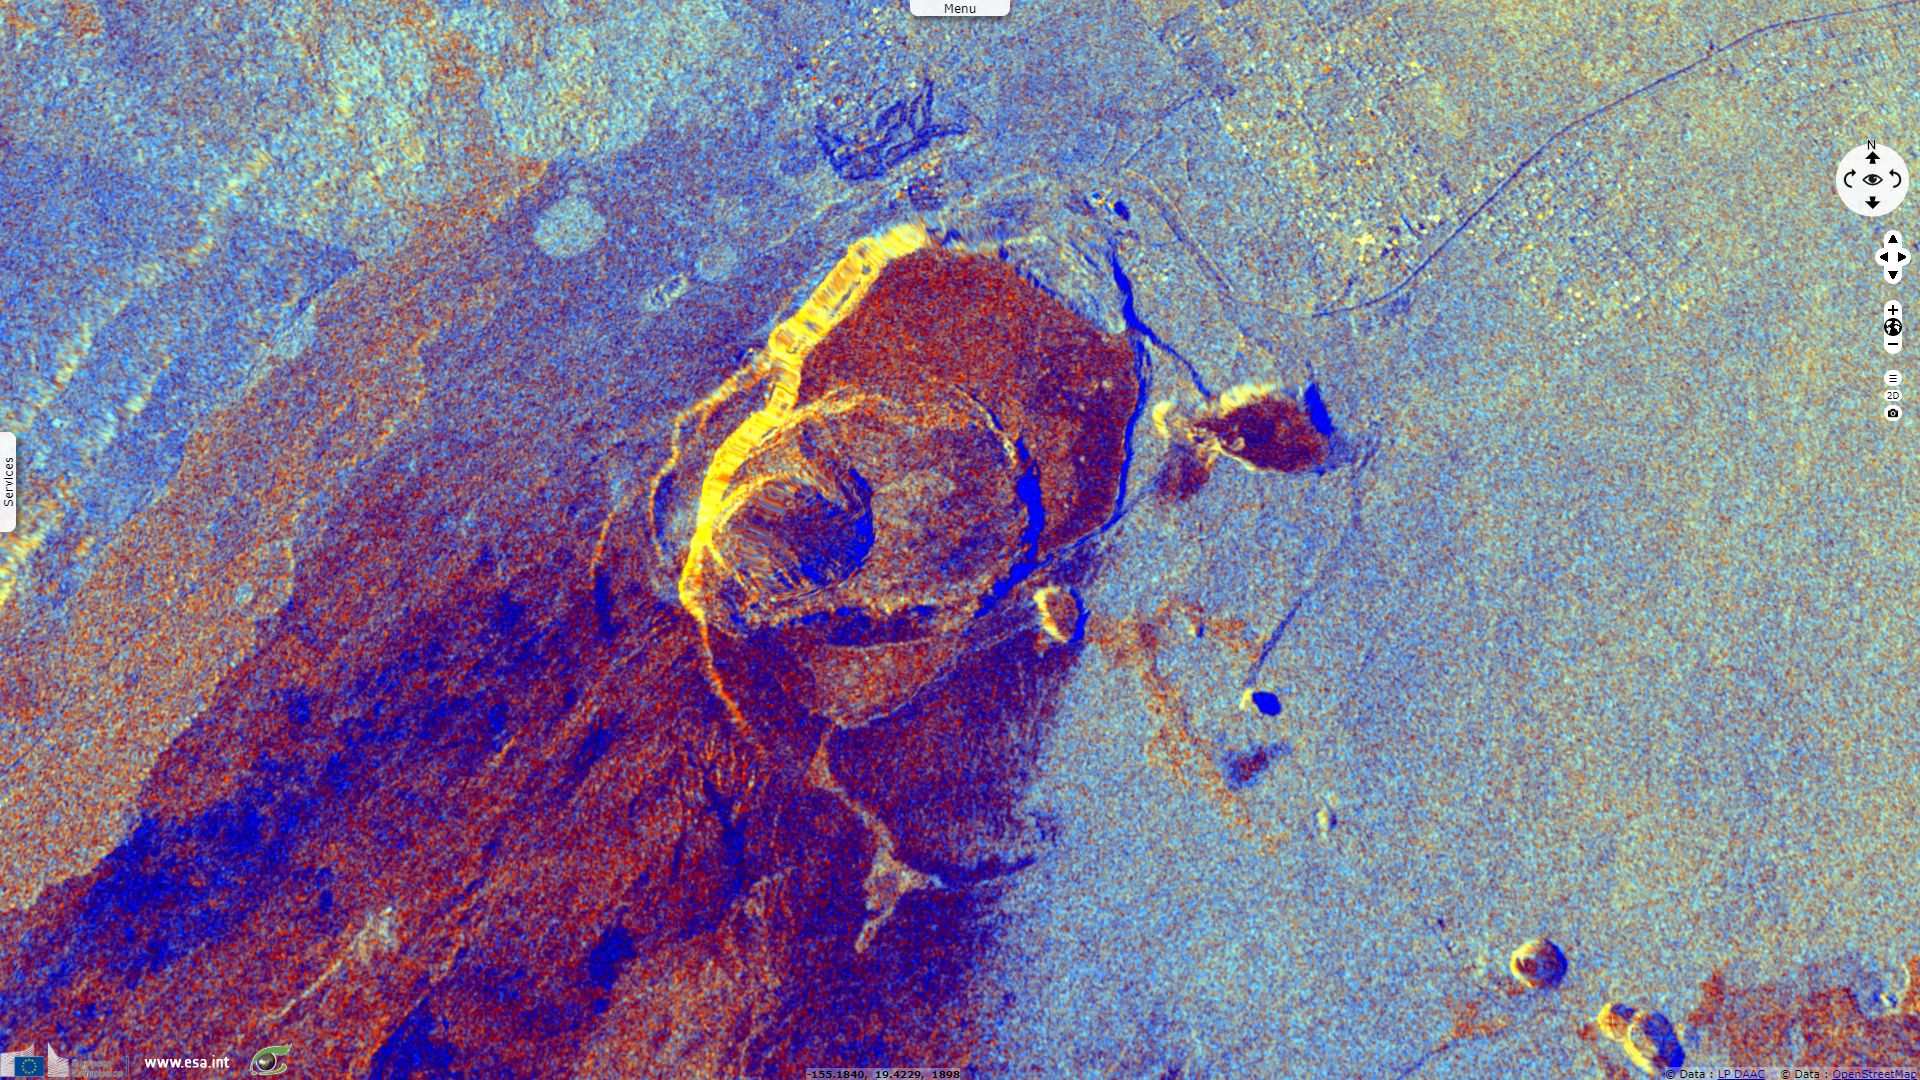
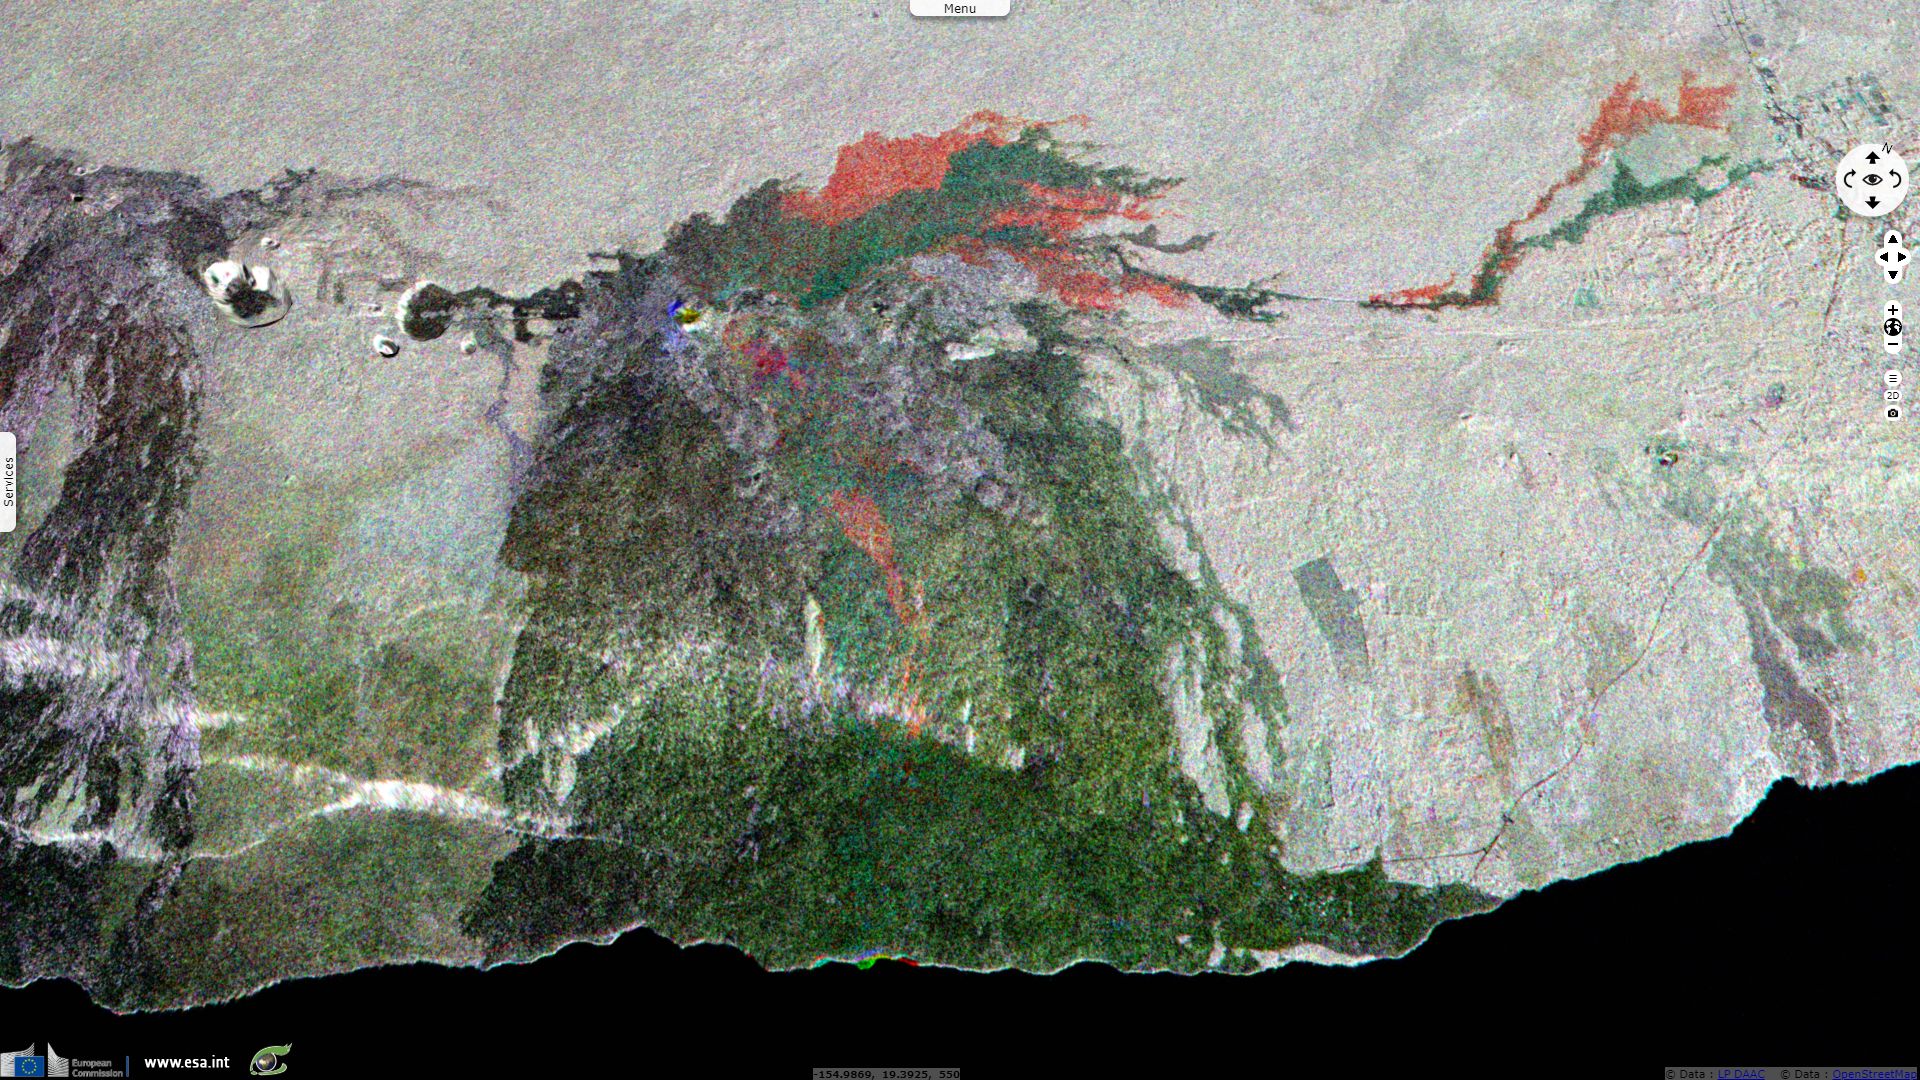
This image shows the fragmentation and the collapse of the south-west part of the caldera between the spring 2018 and the spring 2019.
The Lower East Rift Zone had already spewed abundant lava flows during this decades-long eruption when the first Sentinel-1 images were acquired.
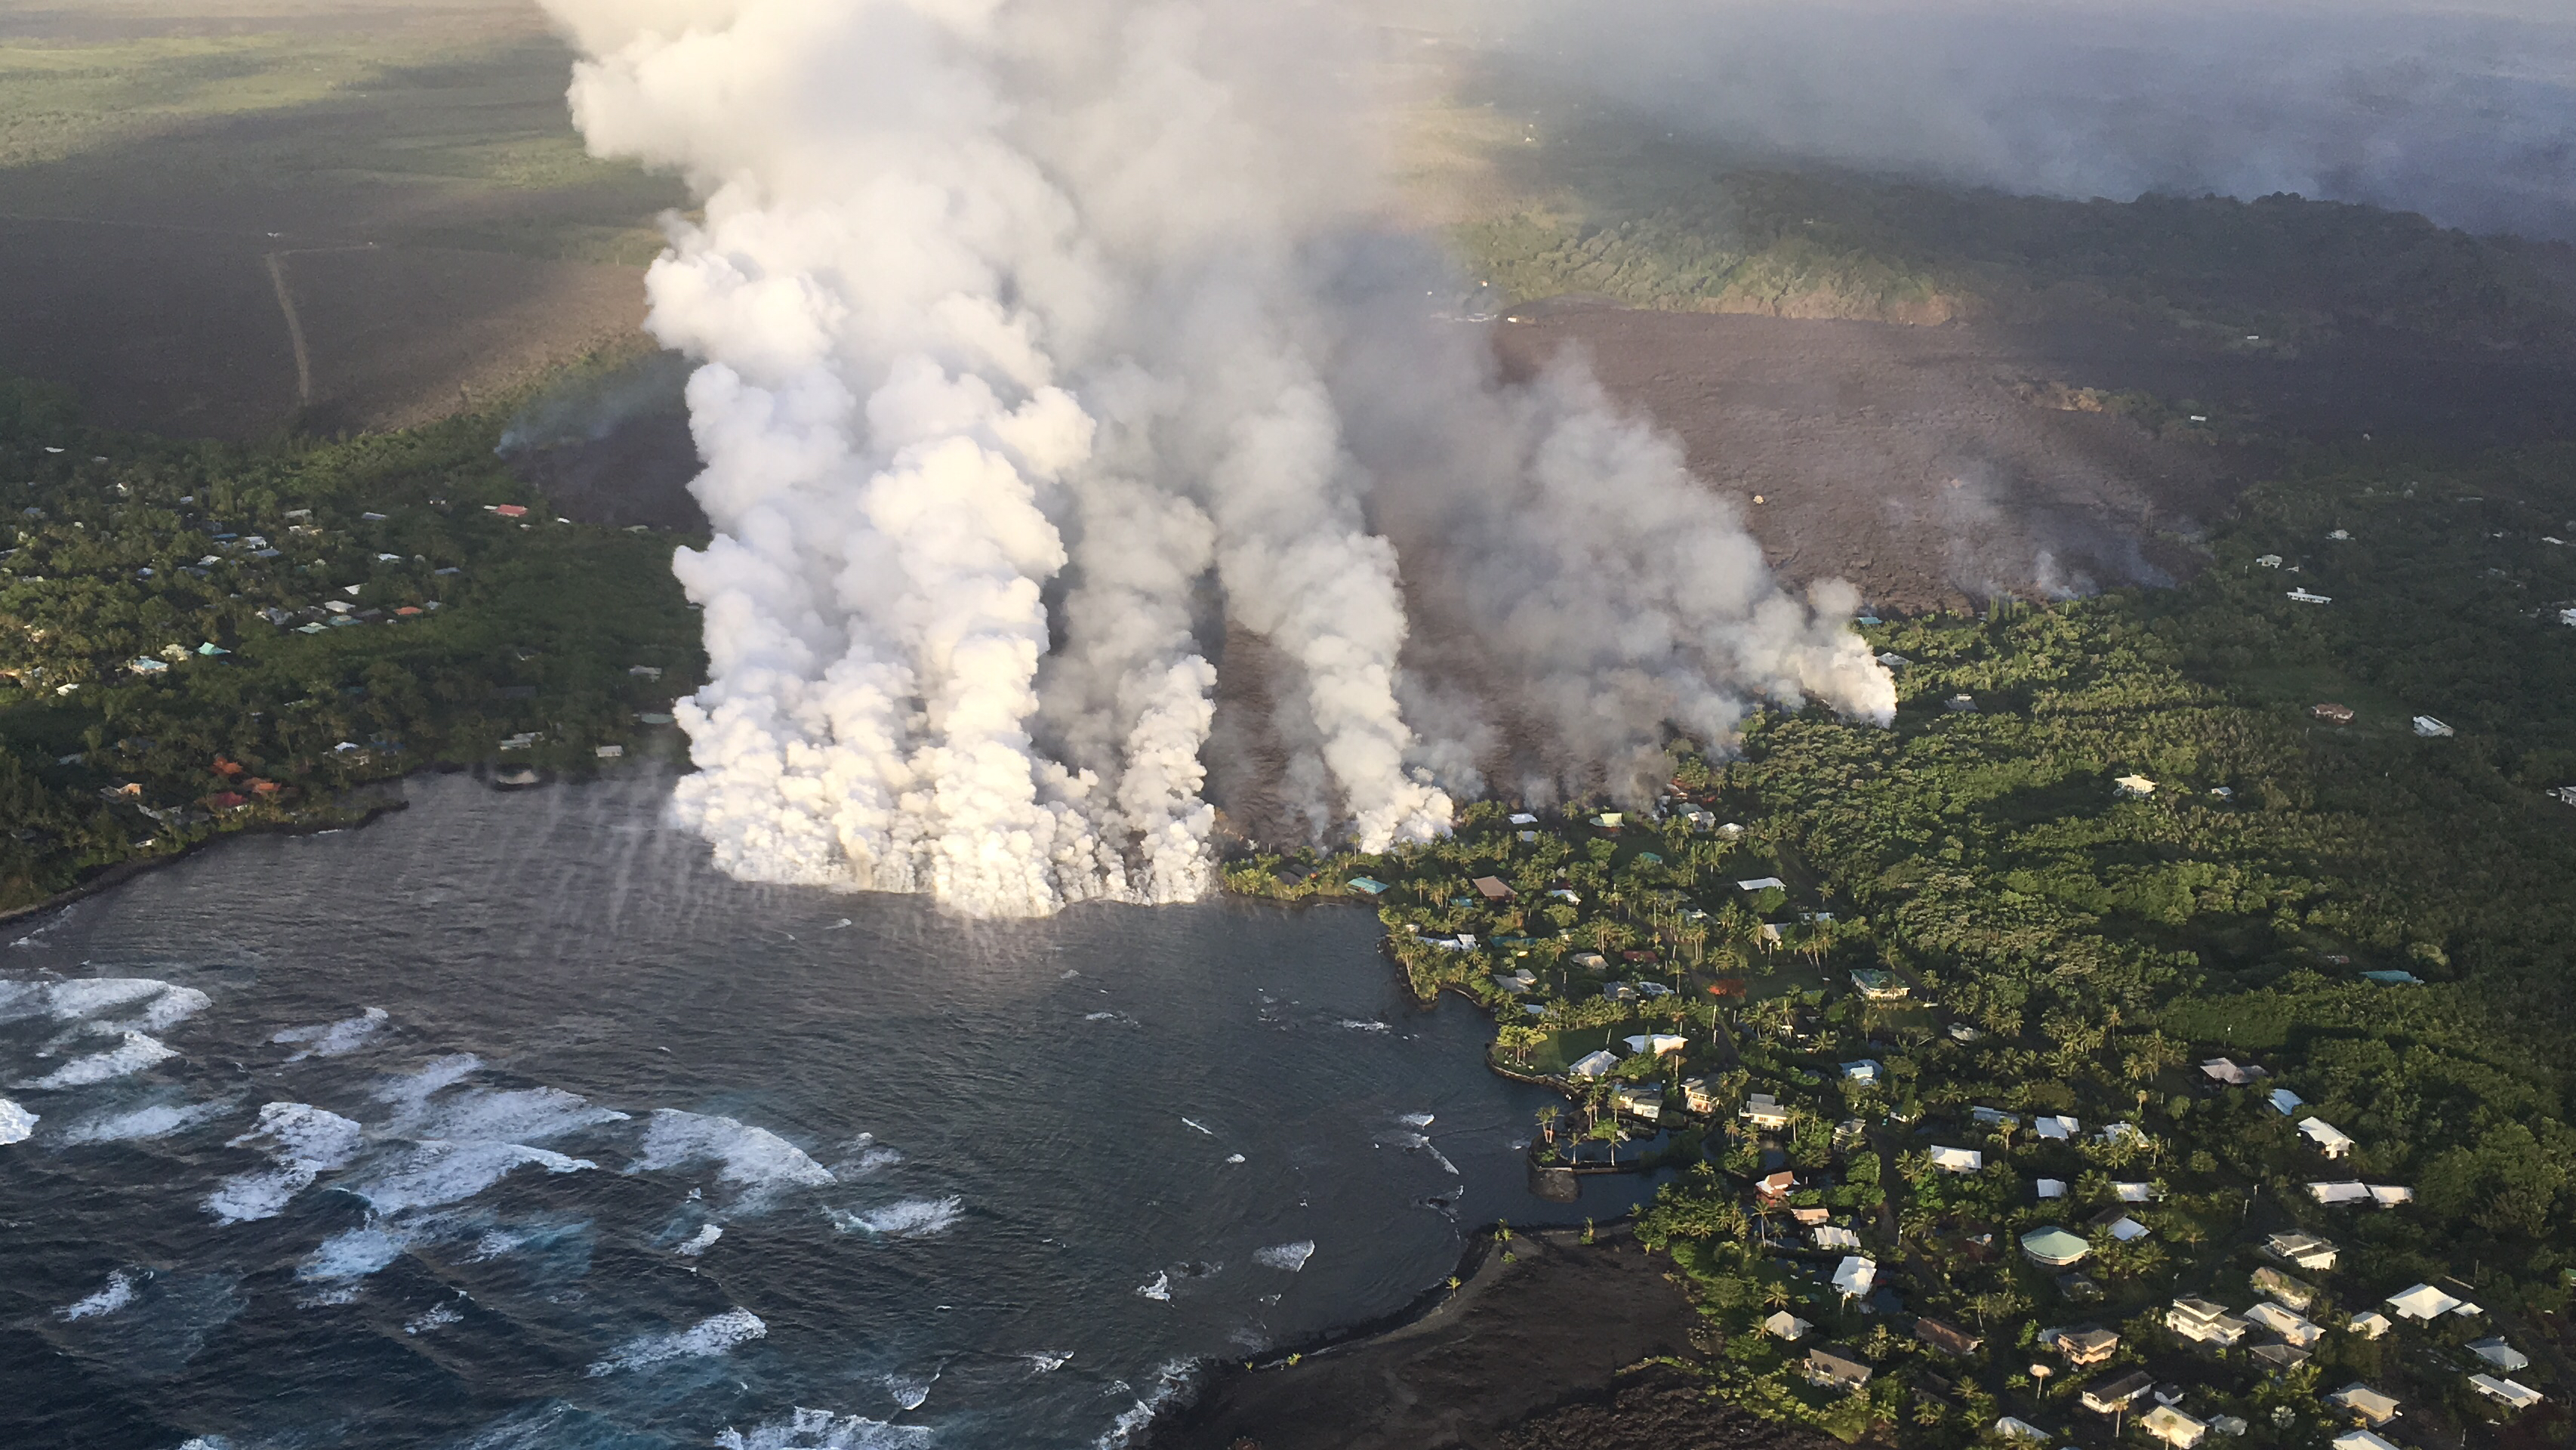
"June 4, 2018 - Kīlauea: Overflight photograph at approximately 6:13 a.m. HST shows the lava flow originating from Fissure 8 (not visible in photograph) entering Kapoho Bay. The ocean entry was reported to have occurred by 10:30 p.m. on the night of June 3, 2018. - Source: USGS"
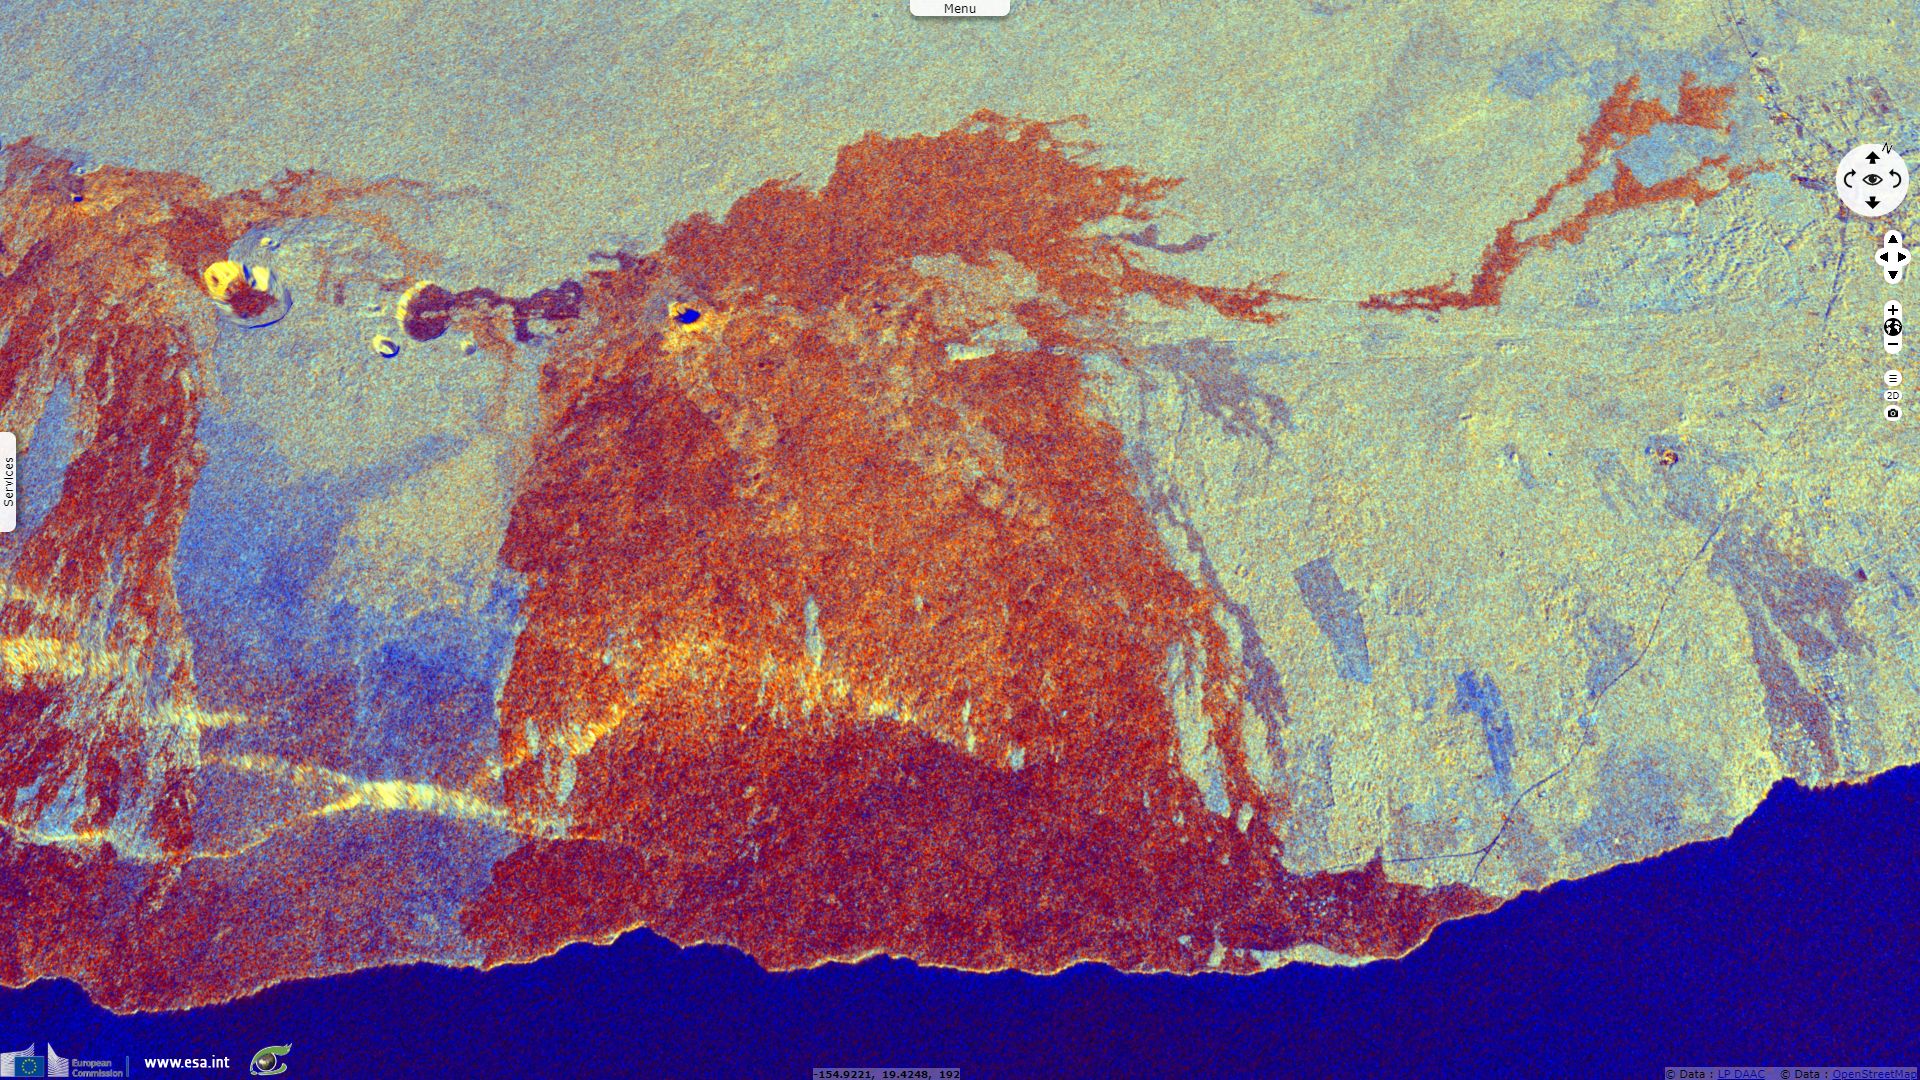
This multitemporal composite highlights the new lava flows and the changes in the Pu'u 'Ō'ō vent.
"Lower lava levels at the fissure 8 channel flow were first reported in early August; a reduced output from the cone was reported on 4 August and the lava level in the cone fell below the spillway the next day, shutting off the lava supply to the channel. The lava channel drained and crusted over during the next few days, but lava continued to enter the ocean at a decreasing rate for the rest of the month; the last ocean entry point had ceased by 29 August. A minor burst of spatter from gas jets inside the cone was noted on 20 August. The last activity was a small flow that covered the floor of the fissure 8 cone and created a small spatter cone during 1-5 September. Incandescence at the crater subsided during the next week until only steam activity was reported on the Lower East Rift Zone by the second half of September 2018."
"June 28, 2018 - Kīlauea: View of the ocean entry (lower left) from this morning's overflight. Lava was entering the ocean across a broad area primarily on the north part of the lava delta. Upslope along the northern margin of the flow field, lava is still oozing from several points in the area of Kapoho Beach Lots. Fissure 8 lava fountain in the upper left. Note southward bend in the lava channel around Kapoho Crater. - Source: USGS"
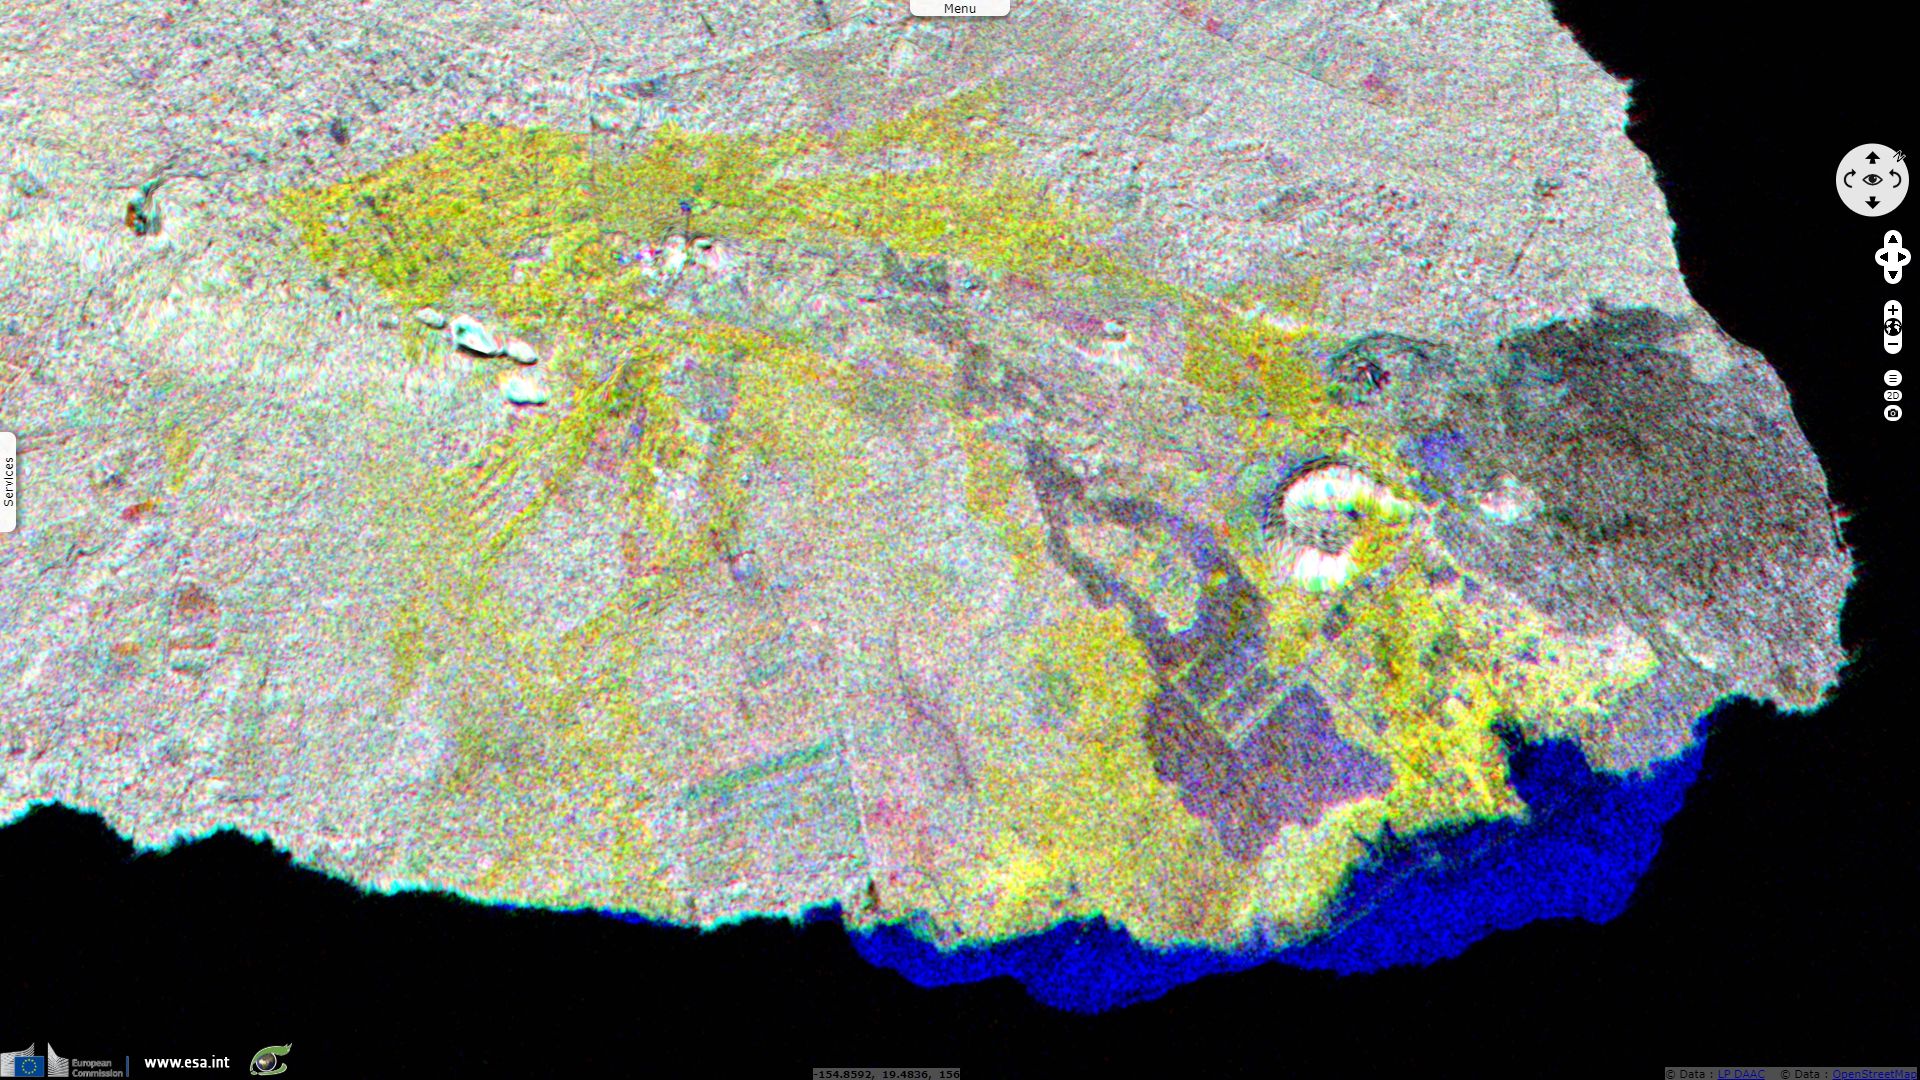
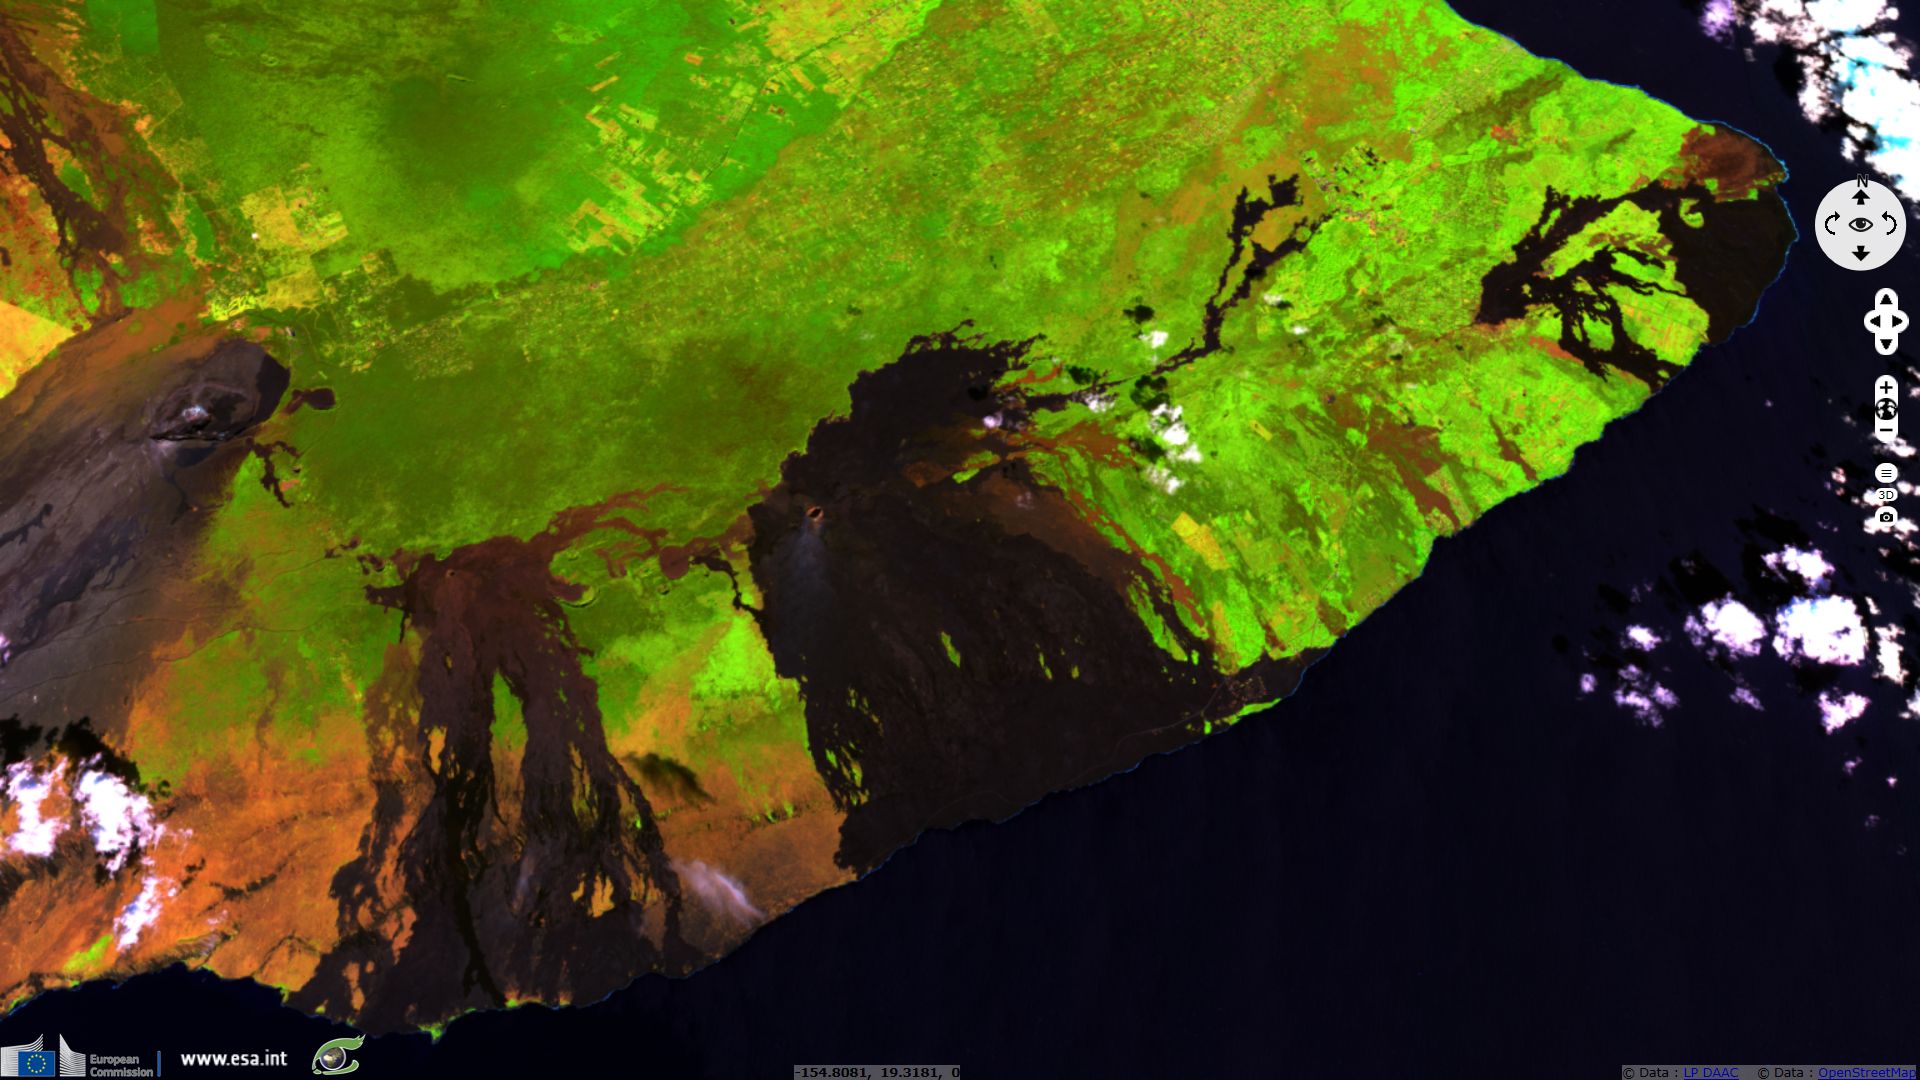
The lava flows show in dark on the VH polarisation. The flows consecutive to this episode of maximum intensity appear in yellow, pointing their recent origin. Showing in blue over the darker sea, the ocean entry of the lava (consecutive of the above flow) progressively built up several square kilometers of land area.
The views expressed herein can in no way be taken to reflect the official opinion of the European Space Agency or the European Union.
Contains modified Copernicus Sentinel data 2026, processed by VisioTerra.
Contains modified Copernicus Sentinel data 2026, processed by VisioTerra.
| More on European Commission space: |  |
 |
 |
||||
| More on ESA: | |
|
|
S-1 website | S-2 website | S-3 website | |
| More on Copernicus program: | |
|
|
Scihub portal | Cophub portal | Inthub portal | Colhub portal |
| More on VisioTerra: | |
|
|
Sentinel Vision Portal | Envisat+ERS portal | Swarm+GOCE portal | CryoSat portal |